Introduction
Over the last few decades, the prevalence of diabetes and other non-communicable diseases has been increasing in most low- and middle-income countries (LMICs) (Roglic & WHO, Reference Roglic2016; International Diabetes Federation, 2017; Xie et al., Reference Xie, Wang and Liu2018). It is estimated that 2.2% of the Global GDP will be lost by 2030 due to treating diabetes and its complications (Bommer et al., Reference Bommer, Sagalova, Heesemann, Manne-Goehler, Atun and Bärnighausen2018). Diabetes was once thought to primarily affect higher-income countries, but the prevalence is quickly rising in LMICs as well (Roglic & WHO, Reference Roglic2016; International Diabetes Federation, 2017; Zimmermann et al., Reference Zimmermann, Bunn, Namadingo, Gray and Lwanda2018). According to the 2017 International Diabetes Federation (IDF) Atlas, nearly 9% of adults aged 20–79 years, or 425 million people worldwide, were estimated to have diabetes (International Diabetes Federation, 2017). Adults living in LMICs make up about 79% of this total (International Diabetes Federation, 2017). The main elements contributing to the rise of this disease in LMICs are changes in lifestyle and dietary habits (NIPORT et al., 2013). Diabetes has physical, social and economic consequences. In LMICs, the economic burden of diabetes impoverishes both patients and their households in the form of high out-of-pocket expenditures (Seuring et al., Reference Seuring, Archangelidi and Suhrcke2015).
Bangladesh is also an LMIC where the prevalence of diabetes is increasing. The IDF Atlas projects that by 2045, the country of Bangladesh will have the ninth highest prevalence of diabetes in the world, with an estimated 13.7 million adults living with diabetes (International Diabetes Federation, 2017). Previous literature shows that the rate of diabetes in Bangladesh is between 9 and 11% (Chowdhury et al., Reference Chowdhury, Uddin, Khan and Haque2015; M. S. Rahman et al., Reference Rahman, Akter, Abe, Islam, Mondal, Rahman and Rahman2015; Mosiur Rahman et al., Reference Rahman, Nakamura and Kizuki2015; Akter et al., Reference Akter, Rahman, Abe and Sultana2014a, b; Khan et al., Reference Khan, Gruebner and Kraemer2014). It is essential to address factors that increase the burden of diabetes so that high-risk populations can be identified, and these individuals’ awareness, control and participation in prevention programmes can be prioritized (Barroga & Kojima, Reference Barroga and Kojima2013; Antay-Bedregal et al., Reference Antay-Bedregal, Camargo-Revello and Alvarado2015). Although the prevalence of diabetes and other non-communicable diseases is rising, there have been limited investigations identifying the determinants of non-communicable diseases such as diabetes in Bangladesh.
Earlier studies on the risk factors and socioeconomic determinants of diabetes in Bangladesh have shown that there are some differences in the predictors of the disease in this country. Bangladeshi adults with overweight/obesity, urban residence, higher education level and wealth status have an increased prevalence and likelihood of diabetes (Akter et al., Reference Akter, Rahman, Abe and Sultana2014b; Khan et al., Reference Khan, Gruebner and Kraemer2014; Chowdhury et al., Reference Chowdhury, Uddin, Khan and Haque2015). However, several methods have been used to estimate the determinants. In additive scales, absolute differences are used to understand the differences in burden. In multiplicative scale, the odds ratio (OR) and the risk ratio (RR) are two common measures. Instead of the RR, in cross-sectional studies the prevalence ratio (PR) has been used (Zocchetti et al., Reference Zocchetti, Consonni and Bertazzi1997; Tamhane et al., Reference Tamhane, Westfall, Burkholder and Cutter2016). Previous studies investigating the determinants or predictors of diabetes in Bangladesh have estimated their measures of association using the OR (Saquib et al., Reference Saquib, Khanam, Saquib, Anand, Chertow and Barry2013; Akter et al., Reference Akter, Rahman, Abe and Sultana2014a; Khan et al., Reference Khan, Gruebner and Kraemer2014; Chowdhury et al., Reference Chowdhury, Uddin, Khan and Haque2015). Past literature reveals that even though using ORs is more common, it can overestimate measures of association compared with the PR (Zocchetti et al., Reference Zocchetti, Consonni and Bertazzi1997; Tamhane et al., Reference Tamhane, Westfall, Burkholder and Cutter2016). Furthermore, the OR produces confidence intervals (CIs) that are generally wider than confidence intervals for the PR, which may mean that estimates for the OR are less precise than for the PR (Zocchetti et al., Reference Zocchetti, Consonni and Bertazzi1997). The PR is also easier to understand compared with the OR. Estimating both the PR and OR may be helpful, not only for comparing the determinants of diabetes across similar studies focusing on Bangladesh and/or other South Asian countries, but also for assessing predictors of diabetes using a more precise and conservative method.
Considering the limited research available on determinants of diabetes in Bangladesh, more studies are required to understand associated factors of diabetes in Bangladesh, and to re-confirm the significance of the factors identified by previous studies. This study attempted to contribute to these existing gaps in the literature by examining the factors associated with diabetes in Bangladesh by estimating both the PR and OR. The findings of this study would be helpful for policymakers and researchers to develop effective prevention strategies to prevent diabetes in Bangladesh.
Methods
This cross-sectional secondary analysis was accomplished using data collected for the 2011 Bangladesh Demographic and Health Survey (BDHS 2011). From July 2011 to January 2012, Mitra and Associates conducted the BDHS 2011 with support from the National Institute of Population Research and Training (NIPORT) and ICF International (NIPORT et al., 2013). The BDHS 2011 study protocol was approved by the ICF International and Bangladesh Medical Research Council Institutional Review Board, and each participant provided verbal informed consent to participate in the survey (NIPORT et al., 2013).
Survey respondents
The survey used a nationally representative sample including individuals from all regions of Bangladesh. The BDHS 2011 was accomplished with the main aim of estimating key maternal and childhood indicators, but also included blood pressure and blood glucose measures for men and women age 35 years and older (NIPORT et al., 2013).
A description of the two-stage sampling design, study methodology and sample size has been reported in detail elsewhere (NIPORT et al., 2013). Briefly, a list of enumeration areas (EAs) consisting of about 120 households was developed from the 2011 Population and Housing Census. These EAs were used as the primary sampling units (PSUs) and were selected with a probability based on EA size. During the first stage, 600 EAs consisting of 207 clusters from urban areas and 393 clusters from rural areas were selected to provide a sampling frame of households for the next stage. In stage two, an average of 30 households were chosen from each EA to provide estimates of demographic and health data for the entire country, for rural and urban areas separately, and for each of the country’s seven divisions. Among these 18,000 households, about one-third were selected to participate in blood pressure and blood glucose tests. The response rates for blood glucose tests were 89% for women and 83% for men (NIPORT et al., 2013).
Measures
A subsample of survey individuals was selected for blood glucose testing. A team of trained research staff collected a fasting capillary whole-blood sample from the middle or ring finger of these individuals. The collected sample was then analysed using a HemoCue 201+ blood analyser. The analyser provided the blood glucose measurements in units of mg/dl, and were converted to mmol/l by multiplying values by 0.0551. The whole-blood measurements were further modified by multiplying by 1.11 to convert the measures to the equivalent plasma glucose values, as recommended by the WHO. Fasting glucose values were then categorized into normal (3.9–6.0 mmol/l), pre-diabetes (6.1–6.9 mmol/l) and diabetes (≥7.0 mmol/l), which correspond to the 2006 WHO cut-points for fasting plasma glucose (WHO and International Diabetes Federation 2006). For the present analysis, only respondents who gave samples for blood glucose measurement were included. Sampled individuals were also asked questions regarding prior diagnosis of diabetes and whether they were currently taking medication for diabetes. Further details regarding methods used to measure diabetes have been published previously in the BDHS 2011 report (NIPORT et al., 2013).
Survey respondents reported their age, sex, education and work status. To categorize overweight/obesity status, body mass index (BMI) was calculated by dividing weight (kg) by squared height (m2). Body mass indexes of 25–29 kg/m2 and ≥30 kg/m2 were classified as overweight and obese, respectively. Place of residence (urban, rural) and division of residence (Barisal, Chittagong, Dhaka, Khulna, Rajshahi, Rangpur, Sylhet) were also reported. Wealth index (poorest, poor, middle, rich, richest) was determined based on a composite index of household materials, such as housing structure, water and electricity sources and sanitation facilities (NIPORT et al., 2013).
Statistical analysis
First, the survey participants were described according to age, sex and other background characteristics. All continuous variables were reported with median and interquartile ranges (IQR) after assessing the normality of the study variables. The categorical variables were reported with frequencies and percentages. All the numbers, percentages and other medians were reported after accounting for provided sample weights. Then, log-binomial regression and logistic regression were used to obtain PRs and ORs, respectively. Both PRs and ORs were reported with 95% Confidence Interval (95% CI) and significance levels. Both the unadjusted and adjusted PRs and ORs were reported. Variables with a significance level below 0.2 in the unadjusted (i.e. crude) association were included in the multivariable analysis to prevent residual confounding (Maldonado & Greenland, Reference Maldonado and Greenland1993); all variables were re-confirmed by stepwise regression methods. Variance inflation factors (VIF) were obtained using a fake linear regression model to estimate the multicollinearity among explanatory variables; variables with VIFs greater than 10 were considered for removal from the analysis. The cluster sampling design of the survey was addressed in the reporting of the weighted frequencies and proportions, as well as in the analysis, to obtain measures of association. The proportion of missing data was low (<2%); no missing data were imputed. All analyses were done with Stata 14.0 (College Station, TX, USA).
Results
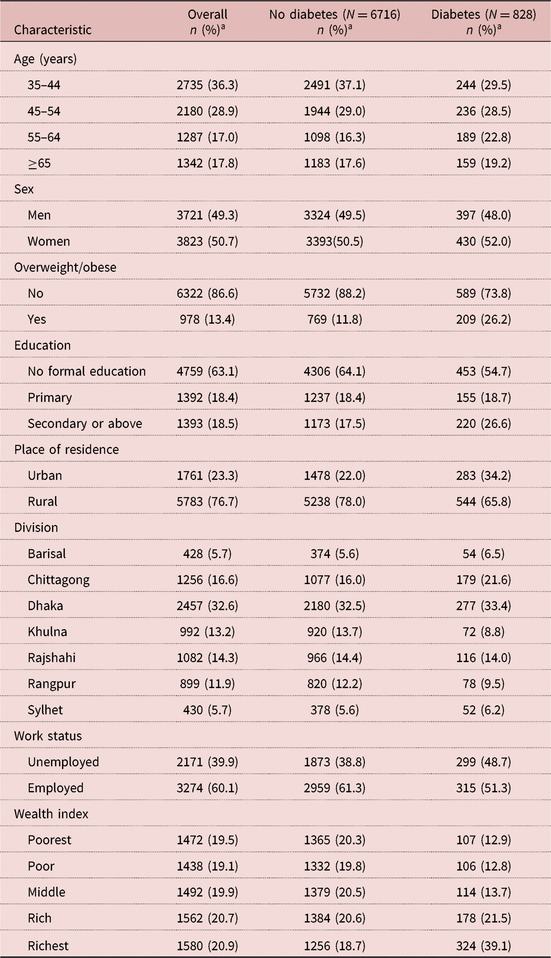
Among the 7544 respondents aged ≥35 years, the estimated prevalence of diabetes was 11.0% (n = 828) (Table 1). There was an equal distribution of men and women with and without diabetes. More individuals with diabetes were in the 55–64 and ≥65 age groups (42.0%, n = 348) compared with individuals without diabetes (33.9%, n = 2281) and were more overweight/obese (26.2%, n = 209) than those without diabetes (11.8%, n = 769). Respondents with diabetes had received a higher level of education (26.6%, n = 220) than those without diabetes (17.5%, n = 1173). More individuals with diabetes lived in urban areas (34.2%, n = 283) than individuals without diabetes (22.0%, n = 1478). The distribution of people with and without diabetes was similar among the different regions, with the exception of Chittagong and Khulna. There were more individuals with diabetes who lived in Chittagong (diabetes: 21.6% [n = 179] vs no diabetes: 16.0% [n = 1077]) and more individuals without diabetes who lived in Khulna (no diabetes: 13.7% [n = 920] vs diabetes: 8.7% [n = 72]).
Characteristics of survey respondents (N = 7544), Bangladesh 2011

a Column percentages.
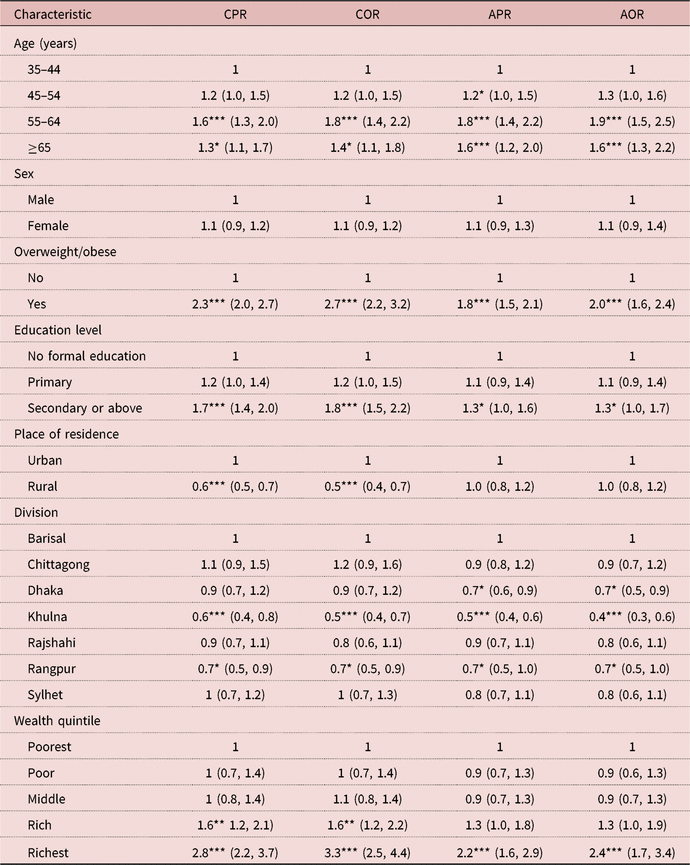
Table 2 shows the crude and adjusted estimates for the OR and PR for each background characteristic. After adjusting for the other characteristics, all factors maintained significance except for rural place of residence, Rangpur division and the rich wealth quintile. Respondents in the age group 55–64 years were more likely to have diabetes than those in the age group 35–44 years (adjusted PR [APR]: 1.8, 95% CI: 1.4, 2.2; adjusted OR [AOR]: 1.9, 95% CI: 1.5, 2.5). Not surprisingly, individuals were more likely to have diabetes if they were overweight/obese (APR: 1.8, 95% CI: 1.5, 2.1; AOR: 2.0, 95% CI: 1.6, 2.4) compared with individuals who were not overweight/obese. Likewise, respondents who had at least a secondary-level education (APR: 1.3, 95% CI: 1.0, 1.6; AOR: 1.3, 95% CI: 1.0, 1.7) and those in the richest wealth quintile (APR: 2.2, 95% CI: 1.6, 2.9; AOR: 2.4, 95% CI: 1.7, 3.4) were also more likely to have diabetes than those with no education and in the poorest wealth quintile, respectively. In contrast, those living in Khulna (APR: 0.5, 95% CI: 0.4, 0.6; AOR: 0.4, 95% CI: 0.3, 0.6) were less likely to have diabetes compared with those living in Barisal. In the crude analysis, respondents living in rural areas were less likely to have diabetes than those living in urban areas, but the association was attenuated after adjusting for other variables. There was no difference in the odds or prevalence of diabetes by sex.
Crude and adjusted PR and OR (95% CI) estimates by respondent background characteristics (N = 7544)

CPR: crude prevalence ratio; COR: crude odds ratio; APR: adjusted prevalence ratio; AOR: adjusted odds ratio; CI: confidence interval.
*p < 0.05; **p < 0.01; ***p < 0.0001.
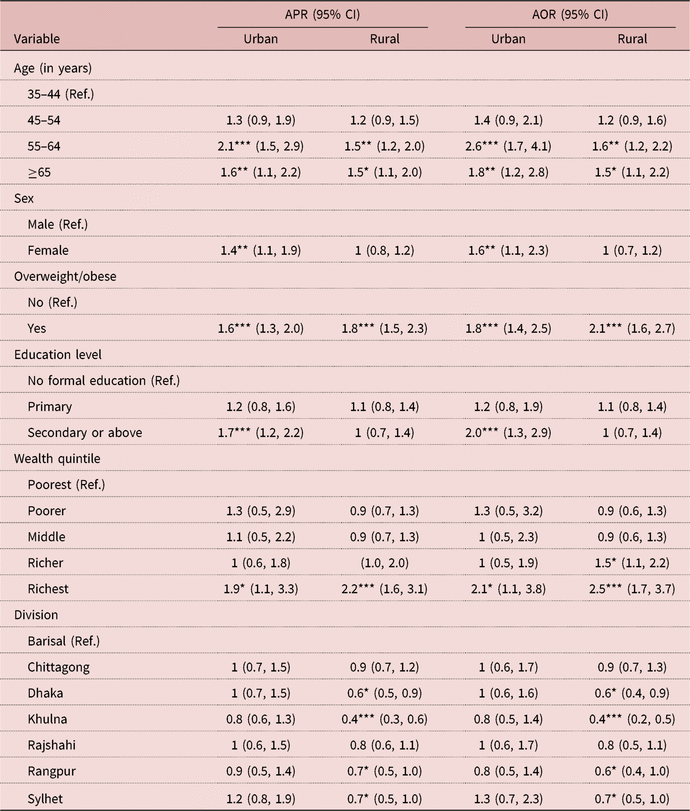
The stratification of the different determinants by rural or urban residence is shown in Table 3. The analysis revealed that individuals living in urban regions were more likely to have diabetes if they were older, female or had at least a secondary education level compared with those living in rural regions. Specifically, among those living in urban regions, the age groups 55–64 years (APR: 2.1, 95% CI: 1.5, 2.9; AOR: 1.6, 95% CI: 1.1, 2.3) and ≥65 years (APR: 1.6, 95% CI: 1.1, 2.2; AOR: 1.8, 95% CI: 1.2, 2.8) were more likely to have diabetes than the age group 35–44 years. Likewise, females (APR: 1.4, 95% CI: 1.1, 2.2; AOR: 1.6, 95% CI: 1.1, 2.3) and those with at least a secondary level of education (APR: 1.7, 95% CI: 1.2, 2.2; AOR: 2.0, 95% CI: 1.3, 2.9) were more likely to have diabetes than males, and respondents with no formal education, respectively. By contrast, compared with respondents living in urban areas, overweight/obese individuals (APR: 1.8, 95% CI: 1.5, 2.3; AOR: 2.1, 95% CI: 1.6, 2.7) and those in the richest quintile (APR: 2.2, 95% CI: 1.6, 3.1; AOR: 2.5, 95% CI: 1.7, 3.7) living in rural regions were more likely to have diabetes than non-overweight/obese individuals and those in the poorest wealth quintile, respectively. Furthermore, individuals living in the rural regions of Bangladesh’s seven divisions were less likely to have diabetes than those living in the urban regions. Specifically, Dhaka (APR: 0.6, 95% CI: 0.5, 0.9; AOR: 0.6, 95% CI: 0.4, 0.9), Khulna (APR: 0.4, 95% CI: 0.3, 0.6; AOR: 0.4, 95% CI: 0.2, 0.5), Rangpur (APR: 0.7, 95% CI: 0.5, 1.0; AOR: 0.6, 95% CI: 0.4, 1.0) and Sylhet (APR: 0.7, 95% CI: 0.5, 1.0; AOR: 0.7, 95% CI: 0.5, 1.0) were less likely to have diabetes than those living in the rural regions of Barisal.
Stratification of adjusted PR and OR by background characteristics and rural/urban place of residence

CPR: crude prevalence ratio; COR: crude odds ratio; APR: adjusted prevalence ratio; AOR: adjusted odds ratio; CI: confidence interval.
*p < 0.05; **p < 0.01; ***p < 0.0001.
Discussion
This analysis revealed that the following factors have a positive association with diabetes in Bangladesh: age, overweight/obesity and increased education and wealth quintiles. On the other hand, those living in the Khulna division had a decreased prevalence/odds of having diabetes. All factors that were significant using the PR as the measure of association were also statistically significant using the OR. Though the PR and OR provided estimates that were similar in magnitude, the OR overestimated the association for many characteristics, as has been seen in previous studies (Zocchetti et al., Reference Zocchetti, Consonni and Bertazzi1997; Tamhane et al., Reference Tamhane, Westfall, Burkholder and Cutter2016). These results are consistent with those of other studies that have investigated the socioeconomic factors associated with diabetes in Bangladesh (Akter et al., Reference Akter, Rahman, Abe and Sultana2014b; Khan et al., Reference Khan, Gruebner and Kraemer2014; Harshfield et al., Reference Harshfield, Chowdhury, Harhay, Bergquist and Harhay2015; Chowdhury et al., Reference Chowdhury, Uddin, Khan and Haque2015; Siddique et al., Reference Siddique, Islam, Banik and Rawal2017). Furthermore, this study revealed that individuals living in urban regions who were at least 55 years of age, females or those with at least a secondary level of education were more likely to have diabetes than individuals living in rural regions with the same characteristics. However, those living in rural regions who were overweight/obese or in the richest quintile were more likely to have diabetes compared with those living in urban areas with the same characteristics.
The incidence of diabetes increases as a person ages but appears to level off after 65 years of age (Kirkman et al., Reference Kirkman, Briscoe, Clark, Florez, Haas and Halter2012). Therefore, the prevalence of the disease could result from individuals who have new-onset diabetes after age 65, or individuals who were diagnosed during middle-age and have maintained diabetes status (Kirkman et al., Reference Kirkman, Briscoe, Clark, Florez, Haas and Halter2012). This is consistent with the findings of this study, as the prevalence rate or odds of diabetes increased with each increase in age group, but decreased slightly for those in the age group ≥65 years. As the age distribution continues to shift due to demographic transition and as more individuals live longer in Bangladesh (International Diabetes Federation, 2017), the prevalence of diabetes may rise among this age group. Although females had a marginally higher prevalence, sex had no association with diabetes, as has been seen in previous studies (Akter et al., Reference Akter, Rahman, Abe and Sultana2014a, b; Chowdhury et al., Reference Chowdhury, Uddin, Khan and Haque2015).
There are several modifiable risk factors that influence the development of diabetes, but among the most prominent are adopting a modern lifestyle and living in an urban area (International Diabetes Federation, 2017). Individuals living in urban areas tend to be wealthier and more educated than those in rural areas (Rahman et al., Reference Rahman, Zaman, Islam, Chowdhury, Ahsan and Rahman2018), and due to higher purchase ability, these people supposedly have more disposable income and have more access to processed and packaged foods. Participating in unhealthy lifestyle behaviours, such a not performing enough physical activity, engaging in extended sedentary periods and consuming diets high in calories, saturated fats and added sugars, is linked to overweight and obesity, which can subsequently increase the chance of insulin resistance and diabetes (Akter et al., Reference Akter, Nessa, Sarker and Yesmin2017; International Diabetes Federation, 2017). The findings of this study provide evidence of this relationship, as the survey respondents in the study were more likely to have diabetes if they were also overweight/obese or belonged to the richest wealth quintile. Similar to diabetes, obesity studies of Bangladeshi adults have found that the prevalences of overweight and obesity were greatest in those with higher levels of education and wealth, and those living in urban areas (Biswas et al., Reference Biswas, Garnett, Pervin and Rawal2017a, b; Zahangir et al., Reference Zahangir, Hasan, Richardson and Tabassum2017). Increases in diabetes prevalence for individuals in urban residences may be best analysed through differences in wealth, lifestyle and nutritional patterns. People living in rural areas are more likely to have agricultural or manual labour-intensive occupations that require significant amounts of physical activity, and prevent them from having long bouts of sedentary behaviour (Khan et al., Reference Khan, Gruebner and Kraemer2014). In contrast, wealthier people residing in urban settings have been shown to have more sedentary occupations, and studies show these individuals have moved towards embracing unhealthy diets that can increase body mass (Khan et al., Reference Khan, Gruebner and Kraemer2014; International Diabetes Federation, 2017). Also, due to the greater population, crime and traffic, urban settings may not be a favourable environment in which to maintain physical activity (Saquib et al., Reference Saquib, Khanam, Saquib, Anand, Chertow and Barry2013).
Variations in the association between the seven divisions of Bangladesh and diabetes prevalence are not well-understood based on current knowledge. However, differences may be related to the geographic make-up of these regions. The results of the present study indicate that people living in Khulna are less likely to have diabetes when compared with Barisal. These findings are supported by a similar study by Chowdhury et al. (Reference Chowdhury, Uddin, Khan and Haque2015). Although the authors used a different reference division (Sylhet), they maintained a comparable OR of 0.54 (95% CI: 0.36, 0.80) for the Khulna division (Chowdhury et al., Reference Chowdhury, Uddin, Khan and Haque2015). Perhaps Khulna is made up of different socio-demographic groups, which may contribute to the lower diabetes prevalence. Moreover, differences in lifestyle and dietary habits between regions of Bangladesh could be responsible for this difference (NIPORT et al., 2013). As this is simply speculation and the direct reasons are unknown, this is an important issue for future research.
The findings of this study could be used to influence policy decisions surrounding the prevention and maintenance of diabetes in Bangladesh. For instance, expanding access to diabetes care, increasing the accessibility of physical activity resources in communities and work-places and regulating the information printed on food labels could potentially impact the prevalence of diabetes in this country (Bergman et al., Reference Bergman, Buysschaert, Schwarz, Albright, Narayan and Yach2012; Ackermann, Reference Ackermann2017).
The present study has multiple strengths. The secondary analysis used data gathered from both urban and rural regions, as well as from each of the seven divisions of Bangladesh, making this a nationally representative survey to the target population. As such, the results are generalizable to the adult population in this country. The large sample size also aided in finding detectable differences within each of the background characteristics. Although not those most commonly used, the techniques and instruments applied to measure blood glucose have been validated for use in resource-limited settings (NIPORT et al., 2013).
However, some caution should be used when interpreting these findings. The BDHS 2011 collected fasting blood glucose measurements, which were used to categorize patients as having diabetes or not; this means that those with diabetes in this study do not represent a confirmed medical diagnosis of the disease. Likewise, due to the cross-sectional design of the study, fasting blood glucose was collected at one point in time. In clinical settings, individuals’ fasting blood glucose would be tracked over time, and only with this information and patient-specific clinical factors would a clinician diagnose an individual with diabetes (NIPORT et al., 2013). Moreover, due to the sampling design, differentiating between type 1 and type 2 diabetes was not possible. Also, since some background characteristics, like age, were based on self-report, there is the chance of misclassification of the exposure, which could bias estimates towards the null. Lastly, although measurements were performed by trained research staff, the possibility of human error exists. Any error in blood glucose measurement could result in misclassification of disease and drive the estimates closer to, or further from, the null. The BDHS 2011 only included people 35 years or older, which could under- or overestimate the overall results.
In conclusion, the study findings show that even with using the PR as a conservative approach to estimate the association between socioeconomic factors and diabetes, there are still several significant predictors of the disease among Bangladeshi adults. Results from this analysis can be used to ensure screening is increased for high-risk groups. The results can also be used to inform more-tailored and focused interventions for decreasing the risk of diabetes in these populations, such as programmes that teach individuals how to lower their calorie intake and increase their physical activity. These findings can also be used to improve education and increase awareness of modifiable risk factors so that individuals can better manage their diabetes and ultimately prevent diabetes complications. Further research is needed to assess the relationship between diabetes and other modifiable risk factors, such as physical inactivity, sedentary lifestyles and types and quantities of foods consumed.
Acknowledgments
The authors thank all survey respondents for their invaluable contributions, as well as ICF International, MD, USA, for giving permission to use the data for this study. Upon request, data may be available from ICF International, MD, USA.
Funding
This research received no specific grant from any funding agency, commercial entity or not-for-profit organization.
Conflicts of Interest
The authors declare no conflicts of interest to declare.
Ethical Approval
The authors assert that all procedures contributing to this work comply with the ethical standards of the relevant national and institutional committees on human experimentation and with the Helsinki Declaration of 1975, as revised in 2008.