Implications
The cell cycle is necessary for preadipocyte proliferation, whereas adipocyte differentiation requires its inhibition. In this study, three cell cycle inhibitors were found to be low in preadipocytes and increasingly expressed during adipogenic differentiation and adipose tissue development, serving as potential indicators for rates of proliferation and adipocyte differentiation. Moreover, modulation of their expression or activities of their encoding proteins during adipose growth and development may provide a prospective method for controlling fat deposition in animals and humans by reducing the fat cell number and size. Finally, this study provides an efficient research strategy combining an online database with experimental data.
Introduction
As the most flexible tissue in size and weight, adipose tissue can range from 2% to 3% of BW in the fittest athletes to 60% to 70% of BW in extremely obese individuals (Hausman et al., Reference Hausman, DiGirolamo, Bartness, Hausman and Martin2001). Growth of adipose tissue is achieved through increases of cell size (hypertrophy) and/or cell number (hyperplasia). Although it seems that hyperplasia only occurs at early developmental stages in non-obese animals, it was also found to be triggered in the adult obese animals when the cell size and lipid content reached a certain level (Faust et al., Reference Faust, Johnson, Stern and Hirsch1978; Guo et al., Reference Guo, Sun, Shang, Leng, Wang, Wang and Li2011). The different patterns of adipose development are closely related to timely cell cycle inhibition, because proliferation of preadipocytes and immature adipocytes, which is dependent on cell cycle activity, precedes differentiation of preadipocytes into mature fat cells (FCs), which is characterized by cell cycle withdrawal (Ntambi and Kim, Reference Ntambi and Kim2000), whereas promotion of cell proliferation can inhibit adipogenesis (Hou et al., Reference Hou, Feng, Wang and Yang2013).
Therefore, we postulated a hypothesis that there may be important cell cycle inhibitors that inhibit cell proliferation in the early stage of development of adipose tissue, but allow FC differentiation in the later stage through cell cycle inhibition. Therefore, they should be highly expressed in mature FCs and well-differentiated adipose tissue and increasingly expressed during adipose development. If such cell cycle inhibitors can be found, they may become potential markers for selection of reduced fat tissue in the animal industry. Meanwhile, since increase of FC number is one of the contributors to severe obesity (Hirsch and Knittle, Reference Hirsch and Knittle1970; Faust et al., Reference Faust, Johnson, Stern and Hirsch1978), increased expression of these cell cycle inhibitors in the early stage of adipose development and decreased expression in the later stage may provide avenues for curing severe obesity.
Although some cell cycle inhibitors such as retinoblastoma protein (Chen et al., Reference Chen, Riley, Chen and Lee1996; Richon et al., Reference Richon, Lyle and McGehee1997) have been well studied for their function coupling cell cycle inhibition and adipocyte differentiation, the functions of most other cell cycle inhibitors in adipogenesis are still unclear. In addition, to the best of our knowledge, there have been no comprehensive studies of cell cycle inhibitors in adipose development. Fortunately, the availability of hundreds of microarray data in the Gene Expression Omnibus (GEO) database on the NCBI website makes it feasible to initiate a comprehensive study of cell cycle inhibitors by comparing gene expression in various physiological, developmental or nutritional conditions.
In this study, three important cell cycle inhibitors – cyclin G2 (CCNG2), cyclin-dependent kinase inhibitor 2C (CDKN2C) and peripheral myelin protein 22 (PMP22) – were found to be expressed to a greater extent in adipose tissue by analyzing microarray data from two GEO DataSets, GDS596 and GDS3142, which compare gene expression in various tissues of humans and mice. As an unconventional cyclin, CCNG2, has been demonstrated to not only inhibit cell proliferation by blocking transition from G1 to S phase in the cell cycle, but also promotes transcriptional activity of PPARγ by forming a transcriptional complex (Aguilar et al., Reference Aguilar, Annicotte, Escote, Vendrell, Langin and Fajas2010). CDKN2C, which is also called p18INK4C, is also well-known as a key inhibitor of the cell cycle and can block cell cycle G1 progression by preventing activation of cyclin-dependent kinase 4 or 6 (CDK4/6) (Hirai et al., Reference Hirai, Roussel, Kato, Ashmun and Sherr1995). CDKN2C has been identified as a protein that is indirectly regulated by PPARγ in the differentiation-dependent cascade (Morrison and Farmer, Reference Morrison and Farmer1999). Therefore, CCNG2 and CDKN2C are both important regulators coupling cell cycle arrest and adipogenic differentiation. PMP22 is involved in G0 growth arrest as a homologue of the murine growth arrest-specific 3 (gas3) (Manfioletti et al., Reference Manfioletti, Ruaro, Del-Sal, Philipson and Schneider1990; Welcher et al., Reference Welcher, Suter, De-Leon, Snipes and Shooter1991) and has been demonstrated to negatively regulate DNA synthesis and retard the transition from G0/G1 to the S+G2/M phases in Schwann cells (Zoidl et al., Reference Zoidl, Blass-Kampmann, D’Urso, Schmalenbach and Müller1995). In addition, gas3/PMP22 is upregulated in human neonatal fibroblasts arrested by serum starvation or confluence, but is downregulated when these cells re-enter the cell cycle (Karlsson et al., Reference Karlsson, Afrakhte, Westermark and Paulsson1999), indicating that it is important for maintaining a growth arrest state.
Although there are some reports regarding the three genes in the in vitro preadipocyte cell culture, there are no reports about the in vivo expression patterns of these three genes during adipose development. In this study, the expression of the three genes in adipose tissue was investigated by combining GEO DataSets for the human and mouse with qPCR and Western blotting results for the pig. The spatial expression was studied for distribution in different tissues and comparison between stromal vascular (SV) cells and FCs. Meanwhile, the temporal expression was examined during in vitro culture of porcine primary preadipocytes and in vivo development of porcine subcutaneous adipose tissue.
Material and methods
Data sources and processing
The microarray expression profiles for six tissues (heart, liver, lung, muscle, kidney and adipose) were derived from two GEO DataSets (GDSs) available on the NCBI website: GDS596 for adult human (more than 20 years old) and GDS3142 for adult mouse (10 to 12 weeks old). The microarray in GDS596 contains 22 215 spots other than the housekeeping spots, whereas the microarray in GDS3142 contains 45 037 spots other than the housekeeping spots. There are two samples for each tissue in GDS596 and three to four samples for each tissue in GDS3142.
First, all of the genes in the two microarray datasets were ranked in descending order based on the ratio between mean expression value of each gene in adipose tissue and mean expression value of that gene in the other five tissues as previously described (Song et al., Reference Song, Ahn, Suh, Davis and Lee2013). The 108-cell cycle regulatory genes published by Cell Cycle RT2 Profiler TM PCR array by the Qiagen company (http://www.sabiosciences.com/rt_pcr_product/HTML/PAHS-020Z.html) and 21 other important cell cycle regulators mentioned in a published paper (Schafer, Reference Schafer1998) were then selected and analyzed in the two datasets. Finally, three inhibitors – CCNG2, CDKN2C and PMP22, were selected as they are directly involved in the cell cycle and showed high ranks in both datasets.
The expression levels of the three inhibitors were then further compared among different differentiation stages of preadipocytes by analyzing GDS2743 and GDS2366. GDS2743 compares the gene expression between primary white preadipocytes from epididymal white adipose tissue of mice cultured for 4 and 7 days, which corresponds to the undifferentiated stage and differentiating stage (n=8 for undifferentiated preadipocytes and n=6 for differentiating preadipocytes) of adipocytes. GDS2366 compares the gene expression between undifferentiated and differentiated preadipocytes from subcutaneous adipose tissues in humans (n=3 for each of the two groups). In addition, GDS2659, which records gene expression at several time points (preconfluence, confluence and 1, 3, 7 and 28 days after addition of differentiation cocktail) during differentiation of 3T3-L1 preadipocytes, was also used to analyze gene expression of the three inhibitors during differentiation of adipocytes in vitro.
Experimental animals
All animal care and use procedures were approved by the Institutional Animal Care and Use Committee (IACUC) at The Ohio State University. Pigs were reared at the Ohio Agricultural Research and Development Center (OARDC) Western Agricultural Research Station in South Charleston, OH. Neonatal pigs were nursed by sows. Market-age pigs were fed with three different diets during the three phases of their growth. When the pigs weighed 32 to 64 kg, the diet contained 18% CP and 0.95% lysine with metabolizable energy (ME) of 3234 kcal/kg. When the pigs weighed 64 to 91 kg, the diet contained 16.3% CP and 0.78% lysine with 3243 kcal ME/kg. When the pigs weighed more than 91 kg, the diet contained 14.3% CP and 0.68% lysine with 3247 kcal ME/kg. Rearing of the pigs used to detect the tissue distribution of gene expression was the same as that for the pigs used to detect gene expression during adipose tissue development (Crawford et al., Reference Crawford, Moeller, Zerby, Irvin, Kuber, Velleman and Leeds2010).
To detect the tissue distribution of the three inhibitors – CCNG2, CDKN2C and PMP22 – in pigs, adipose tissue, muscle, heart, lung, liver, kidney, spleen and intestine were collected from four Landrace pigs at 120 days of age. In addition, for Western blot analysis of tissue distribution of CCNG2, the same tissues except intestine were also collected from one Duroc pig at 200 days of age. To detect expression of the three genes during development of adipose tissue in vivo, subcutaneous adipose tissues were collected from the middle of the back of 105-day fetal pigs, 6-day post-natal pigs and 120-day market-age Landrace pigs with three individuals in each group. All of the collected samples were kept at −80°C after being snap frozen in dry ice for total RNA isolation and qPCR (Deiuliis et al., 2008; Ahn et al., Reference Ahn, Oh, Suh, Moeller and Lee2013).
Separation of SV and FC fraction
To compare gene expression between the SV and FC fractions, the two fractions were separated from three 5 g subcutaneous adipose tissues that were collected from each of the three 120-day market-age Landrace pigs mentioned above. The subcutaneous adipose tissues were first minced using razor blades before incubation with 3.2 mg/ml of collagenase II (Sigma-Aldrich, St. Louis, MO, USA) at 37°C. After incubation for 1 h in a shaking water bath, the suspension was passed through a 100 µm nylon cell strainer to remove the large pieces. Finally, the floating FC fraction was separated from the SV fraction in the pellet after centrifugation of the filtrate at 500×g for 5 min (Deiuliis et al., Reference Deiuliis, Li, Lyvers-Peffer, Moeller and Lee2006).
In vitro culture of SV cells
After the SV fraction, which consists mostly of preadipocytes, was isolated, the cells were diluted in DMEM culture medium containing 10% fetal bovine serum (Invitrogen Inc., Grand Island, NY, USA) and a mixture of penicillin and streptomycin (Invitrogen). The diluted cells were then maintained and grown to confluence (day 0) at 37°C in 5% CO2. After induction of differentiation by dexamethasone (80 nM) for 3 days post confluence, the differentiation mixture containing 0.5 mM of isobutylmethylxanthine, 5 µg/ml of transferrin and 5 µg/ml of insulin was added for a 6-day culture to promote differentiation into adipocytes. The cells were collected on day 0, 3, 6 and 9 after induction of differentiation for extraction of total RNA samples, which were stored at −80°C for subsequent RT-PCR.
cDNA synthesis and qPCR
The total RNA samples from different tissues and cell cultures were isolated using Trizol reagent (Invitrogen) according to the manufacturer’s instructions and the quality was assessed by electrophoresis on 1% gels. Then the cDNA was synthesized using 1 μg of total RNA, oligo dT and moloney murine leukemia virus (M-MLV) reverse transcriptase (Invitrogen) according to the manufacturer’s instructions. The synthesized cDNA was then used for qPCR to measure expression of CCNG2 (forward 5′-CAGCTGAAAGCTTGCAACTGC-3′ and reverse 5′-TGAAAATAGGCCAGATCTGATCTGA-3′), CDKN2C (forward 5′-GGGACCTAGAGCAACTTACTAGTTTGT-3′ and reverse 5′-GTGTCCAGGAAACCTGCTCTG-3′) and PMP22 (forward 5′-CTCCACGATCGTCAGCCAAT-3′ and reverse 5′-GTGAAGAGCTGGCAGAAGAACAG-3′) with primers shown in the parentheses. qPCR was performed using AmpliTaq Gold polymerase (Applied Biosystems, Grand Island, NY, USA), SYBR green I as a detection dye and cyclophilin (cyc) as an internal control with cycling parameters as follows: 95°C for 10 min, followed by 40 cycles of 94°C for 30 s, 60°C for 1 min, and 82°C for 30 s. The relative gene expression was then calculated as the ratio of target gene to cyc expression. In addition, in order to verify separation of the SV and FC fractions, differentiation of preadipocytes in vitro and development of adipose tissue in vivo, the expression of one preadipocyte marker, delta-like 1 homolog (DLK1), and one adipocyte marker, peroxisome proliferator-activated receptor γ (PPARγ), was also measured by qPCR. The sequences of primers for cyc, DLK1 and PPARγ in qPCR were described in previous reports (Li et al., Reference Li, Zerby and Lee2007).
Protein isolation and western blot analysis
In order to detect protein expression among different tissues and different time points during adipose development, protein was isolated from different tissues of one 120-day Landrace pig and one 200-day Duroc pig, as well as adipose tissues of two individuals at each developmental stage. Due to lack of available peptide sequence and antibody, only expression of CCNG2 was detected. Western blot analysis was carried out following the procedure described in our previous report (Li et al., Reference Li, Suh, Kim, Moeller and Lee2012). Protein was extracted from ~100 mg of tissue after homogenization in 1 ml of lysis buffer followed by centrifugation at 12 000 r.p.m. for 5 min at 4°C. Coomassie stain was used to determine an equal amount of protein loaded for each sample before Western blotting. For Western blotting, the proteins in each sample were transferred to polyvinylidene fluoride membrane (GE Healthcare, Piscataway, NJ, USA) after separation in SDS-PAGE by the mini-Protein system (Bio-Rad, Hercules, CA, USA). The membrane was then blocked for 30 min in 4% non-fat dry milk in 1× tris-buffered saline Tween-20 (TBST; 0.1% Tween 20) and incubated overnight at 4°C with a primary antibody raised against the region 170-210aa of human CCNG2 protein (Bioss Inc., Woburn, MA, USA) in 4% non-fat dry milk. After being washed with 1×TBST for 4 min each time for seven times, the membrane was incubated with a horseradish peroxidase-conjugated secondary antibody (Cell Signalling Technology Inc., Danvers, MA, USA) in 4% nonfat dry milk for 1 h at room temperature, and then washed again with 1×TBST for 4 min each time for seven times. Finally, bands were detected with Hyperfilm (GE Healthcare) in a dark room after the Amersham ECL Plus Western Blotting Detection Reagents were applied on the membrane. To ensure that the bands detected were the target bands (38.9 kDa), the protein isolated from muscle of a postnatal 20-day mouse was used as a positive control.
Statistical analysis
Statistical analysis for the tissue distribution of gene expression was performed using a mixed model (MIXED) procedure available in the SAS software (version 9.3, SAS Institute Inc., Cary, NC, USA). The DIFF option was used to detect significant differences between pairs of least squares means. Comparison of gene expression between two groups was conducted in SAS using Student’s t-test. Multiple comparisons among the different time points during in vitro differentiation and in vivo development were carried out using one-way ANOVA followed by Fisher’s post hoc test. P-values lower than 0.05 were treated as significant. All of the results are presented as least squares means plus or minus standard errors of the least squares means (s.e.m.).
Results
Data analysis based on the GEO DataSets
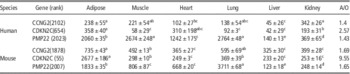
A total of 22 215 genes in the GDS596 (human) and 45 037 genes in the GDS3142 (mouse) datasets were ranked in descending order based on the ratio between average expression in adipose tissue and average expression in the other five tissues. By comparing high-ranking cell cycle regulators across the human and mouse, three cell cycle inhibitors were selected that had a relatively high expression in the adipose tissue of both the human and mouse (Table 1). The ranks of CCNG2, CDKN2C and PMP22, respectively, were 2102, 654 and 2023 in GDS596 and 1878, 55 and 2007 in GDS3142. Although expression of the three genes was not necessarily highest in adipose tissue, the three genes generally had high expression in lung or adipose tissue and the lowest expression in liver.
The cell cycle regulator expressed higher in adipose in both human and mouse

A/O=ratio between average expression in adipose tissue and that in the other tissues; PMP22=peripheral myelin protein 22; CDKN2C=cyclin-dependent kinase inhibitor 2C; CCNG2=cyclin G2.
a-eDifferent superscript indicate significant difference (P<0.05).
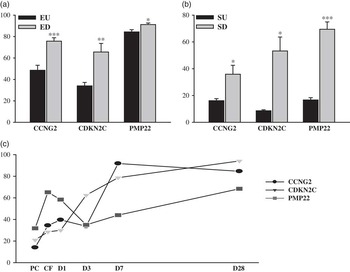
In the cell culture of preadipocytes from mouse epididymal adipose tissue in GDS2743, all three cell cycle inhibitors showed significantly greater expression in differentiating preadipocytes (7 days in cell culture) than in undifferentiated preadipocytes (4 days in cell culture) (Figure 1a). In addition, the differentiated preadipocytes in human subcutaneous adipose tissues in GDS2366 also exhibited greater expression of the three cell cycle inhibitors compared with undifferentiated preadipocytes (Figure 1b). The high expression of these genes in differentiated preadipocytes was further confirmed by the 28-day timeline records of gene expression during differentiation of 3T3-L1 preadipocytes in GDS2659, because the three inhibitors were generally expressed to a greater degree at the end of differentiation than at the initiation of differentiation (Figure 1c). However, there was also a transient fluctuation in expression for PMP22 and CCNG2 from preconfluence to 3 days after differentiation before another strong increase, which may have been caused by the addition of differentiation cocktail.
Gene expression analysis of PMP22, CDKN2C and CCNG2 based on microarray datasets obtained from NCBI website. (a) Expression comparison of the three genes between undifferentiated (epididymal undifferentiated; EU, cultured for 4 days, n=8) and differentiating (epididymal differentiating; ED, cultrued for 7 days, n=6) preadipocytes from mouse epididymal adipose tissue based on GDS2743. (b) Expression comparison of the three genes between undifferentiated (subcutaneous undifferentiated; SU, n=3) and differentiated (subcutaneous differentiated; SD, n=3) preadipocytes isolated from subcutaneous adipose tissue of human based on GDS2366. (c) Expression of the three genes at various time points during differentiation of 3T3-L1 preadipocytes in GDS2659. In the histograms, each bar reprents mean±s.e.m. and statistical significance of Student’s t-test is indicated by *P<0.05, **P<0.01 and ***P<0.001.

Expression of the three selected genes in various tissues of pigs
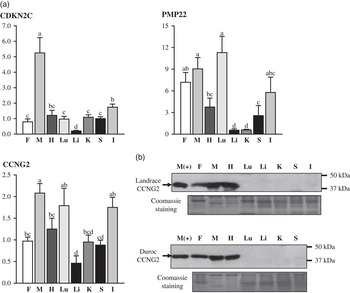
mRNA expression of the three cell cycle inhibitors in the Landrace pigs showed a slightly different pattern from that in human (GDS596) and mouse (GDS3142). None of the three genes showed the highest expression in adipose tissue. For PMP22, the highest expression occurred in the lung, but without significant differences from muscle and adipose tissue. For CCNG2 and CDKN2C, the highest expression was observed in muscle with the expression in adipose tissue close to the mean value of eight tissues. This result was especially obvious for CDKN2C, where expression in muscle was high with the expression in other tissues significantly low. Therefore, expression of CDKN2C seemed to be muscle-specific. Although the three genes showed different distributions of expression among the eight tissues, they exhibited consistency in that lowest expression occurred in the liver (Figure 2a). However, the protein expression of CCNG2 in different tissues showed some discrepancy from the mRNA expression. According to Western blot analysis, although the CCNG2 protein was also the most abundant in muscle, it was only detected in fat, muscle and heart in both Landrace and Duroc (Figure 2b).
Expressions of CCNG2, CDKN2C and PMP22 in fat (F), muscle (M), heart (H), lung (Lu), liver (Li), kidney (K), spleen (S) and intestine (I) of pigs. (a) mRNA expressions of the three genes were measured by quantitative real-time PCR with porcine cyclophilin (cyc) as a control for normalization. Bars represent means±s.e.m. A mixed model was used with DIFF option to compare expressions in different tissues (n=4 for each tissue). Tissues with different letters above the bars are significantly different (P<0.05). (b) CCNG2 protein levels in different tissues of one 120-day Landrace pig and one 200-day Duroc pig. Protein from muscle of 20-day postnatal mouse (M+) was used as a positive control.

Expression of the selected genes in SV and FC fractions in pigs
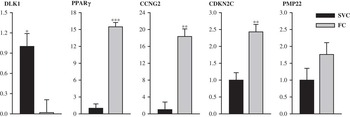
In qPCR with pig subcutaneous adipose tissue, all three genes showed greater expression in the FC fraction. Expression of CCNG2 and CDKN2C was more than 18 and 2 times greater, respectively, in the FC fraction than in the SV fraction (P<0.01), whereas PMP22 was expressed less than two times as much, and, therefore, was expressed non-significantly more in the FC fraction than in the SV fraction (Figure 3). Meanwhile, expression of the preadipocyte marker DLK1 was nearly 50-fold greater in the SV fraction than in the FC fraction (P<0.05), whereas expression of the adipocyte marker PPARγ was more than 15 times greater in the FC fraction than in the SV fraction (P<0.001) (Figure 3), indicating that isolation of the two fractions was successful.
Relative gene expressions of DLK1, PPARγ, CCNG2, CDKN2C and PMP22 in the stromal vascular (SV) and fat cell (FC) fractions (n=3 for each group) from pig adipose tissue. The bars represent means±s.e.m. Statistical significance is indicated by *P<0.05 and ***P<0.001. The expression values are normalized by porcine cyclophilin (cyc) gene.

Expression of the selected genes during adipogenic differentiation
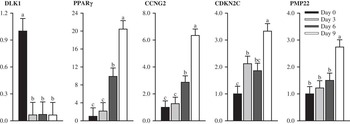
During the 9-day in vitro differentiation of preadipocytes in the SV fraction isolated from porcine subcutaneous adipose tissue, the expression of CCNG2 showed a continuous and significant increase from 3 to 9 day after induction of differentiation with expression doubling every three days (P<0.05). For CDKN2C, there were two significant increases in expression (P<0.05). The first increase occurred from day 0 to day 3, while the second one occurred from day 6 to day 9. For PMP22, although the increased expression also seemed continuous, it was only significant from day 6 to day 9 (P<0.05) with an increment of 83% (Figure 4). Meanwhile, DLK1 expression decreased 94.5% from day 0 to day 3 (P<0.05) and remained at a very low level from 3 days after induction of differentiation onward. In contrast, expression of PPARγ was low at day 0 and 3, but increased more than four times and two times, respectively, by day 6 and 9 (P<0.05) (Figure 4), indicating successful differentiation of preadipocytes into adipocytes.
Expressions of DLK1, PPARγ, CCNG2, CDKN2C and PMP22 during pig primary adipocytes differentiation in vitro. Gene expressions were detected at initiation of differentiation (day 0) and after differentiation (day 3, 6 and 9) and normalized by porcine cyc gene. ANOVA followed by Fisher’s post hoc test was performed to examine the differences of gene expressions among the four time points (n=3 for each time point) which are indicated by different letters (a–c) if significant (P<0.05).

Expression of the selected genes during adipose development
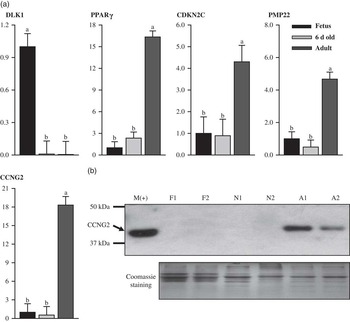
As the three cell cycle inhibitors all increased during adipogenic differentiation, all of them also increased significantly during adipose development in vivo from 6 days to 120 days after birth (P<0.05). The mRNA expression of CCNG2, CDKN2C and PMP22 increased more than 33, 4 and 9 times, respectively, during this period, coincident with a seven-fold increase of PPARγ, which is contrary to the 100-fold decrease of DLK1 from the fetal stage to the neonatal stage (P<0.05) (Figure 5). However, all three genes maintained a low level of expression in 105-day fetuses and 6-day old piglets, as in the case of PPARγ. This trend differed from that of DLK1, which was highly expressed in 105-day fetuses (Figure 5a). Western blot analysis of CCNG2 also showed results consistent with those of qPCR, since the protein expression at different time points of development showed the same trend as the mRNA expression (Figure 5b). In 105-day fetuses and 6-day old piglets, there was only a small amount of mRNA without detectable protein, whereas in the 120-day pigs, there was abundant mRNA and protein expression.
Gene expression in subcutaneous adipose tissues of 105-day fetal (Fetus), 6-day neonatal (6-day-old) and 120-day pigs (adult). (a) mRNA expression of DLK1, PPARγ, CCNG2, CDKN2C and PMP22 during pig adipose development in vivo. Gene expressions were normalized by porcine cyc gene. ANOVA followed by Fisher’s post hoc test was performed to examine the differences in gene expressions among the three groups (n=3 for each group), which are indicated by different letters (a–b) if significant (P<0.05). (b) Protein expression of CCNG2 in subcutaneous adipose tissues of 105-day fetal (F1, F2), 6-day neonatal (N1, N2) and 120-day pigs (A1, A2). Coomassie staining results are provided to show equal amounts of proteins loaded in different wells in the same gel. Protein from muscle of 20-day postnatal mouse (M+) was used as a positive control.

Discussion
In this study, we applied a powerful strategy that combined microarray data deposited in NCBI’s GEO public database with the data from our qPCR and western blotting experiment, and, therefore, conducted more comprehensive analysis and made stronger conclusions with less time and financial cost due to experimentation. There are nearly 100 GEO DataSets on FCs and adipose tissues; therefore, we can often find useful data supporting our research conclusions by exploring these datasets. In addition, these datasets also provide free tests of our hypothesis, and, thus, guide our study in the right direction without wasting time, money and effort in the initial exploration of the hypothesis. For instance, selection of the three important cell cycle inhibitors in this study would have been difficult and costly without the five GEO DataSets, because there are so many cell cycle inhibitors.
The differentiation of preadipocytes to FCs has been acknowledged to be tightly coordinated with changes in the cell cycle, because the preadipocytes undergo cell proliferation, which is arrested in the mature FCs (Fajas et al., Reference Fajas, Fruchart and Auwerx1998). Therefore, it is reasonable to hypothesize greater expression of some important cell cycle inhibitors in mature FCs than in the adipocyte precursors. This hypothesis was proven by examination of the GDS2743 and GDS2366 datasets, because the three cell cycle inhibitors that we studied exhibited much greater expression in differentiating or differentiated preadipocytes than in undifferentiated preadipocytes in both humans and mice. This result is also supported by the higher expression of the three genes in the FC fraction compared with the SV fraction, which mainly contains preadipocytes, suggesting that the three cell cycle inhibitors may be related to cell cycle inhibition during adipogenic differentiation and in the maintenance of the quiescent state of mature FCs.
In addition, results of the 9-day porcine preadipocyte primary culture also agreed with results of the 3T3-L1 cell culture in the GDS2659 dataset in terms of the increasing expression of the three genes during differentiation. The highest level of DLK1 gene expression and the lowest level of PPARγ expression at day 0 indicated an undifferentiated preadipocyte stage, whereas the dramatic decrease in DLK1 expression after induction of differentiation, which coincided with the gradual increase in PPARγ expression, indicated that differentiation was promoted (Smas and Sul, Reference Smas and Sul1993; Deiuliis et al., Reference Deiuliis, Shin, Bae, Azain, Barb and Lee2008; Li et al., Reference Li, Shin and Lee2009). The gradual increase in expression of the three cell cycle inhibitors may therefore indicate that inhibition of the cell cycle during the differentiation process is gradual rather than immediate. This conclusion is also supported by the discovery of small proliferative adipocytes (SPA), which have tiny or no lipoid droplets, expression of adipocyte markers and limited proliferative ability, and, thus, may represent the middle stage of differentiation (Hanamoto et al., Reference Hanamoto, Kajita, Mori, Ikeda, Fujioka, Yamauchi, Okada, Usui, Takahashi, Kitada, Taguchi, Kajita, Uno, Morita and Ishizuka2013). Moreover, it seems that a significant increase of PMP22/gas3 only occurred in the later stage of differentiation, suggesting that it may be related more to the growth arrest state in the mature adipocytes than in the differentiation process. Based on the above analysis, it seems that the three cell cycle inhibitors promote the differentiation process mainly by cell cycle inhibition, even though there are some reports of positive correlations of CCNG2 (Morrison and Farmer, Reference Morrison and Farmer1999) and CDKN2C (Hirai et al., Reference Hirai, Roussel, Kato, Ashmun and Sherr1995) with PPARγ, because PPARγ also induces cell cycle withdrawal during adipocyte differentiation (Altiok et al., Reference Altiok, Xu and Spiegelman1997). Therefore, we speculate that CCNG2 and CDKN2C may form a positive feedback loop with PPARγ coupling cell cycle inhibition and the adipogenic differentiation process.
The PPARγ-dependent expression pattern of the three cell cycle inhibitors also seems to be age-dependent during in vivo development of adipose tissue, because all three genes and PPARγ exhibited much greater expression in market-age pigs than in the early age groups. For CCNG2, this is further confirmed at the protein level. In the 105-day fetal pigs, the development of adipose tissue is mainly characterized by an increase of FC number by proliferation of preadipocytes and immature FCs (Desnoyers et al., Reference Desnoyers, Pascal, Etienne and Vodovar1980). Therefore, the expression of DLK1 was high, whereas expression of the three cell cycle inhibitors and PPARγ was low. In the 6-day postnatal pigs, DLK1 and PPARγ as well as the three cell cycle regulators, had low expression levels, because this developmental stage is characterized by an increase of SPA cells, which express adipocyte markers, but still can proliferate (Anderson and Kauffman, Reference Anderson and Kauffman1973). In the 4-month old pigs, the dramatic increase in expression of the three cell cycle inhibitors and PPARγ may indicate an increasing number of mature FCs during this period, because the increase in FC size becomes dominant in the development of adipose tissue, whereas the increase in FC number gradually slows during this period (Anderson and Kauffman, Reference Anderson and Kauffman1973). However, even in this stage, cell cycle activity may not completely stop in adipose tissue, because there are still preadipocytes or SPA cells with the potential to differentiate into mature FCs. This is perhaps the reason why expression of the three genes in adipose tissue in the tissue distribution analysis for 4-month old pigs is not as high as that for adult humans (>20 years old) and mice (10 to 12 weeks old) in the GDS596 and GDS3142 datasets. The FC number seems to minimally increase after 18 years of age in humans (Knittle et al., Reference Knittle, Timmers, Ginsberg-Fellner, Brown and Katz1979) or after 3 weeks of age in mice (Johnson and Hirsch, Reference Johnson and Hirsch1972), but still increases in pigs before 7 months of age (Anderson and Kauffman, Reference Anderson and Kauffman1973).
In addition to the close relationship of these three genes in adipocyte proliferation and differentiation, the low expression of the three cell cycle regulators in the liver of the human, mouse and pig may also reflect a high potential of hepatocytes to proliferate compared with the differentiated cells in other tissues, because they can re-enter the cell cycle soon after injury to facilitate regeneration (Albrecht et al., Reference Albrecht, Poon, Ahonen, Rieland, Deng and Crary1998). Moreover, the high expression of PMP22 in the lung of the human, mouse and pig may also be important for normal function in the quiescent state of lung cells, because expression of PMP22 was reported to be down-regulated in lung tumors of mice (Re et al., Reference Re, Manenti, Borrello, Colombo, Fisher, Pierotti, Della and Dragani1992). Finally, the high mRNA expression and low protein expression of CCNG2 in lung and intestine may indicate that some post-transcriptional mechanisms are involved in the regulation of this gene and that CCNG2 may not be the major regulator of cell cycle inhibition in these tissues.
In conclusion, CCNG2, CDKN2C and PMP22 are three important genes in adipogenesis, because they may promote adipocyte differentiation through cell cycle inhibition. Hyperplasia, which requires cell cycle activity, precedes differentiation from preadipocytes into FCs. Therefore, overexpression of these cell cycle inhibitors in the early developmental stage and inhibition of their expression in the later stage of adipogenesis may limit the increase of FC number in animals and humans caused by FC proliferation or differentiation (Hirsch and Knittle, Reference Hirsch and Knittle1970; Faust et al., Reference Faust, Johnson, Stern and Hirsch1978), and, therefore, provide potential methods of reducing excessive fat tissue in dietary meat and curing obesity in humans.
In addition, since the cell cycle is activated in differentiated and dedifferentiated liposarcoma compared with normal fat tissue (Singer et al., Reference Singer, Socci, Ambrosini, Sambol, Decarolis, Wu, O’Connor, Maki, Viale, Sander, Schwartz and Antonescu2007), induction of terminal differentiation and cell cycle inhibition of liposarcoma may provide a possible therapeutic method for the treatment of liposarcoma (Tontonoz et al., Reference Tontonoz, Singer, Forman, Sarraf, Fletcher, Fletch, Brun, Mueller, Altiok, Oppenheim, Evans and Spiegelman1997). For example, CDK4 is the main target for amplification of chromosome 12 in well-differentiated or dedifferentiated liposarcomas (Louis-Brennetot et al., Reference Louis-Brennetot, Coindre, Ferreira, Perot, Terrier and Aurias2011), whereas CDKN2C is one of the main inhibitors of CDK4, and, thus, may provide a prospective remedy for this disease. However, more in-depth studies still need to be done before application of these cell cycle inhibitors in these areas.
Acknowledgments
This work was supported by state and federal funds appropriated to the Ohio Agricultural Research and Development Center SEEDS grant, The Ohio State University and a grant from the Agenda Program (No. PJ008587), Rural Development Administration, Republic of Korea.