Introduction
Fish-borne zoonotic trematodes (FZTs) are commonly reported worldwide, and more than 70 species are known to be zoonotic (World Health Organization, 2011). The life cycle of FZTs involves a primary snail host, secondary fish hosts and final hosts, such as humans, pigs or fish-eating birds (Chai et al., Reference Chai, Murrell and Lymbery2005). Humans and other final hosts can become infected when they eat raw or undercooked infected fish (Chai et al., Reference Chai, Murrell and Lymbery2005; Phan et al., Reference Phan, Ersbøll, Do and Dalsgaard2011). In addition, certain aquaculture management practices, such as using excreta from final hosts as manure in ponds, can enhance the persistence of FZTs (Thien et al., Reference Thien, Dalsgaard, Thanh, Olsen and Murrell2007; Dung et al., Reference Dung, Madsen and The2010; Lima dos Santos & Howgate, Reference Lima dos Santos and Howgate2011). Currently, the primary intervention strategy for human infections is prophylaxis (WHO, 2011). However, additional intervention methods that can be applied in aquaculture, for example reducing transmission to fish fingerlings (Boerlage et al., Reference Boerlage, Graat, Verreth and De Jong2012) by keeping fish fry in filtered water in cement tanks longer than the usual 2–7 days (Thien et al., Reference Thien, Dalsgaard, Thanh, Olsen and Murrell2007), require further research to identify the mechanisms involved in the transmission of FZTs to fish.
Transmission of FZTs to fish occurs via cercariae that emerge from snails (Lo & Lee, Reference Lo and Lee1996a; Chai et al., Reference Chai, Murrell and Lymbery2005). In general, transmission can be categorized as density-dependent or frequency-dependent (e.g. Keeling & Rohani, Reference Keeling and Rohani2008; Vynnycky & White, Reference Vynnycky and White2010). In density-dependent transmission, contacts depend on the size of a designated space (e.g. area or volume) in which contact can take place (Begon et al., Reference Begon, Bennett, Bowers, French, Hazel and Turner2002). For cercariae-to-fish transmission, the designated space is a body of water, for example a fish tank, pond or lake. In frequency-dependent transmission, contacts are independent of the size of a designated space. However, the term frequency-dependent may be misleading when comparing transmission between the two models because ‘frequency-dependent’ is always used when extrapolating between situations with the same density (Bouma et al., Reference Bouma, De Jong and Kimman1995; De Jong et al., Reference De Jong, Diekmann, Heesterbeek and Mollison1995). Therefore, in this study, we refer to ‘density-dependent’ and ‘density-independent’ transmission. Transmission of FZTs to fish in aquaculture takes place in a more-or-less closed designated area where the dimensions of the water depth and surface area of the base of the fish enclosure can be regulated, as well as the number of fish. A different number of fish per designated area may have an effect on the number of trematodes per fish, which may be relevant to human health. It is therefore important to know whether transmission occurs in a density-dependent fashion.
To determine whether transmission is density-dependent or -independent, the size of a designated space can be varied using similar numbers of cercariae and fish. As both cercariae and fish move in three dimensions in water bodies, the size of the designated space, i.e. the water body, can be expressed as a volume. However, cercariae tend to accumulate near the surface of the water (Feiler & Haas, Reference Feiler and Haas1988), in midwater (Haas et al., Reference Haas, Granzer and Brockelman1990) or at the bottom (McCarthy et al., Reference McCarthy, Fitzpatrick and Irwin2002). Furthermore, fish can be distributed unevenly in the water (Gibson, Reference Gibson1972). For example, the common carp (Cyprinus carpio) spends about half of its time at the bottom (Rahman et al., Reference Rahman, Verdegem, Nagelkerke, Wahab and Verreth2008). Therefore, cercariae and/or fish may not be homogeneously distributed in different depths, and the surface area of the bottom might be a better measure than the volume to describe the designated space occupied by fish and cercariae.
The transmission of cercariae to fish has been quantified at either a constant dose of cercariae/volume or a constant area/volume. In the latter case, the density of cercariae increases with increasing doses of cercariae, and thus in both cases, the effect of the dose and the density of cercariae cannot be disentangled. However, the intensity of infection or the number of metacercariae per fish depends on the dose to which fish were exposed in a constant volume of water for the transmission of the non-FZT Transversotrema patialense cercariae to zebra fish (Brachydanio rerio), the non-FZT Diplostomum spathaceum cercariae to rainbow trout (Oncorhynchus mykiss) and the FZT parapleurolophocercous cercariae (Heterophyidae) to common carp (C. carpio) (Anderson et al., Reference Anderson, Whitfield and Dobson1978; Karvonen et al., Reference Karvonen, Paukku, Valtonen and Hudson2003; Boerlage et al., Reference Boerlage, Graat, Verreth and De Jong2011). In addition, for the non-FZT D. spathaceum cercariae, Karvonen et al. (Reference Karvonen, Paukku, Valtonen and Hudson2003) observed no effect on transmission due to the density of cercariae in a constant volume of water and a reverse effect on transmission due to the dose to which fish were exposed at a constant density of cercariae. Thus, these authors concluded that transmission was independent of density.
In designing our experiment, we believed that additional insight into the effect of density on transmission would be gained by disentangling the effect of the dose of cercariae and the density of cercariae. Thus, our approach was different than studies on density- or frequency-dependent transmission because density was evaluated per volume of water and also per surface area of the bottom by maintaining the dose of cercariae constant. Therefore, the objective of our study was to quantify the effect of density with respect to the volume of water and the surface area of the bottom on the transmission of FZT cercariae to common carp (C. carpio).
Materials and methods
Experimental infection of fish
The larval stage of FZTs that emerge from snails, i.e. cercariae, was used to infect the fish. Melanoides tuberculata snails from which parapleurolophocercous cercariae emerged were obtained from Ngia Lac, Nam Dinh Province, Vietnam and brought to the Research Institute for Aquaculture No. 1, Bac Ninh province, Vietnam, where the experiments were carried out. Cercariae were counted as they were drawn into a pipette. Doses of cercariae and volumes of water were prepared according to Boerlage et al. (Reference Boerlage, Graat, Verreth and De Jong2011). Common carp (C. carpio) of unknown exposure history and age were obtained from one local fish farmer. After exposure, the fish were artificially digested according to Boerlage et al. (Reference Boerlage, Graat, Verreth and De Jong2011), after which the numbers of the consecutive larval stage of FZTs in fish, i.e. metacercariae, were counted. Counted metacercariae were of the morphologically distinct groups Haplorchis, Centrocestus and ‘undeveloped’. Haplorchis and Centrocestus forms were considered present prior to experimental exposure. Undeveloped metacercariae were considered to be the result of experimental exposure, and these differed from Haplorchis and Centrocestus because of their formless, motionless appearance in which no organs could be distinguished. This method of distinguishing metacercariae that were ‘already present’ from those that ‘originated from experimental exposure’ has been described and discussed in detail by Boerlage et al. (Reference Boerlage, Graat, Verreth and De Jong2011) and was considered justified because there was a dose–response relationship for ‘undeveloped’ metacercariae that did not exist for Haplorchis and Centrocestus. Undeveloped metacercariae were most likely members of the genus Haplorchidae because the prevalence of species belonging to this genus was highest in the area where the snails were collected (Dung et al., Reference Dung, Van De, Waikagul, Dalsgaard, Chai, Sohn and Murrell2007; Lan Anh et al., Reference Lan Anh, Phuong, Murrell, Johansen, Dalsgaard, Thu, Kim Chi and Thamsborg2009; Phan et al., Reference Phan, Ersbøll, Nguyen, Nguyen, Nguyen, Murrell and Dalsgaard2010).
For sample size estimation, a pilot study was performed in 2009 to estimate the effects of the dose of cercariae and the volume of water during exposure on the prevalence of infection with FZTs, the number of metacercariae per fish and the proportion of FZTs established per common carp (1.07 ± 0.27 g). Sample sizes were calculated using WIN EPISCOPE 2.0 (Thrusfield et al., Reference Thrusfield, Ortega, De Blas, Noordhuizen and Frankena2001) at 95% confidence (one tailed) and 80% power. Sample size calculations to detect a difference between 80 and 100% prevalence resulted in 26 fish per group. To detect a difference between 1 and 8 metacercariae per fish with an SD of 6, 12 fish per group were needed. For differences in the proportion of FZTs established per fish between 0.1 and 0.15 and an SD of 0.07, 27 fish per group were needed. Based on these calculations, it was decided to use at least 30 fish per group.
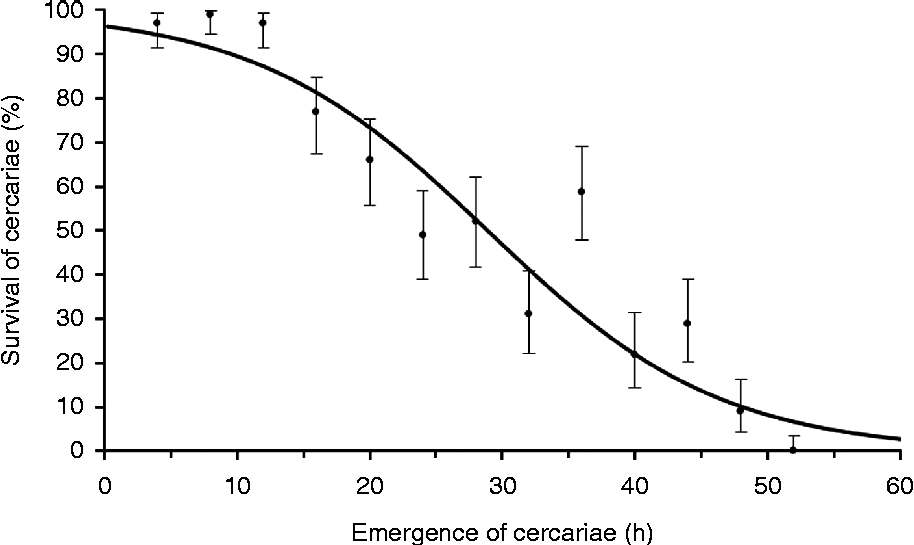
The survival of cercariae that emerged from the snails was determined. Snails were obtained 3 months prior to the exposure of fish to cercariae. Snails were allowed to shed cercariae for 15 min. Subsequently, 1300 cercariae were divided between glass cups containing 3 ml water with ten cercariae per cup. Room temperature was between 29.2 and 31.3°C. Cercariae were defined as ‘dead’ when they remained immobile after being stimulated by a needle. The survival of cercariae was recorded for 100 cercariae (ten cups) every 4 h until 52 h post-emergence of the cercariae (13 sampling times). Survival was recorded only once per sample of cercariae because stimulation during the recordings may have affected survival of cercariae. The survival percentage decreased significantly with time (P < 0.01) (fig. 1). Given a 4-h time for dose preparation, it was decided to let the emergence time of the cercariae be 8 h, so that fish were exposed to cercariae of a maximum age of 12 h and the estimated proportion of living cercariae was approximately 85%.
The observed (●), with exact 95% confidence interval ( ⊥ ), and expected (—, 100/(1+e( − 3.3947+0.1147∙hours post cercariae emerging))) proportion of surviving cercariae (%).

Common carp (0.34 ± 0.17 g) were purchased 20 days prior to exposure in October 2010. The fish were kept in one tank containing 80 litres of well water until exposure. The water temperature was between 26 and 29°C.
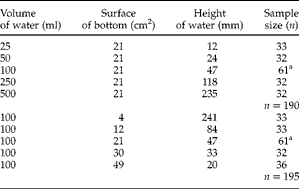
Fish were either kept as controls (n= 91) or exposed to 250 cercariae to estimate the effect of the density of cercariae and the density of fish with respect to the volume of water (n= 190) and the surface area of the bottom (n= 195) (see table 1). In total, nine treatment groups were present. Tubes with respectively 4, 12, 21, 30 or 49 cm2 were filled with 100 ml water, and tubes with respectively 25, 50, 100, 250 or 500 ml water had a bottom surface area of 21 cm2.
Experimental design to demonstrate the effect of the volume of water, surface area of the bottom and height of the water in tubes on carp that were exposed to 250 Heterophyidae.
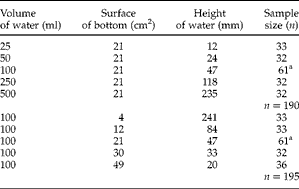
a The same group of fish.
The exposures were performed on ten separate days within a period of 36 days with respectively 45, 29, 25, 20, 15, 31, 48, 36, 45 and 30 fish exposed. On each exposure day, all nine treatment groups were represented. Per treatment group per exposure day, one control fish (no exposure to cercariae) was used, resulting in nine control fish examined on each exposure day. However, on the first exposure day, ten control fish were present. Two fish that died between exposure and digestion were stored at 5°C until digestion.
Data analysis
As data obtained on one exposure day may not be independent, the exposure day was included as a random variable using an exchangeable correlation structure.
The presence or absence of infection was analysed by logistic regression using a binomial distribution and logit link function (PROC LOGISTIC, SAS Institute Inc., 2008). A fish was considered infected when at least one metacercaria was found, and the results were expressed as the prevalence of infection (%). In cases of 0 or 100% infection, random effects could not be included, and an exact test then was used.
The number of metacercariae per fish was analysed using generalized linear models with a Poisson distribution and a log link function (PROC GENMOD, SAS Institute Inc., 2008). The mean numbers of within-groups were adjusted for other effects in the model and expressed as least square means (lsmeans) ± standard error of the mean (SEM) per treatment (SAS Institute Inc., 2008). When no metacercariae were present, lsmeans could not be estimated.
The proportion of FZTs established, i.e. the number of new metacercariae per cercariae exposed to fish, was analysed using generalized linear models with a Gaussian distribution (PROC MIXED, SAS Institute Inc., 2008). Means resulting from the model were expressed as the lsmeans ± SEM per treatment.
Results
In exposed and control fish, the prevalence of infection with Haplorchis metacercariae was respectively 0.3 and 1.1% and that with Centrocestus was, respectively, 46.6 and 40.7%, with no significant difference between the two (respectively, P= 0.38 and P= 0.31) (table 2). For exposed and control fish, the mean number of metacercariae per fish was between 0 and 1 for both Haplorchis and Centrocestus (respectively, P= 0.38 and P< 0.01). Undeveloped metacercariae were absent in control fish but present in 98% of exposed fish (P< 0.0001), with a mean number of 15 metacercariae per fish (P< 0.0001).
The effect of the dose of cercariae on the prevalence (%) of carp infected with metacercariae (mean ± SEM) of the Haplorchis, Centrocestus and undeveloped forms.

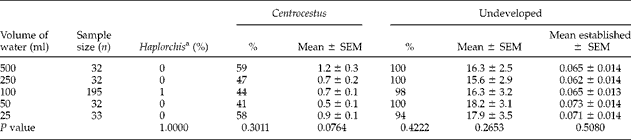
No differences were observed regarding the prevalence of infection, the number of metacercariae per fish or the proportion of FZTs established per fish for fish exposed to 250 cercariae in different densities per volume of water (table 3). The prevalence of infection due to exposure varied between 94 and 100% (P= 0.42). The mean number of metacercariae varied between 16 and 18 metacercariae per fish (P= 0.27), and the exposure day explained 52% of the unexplained variance. The proportion of established FZTs varied between 0.06 and 0.07 metacercariae per cercariae per fish (P= 0.51), and the exposure day explained 67% of the unexplained variance. Density of cercariae did not explain the variation in the proportion of established FZTs (0.06 337+(9.31∙10− 4 × number of cercariae per ml)) (P= 0.14; R 2 below 0.1%).
The prevalence (%) of carp infected with metacercariae of the Haplorchis, Centrocestus and undeveloped forms and the proportion of established undeveloped metacercariae (mean ± SEM) relative to the volume of water in tubes during exposure.
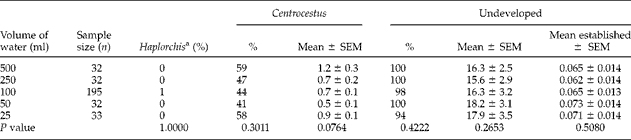
a The mean number of metacercariae could not be estimated because the number of infected fish (n= 1) was too low.
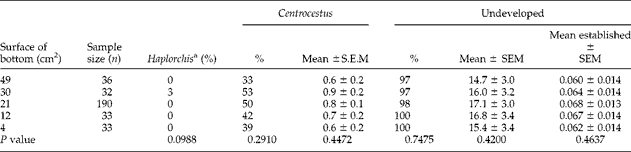
No differences were observed regarding the prevalence of infection with FZTs, the number of metacercariae per fish or the proportion of FZTs established per fish for fish exposed to 250 cercariae at different densities per surface area of the bottom (table 4). The prevalence of infection with FZTs due to exposure varied between 97 and 100% (P= 0.75). The number of metacercariae varied between 15 and 17 metacercariae per fish (P= 0.42) and the exposure day explained 52% of the unexplained variance. The proportion of established FZTs varied between 0.06 and 0.07 metacercariae per cercariae per fish (P= 0.46) and the exposure day explained 66% of the unexplained variance. The density of cercariae did not explain the variation in the proportion of established FZTs (0.06 734 − (6.35∙10− 5 × number of cercariae per cm2)) (P= 0.55; R 2 below 0.1%).
The prevalence (%) of carp infected with metacercariae of the Haplorchis, Centrocestus and undeveloped forms and the proportion of established undeveloped metacercariae (mean ± SEM) relative to the surface area of the bottom in tubes during exposure.
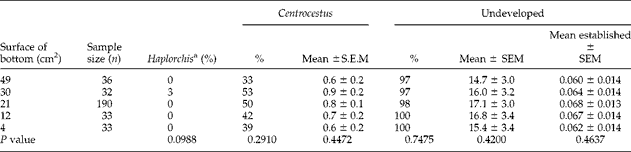
a The mean number of metacercariae could not be estimated because the number of infected fish (n= 1) was too low.
Discussion
Our objective was to quantify the effect of density with respect to the volume of water as well as the surface area of the bottom on the prevalence of infection with FZTs, the number of metacercariae per fish and the proportion of FZTs established per fish in common carp (C. carpio). In contrast to other studies, the dose of cercariae per fish was kept constant in all treatments in our study. Therefore, the density of cercariae and the density of fish per volume of water or surface area of the bottom were 100% co-linear, and ‘density’ related to both the fish and cercariae. Extrapolation of the results into a situation where the dose of cercariae per fish varies, as in Karvonen et al. (Reference Karvonen, Paukku, Valtonen and Hudson2003), may result in different proportions of FZTs established per fish.
Of all the fish exposed, 98% were infected. No differences were observed between the number of metacercariae per fish and the proportion of FZTs established per fish at different densities using a sample size that would have detected differences between treatments, as observed in the pilot experiment. It was therefore concluded that there was no effect of density on transmission. The outcomes for the number of metacercariae per fish were comparable to the estimates of Boerlage et al. (Reference Boerlage, Graat, Verreth and De Jong2011, Reference Boerlage, Graat, Verreth and De Jong2012) for fish of a similar size that were exposed to the same dose of cercariae. However, our results may have been slightly underestimated because our calculations were performed based on a dose of 250 cercariae, whereas the survival curve indicated that on average, 85% of cercariae were expected to be alive. As this was similar for all treatments, it was assumed that this did not have a large influence on the observed relation between density and transmission. The exposure day explained more than half of the unexplained variance, which implies that differences between exposure days had a large effect on transmission. One potential factor that may affect transmission and that differed between exposure days was the temperature. Although the water temperature during exposure days differed by a maximum of only 4°C, this could have caused the effect due to the exposure day. This effect was also observed by Stables & Chappell (Reference Stables and Chappell1986), as they documented that the difference between no transmission and maximum transmission of D. spathaceum to rainbow trout (Salmo gairdneri) was caused by an approximate 7.5°C difference in the water temperature.
However, it remains unclear how these findings should be extrapolated to large water bodies. The densities used in our experiment are in line with those used in fish ponds in aquaculture. For example, in a 0.58-m deep fish pond of 652 m2 (Nhan et al., Reference Nhan, Milstein, Verdegem and Verreth2006) with 4000 snails per m2 (Kittivorachate & Yangyuen, 2004), and 13% of snails with an average of 689 Haplorchis pumilio cercariae emerging per day (Lo & Lee, Reference Lo and Lee1996b; Dung et al., Reference Dung, Madsen and The2010), the density of cercariae is 600 per litre and 350,000 per m2 (250 cercariae per 417 ml and per 7 cm2 on the scale of our experiment). When extrapolated, the densities of fish in our experiment were between 200 and 2500 fish per m2 and covered the range of the densities advised for fish ponds, i.e. 100–400 common carp fry per m2 (Peteri, Reference Peteri2012). The lack of an effect on transmission due to density implies that the expected proportion of cercariae established per fish in a larger designated space, for example a fish pond, may be similar to those observed during the experiment. However, the number of metacercariae per fish in fish populations is generally over-dispersed (Anderson & Gordon, Reference Anderson and Gordon1982), which may be caused by either heterogeneity in the susceptibility of fish to cercariae or generated by factors such as differences in fish behaviours (Anderson et al., Reference Anderson, Whitfield and Dobson1978; Höglund, Reference Höglund1995). Therefore, non-statistical extrapolation of results from situations with individual fish, as in our experiment, to situations with a larger fish population may not be straightforward. Furthermore, as most cercariae actively search for their host (Haas, Reference Haas2003), one can speculate that at very low densities the few cercariae present might not find the few fish in a large fish pond. This corresponds to the expectation that at very low densities the relationship between density and contact rate is different than at average densities (Diekmann et al., Reference Diekmann, De Jong, De Koeijer and Reijnders1995).
To our knowledge, this was the first study to quantify the transmission of FZT cercariae to fish with respect to density by exposing fish to a constant dose of cercariae. It was concluded that transmission was not affected by changes in the density of either cercariae or fish.
Acknowledgements
We appreciated the hospitality of the Research Institute for Aquaculture No. 1, Dinh Bang, Bac Ninh, Vietnam (RIA1) very much. We also thank Nguyen Mai Phuong and other staff of the Centre for Environment and Disease Monitoring in Aquaculture (CEDMA), part of RIA1, and researchers of the project ‘Fish Borne Zoonotic Parasites in Vietnam’ (FIBOZOPA) for their assistance and hospitality. Financial support for PhD student A.S.B. was granted by the Wageningen Institute of Animal Sciences (WIAS), Wageningen University, Wageningen, The Netherlands. This research received no specific grant from any funding agency, commercial or not-for-profit sectors.