

INTRODUCTION
Epigenetic mechanisms are thought to contribute to the maintenance of distinct cell fates by suppressing gene expression required for alternative cell fates (Namihira et al., Reference Namihira, Kohyama, Abematsu and Nakashima2008). However, still very little is known about such mechanisms during neural fate decisions in development or in those brain regions where neurogenesis continues into adulthood. Recent data imply a specific role of micro-RNAs in regulating neural cell fate decisions in a coordinated manner (Kuwabara et al., Reference Kuwabara, Hsieh, Nakashima, Taira and Gage2004; De Pietri Tonelli et al., Reference De Pietri Tonelli, Pulvers, Haffner, Murchison, Hannon and Huttner2008; Leucht et al., Reference Leucht, Stigloher, Wizenmann, Klafke, Folchert and Bally-Cuif2008; Yoo et al., Reference Yoo, Staahl, Chen and Crabtree2009), while still relatively little is known about the role of specific histone modifications. As acetylation and deacetylation are considered the most dynamic form of histone modification, with methylation and ubiquitination exerting more permanent alterations in gene expression (Adcock et al., Reference Adcock, Ford, Ito and Barnes2006; Sparmann and van Lohuizen, Reference Sparmann and van Lohuizen2006; Cloos et al., Reference Cloos, Christensen, Agger and Helin2008), we focused on a possible role of histone deacetylation during differentiation processes in the brain.
Deacetylation of histone tails is mediated by a family of enzymes called histone deacetylases (HDACs) whose enzymatic activity leads to a condensed chromatin structure that results in transcriptional repression (Grozinger and Schreiber, Reference Grozinger and Schreiber2002; de Ruijter et al., Reference de Ruijter, van Gennip, Caron, Kemp and van Kuilenburg2003; Glozak et al., Reference Glozak, Sengupta, Zhang and Seto2005). The effect of histone deacetylation has so far been mostly studied by pharmacological inhibition revealing intriguing, even though also contradictory effects. Application of pharmacological inhibitors of class I HDACs (HDAC1,2,3,8) lead to improved synaptogenesis and neuronal survival (Hsieh et al., Reference Hsieh, Nakashima, Kuwabara, Mejia and Gage2004; Tsankova et al., Reference Tsankova, Berton, Renthal, Kumar, Neve and Nestler2006; Fischer et al., Reference Fischer, Sananbenesi, Wang, Dobbin and Tsai2007; Jessberger et al., Reference Jessberger, Nakashima, Clemenson, Mejia, Mathews and Ure2007; Liu et al., Reference Liu, Han, Li, Sun, Ouyang and Plummer2007; Morrison et al., Reference Morrison, Majdzadeh and D'Mello2007; Putignano et al., Reference Putignano, Lonetti, Cancedda, Ratto, Costa and Maffei2007; Siebzehnrubl et al., Reference Siebzehnrubl, Buslei, Eyupoglu, Seufert, Hahnen and Blumcke2007; Vecsey et al., Reference Vecsey, Hawk, Lattal, Stein, Fabian and Attner2007), inhibition of oligodendrocyte differentiation (Marin-Husstege et al., Reference Marin-Husstege, Muggironi, Liu and Casaccia-Bonnefil2002; Shen et al., Reference Shen, Li and Casaccia-Bonnefil2005; Lyssiotis et al., Reference Lyssiotis, Walker, Wu, Kondo, Schultz and Wu2007) and the maintenance of neural stem cell fate in vitro (Hsieh et al., Reference Hsieh, Nakashima, Kuwabara, Mejia and Gage2004). Conversely, the same inhibitors were also reported to increase neuronal cell death (Yang et al., Reference Yang, Yao, Sun, Davie and Seto1997; Salminen et al., Reference Salminen, Tapiola, Korhonen and Suuronen1998; Morrison et al., Reference Morrison, Majdzadeh and D'Mello2007) or promote neuronal (Balasubramaniyan et al., Reference Balasubramaniyan, Boddeke, Bakels, Kust, Kooistra and Veneman2006; Siebzehnrubl et al., Reference Siebzehnrubl, Buslei, Eyupoglu, Seufert, Hahnen and Blumcke2007), astroglial or oligodendroglial differentiation (Humphrey et al., Reference Humphrey, Wang, Hirai, Padmanabhan, Panchision and Newell2008). These partially discrepant results may be due to the use of different in vitro systems, the analysis of different cell types or unspecific effects of HDAC inhibitors. As individual HDACs are expressed in many, but not all cell types (de Ruijter et al., Reference de Ruijter, van Gennip, Caron, Kemp and van Kuilenburg2003; Shen et al., Reference Shen, Li and Casaccia-Bonnefil2005; MacDonald and Roskams, Reference MacDonald and Roskams2008), pharmacological inhibition may target only the predominantly expressed HDAC and therefore exert different effects. On the other hand, individual HDACs may compensate each other, as recently shown for HDAC1 and HDAC2 during development (Montgomery et al., Reference Montgomery, Hsieh, Barbosa, Richardson and Olson2009; Ye et al., Reference Ye, Chen, Hoang, Montgomery, Zhao and Bu2009). While conditional deletion of HDAC2 only had no effects on oligodendroglial differentiation and cortex development, the deletion of both HDAC1 and 2 resulted in severe myelination defects (Ye et al., Reference Ye, Chen, Hoang, Montgomery, Zhao and Bu2009) and aberrations in cortex development (Montgomery et al., Reference Montgomery, Hsieh, Barbosa, Richardson and Olson2009). As we observed the up-regulation of HDAC2 in neuronal progenitors in the adult brain, we examined here whether it may play a specific, non-redundant role in adult neurogenesis.
OBJECTIVE
In the present study, our objective was to unravel the role of the HDAC2 in neurogenesis during development and in adulthood. Towards this end we used two different mouse lines, a gene trap line expressing a truncated, catalytically not active form of HDAC2 and a conditional mouse line in which we inducibly deleted HDAC2 either during development in radial glial cells or in adult neural stem cells by the use of GLAST::CreERT2 mice. Analysis in both mouse lines revealed no defects in neurogenesis in the absence of HDAC2 during brain development, but severe alterations in adult neurogenesis. These results demonstrate that HDAC2 is required in a cell-autonomous manner during adult neurogenesis for appropriate neuronal differentiation and survival.
METHODS
Mice and injections
Mice with the pT1-βgeo vector inserted into intron 8 of the HDAC2 locus were genotyped as previously described (Zimmermann et al., Reference Zimmermann, Kiefer and Göttlicher2007a). As HDAC2 gene trap mice were maintained on a C57/Bl6 background, WT littermates were used as control. HDAC2 floxed, GLAST::CreERT2 and Z/EG reporter mice were all maintained on a C57/Bl6 background and genotyped as previously described (Novak et al., Reference Novak, Guo, Yang, Nagy and Lobe2000; Mori et al., Reference Mori, Tanaka, Buffo, Wurst, Kuhn and Gotz2006; Montgomery et al., Reference Montgomery, Davis, Potthoff, Haberland, Fielitz and Qi2007). For conditional deletion of HDAC2 GLAST::CreERT2/Z/EG mice, we used triple transgenic heterozygous for GLAST::CreERT2 and Z/EG and homozygous for HDAC2 floxed. As controls for these experiments we used GLAST::CreERT2/Z/EG mice wild type for the HDAC2 alleles but also treated with tamoxifen as for the homozygous HDAC2 floxed mice (see below). All animals used in this study were 3 months of age. All animal procedures were performed in accordance to the Policies on the Use of Animals and Humans in Neuroscience Research, revised and approved by the Society of Neuroscience and the state of Bavaria under license number 55.2-1-54-2531-23/04 and 55.2-1-54-2531-144-07. Cells isolated from the SEZ of mice expressing myristolated Venus (Rhee et al., Reference Rhee, Pirity, Lackan, Long, Kondoh and Takeda2006) were dissociated as described (Seidenfaden et al., Reference Seidenfaden, Desoeuvre, Bosio, Virard and Cremer2006) and injected into the SEZ of HDAC2-deficient mice at 0.6 (anteroposterior), 1.2 (mediolateral) and 2-1.7 (dorsoventral) relative to Bregma.
Histology
After anaesthesia and perfusion with 4% paraformaldehyde in phosphate-buffered saline (PBS), brain sections were stained with antibodies targeted to the C-terminus of HDAC2 (Santa Cruz, sc-7899), 1:100; anti-HDAC1 (Cell Signaling, rabbit) 1:100; anti-GFP (Clontech, rabbit; Chemicon, mouse IgG1) 1:100; anti-Dcx (Chemicon, guinea pig; Chemicon, rabbit) 1:2000; anti-NeuN (Chemicon, mouse IgG1) 1:50; anti-Ki67 (DakoCytomation, rat) 1:50; anti-BrdU (Abcam, rat) 1:300; anti-caspase3 (Promega, rabbit) 1:100; anti-βIIItubulin (Sigma, mouse IgG2b) 1:100; anti-GFAP (Sigma, mouse IgG1) 1:500; anti-PH3 (Upstate, rabbit) 1:200; anti-Calretinin (Chemicon, mouse IgG1) 1:100; anti-Sox2 (Santa Cruz, rabbit) 1:1000; anti-Mash1 (Developmental Studies Hybridoma Bank, mouse IgG1) 1:200 followed by standard fluorescent secondary antibody incubation. 5-Bromo-2′-deoxyuridine (BrdU) was injected at 50 mg/kg body weight 1 h before perfusion or applied in the drinking water for 2 weeks (1 mg/ml in PBS). In situ hybridization was performed according to standard protocols (Cau et al., Reference Cau, Gradwohl, Fode and Guillemot1997).
Cell culture
Adult neurospheres were cultured from adult subependyma following the protocol described by Johannson et al. (Reference Johansson, Momma, Clarke, Risling, Lendahl and Frisen1999). Cells isolated from the lateral wall of the lateral ventricle were cultured in the presence of 20 ng/ml EGF and 10 ng/ml FGF2 under non-adherent conditions to allow the formation of neurospheres. Neurosphere cells were passaged three times and then plated dissociated on poly-d-lysine coated coverslips at a density of 150,000 cells per well (24-well plates) in medium containing EGF and FGF2. At the stage, cells were transduced with pseudotyped retroviruses as described by Hack et al. (Reference Hack, Sugimori, Lundberg, Nakafuku and Gotz2004). The next day, the medium was replaced by Neurobasal supplemented with B27.
Tamoxifen administration
Tamoxifen was dissolved in pre-warmed corn oil at 20 mg/ml concentration on a shaker at 37°C overnight. Ten milligram tamoxifen is required to achieve recombination efficiently. Following a previously established protocol (Mori et al., Reference Mori, Tanaka, Buffo, Wurst, Kuhn and Gotz2006), 1 mg tamoxifen was injected intraperitoneally (i.p.) twice a day for 5 consecutive days. Each time an amount of 50 µl was injected. For the induction at E14 pregnant mice received tamoxifen orally (10 mg; dissolved at 40 mg/ml in a 1:9 ethanol/corn oil mixture) a single time. Brains were collected 3 weeks after tamoxifen induction for the analysis of adult neurogenesis. In case of the embryonic induction with tamoxifen brains were analyzed 28 days after birth.
HDAC activity assay
The HDAC activity assay was performed by using 10 µg total protein extract from freshly isolated hippocampus, OB and cerebellum of WT and HDAC2 deficient mice. First isolation buffer (Hunt buffer) was added to a final volume of 20 µl and then 10 µl of tritium labelled chicken erythrocyte histones (1.5 mg/ml) and incubated at 30°C for 1 h. After this incubation step reactions were stopped with 35 µl Histone Stop and 800 µl ethylacetate followed by a vortex step of 15 s and spin down 4 min at 10,000 rpm in a swing out bucket rotor. Measurement was done using 600 µl of the organic upper phase in 3 ml Scintillation solution. Counts were measured on a Scintillation counter for 1 min.
Fluorescence microscopy
Stainings of brain sections were analyzed with an Olympus FV1000 laser-scanning confocal microscope with optical sections of 1–2 µm intervals. FV 10-ASW1.2 was used as imaging processing software for all pictures. Stainings of neurosphere cultures were analyzed with an Olympus BX61 fluorescence microscope.
Statistical analysis
The immunostained cells were counted in at least three sections from three to five mice per group at comparable rostrocaudal levels, unless stated otherwise. The number of animals analyzed for each experiment is indicated in the respective figure legend. Neurolucida software was used for cell quantifications on sagittal sections at mediolateral levels (0.6–1 mm relative to midline, 3–7 sections/animal) in an area of 60,000 µm2. These data were pooled for each group for statistical analysis with Student's t-test. Each test is two tailed, the unpaired or paired method and significance was grouped according to the p value as indicated also in the figure legends (p < 0.05*; p < 0.01**; p < 0.001***).
RESULTS
Expression of HDAC2 in adult neuronal progenitors and postmitotic neurons
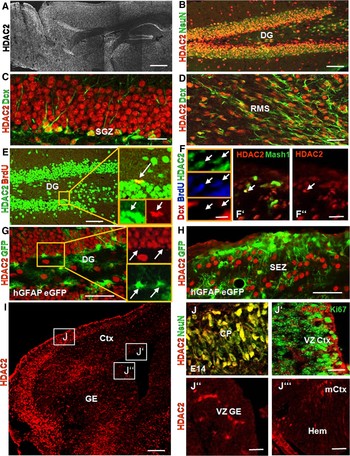
First we examined HDAC2 in stem and progenitor cells at different stages of forebrain development. To ensure the reliability of HDAC2-immunostaining we used sections from HDAC2-deficient mice lacking the immunogenic site located in the catalytic domain of HDAC2 (Zimmermann et al., Reference Zimmermann, Kiefer, Prudenziati, Spiller, Hansen and Floss2007b) (see supplementary figure 1A,B online) or from homozygous floxed HDAC2 mice (Montgomery et al., Reference Montgomery, Davis, Potthoff, Haberland, Fielitz and Qi2007) 21 days after Tamoxifen-induced Cre-mediated HDAC2 deletion (see supplementary figure 1C,D online). Confirming the specificity of the antibody, HDAC2-immunoreactivity was no longer detectable in sections from HDAC2-deficient mice (see supplementary figure 1B online) and in the majority of GFP+ recombined cells (see supplementary figure 1D online). Consistent with previous work (MacDonald and Roskams, Reference MacDonald and Roskams2008), immunostaining for HDAC2 was pronounced in neurons at adult (Fig. 1A–C,E) and embryonic (Fig. 1I,J) stages starting to be detectable around E13 in the developing forebrain. However, little or no HDAC2-immunoreactivity was detectable in proliferating cells expressing Ki67 during forebrain development neither in the cortex nor the ganglionic eminence (GE, Fig. 1I,J′–J′′′). Conversely, we detected many HDAC2-positive progenitors labelled with Ki67 (see supplementary figure 2 online, postnatal day 5) and BrdU-incorporation (Fig. 1E,F adult mice) in the two regions where neurogenesis continues after embryonic development into postnatal and adult stages, the subgranular zone (SGZ) of the dentate gyrus (Fig. 1C,E,G; see supplementary figure 2A online) and the subependymal zone (SEZ) lining the lateral wall of the lateral ventricle (Fig. 1D,F,H; see supplementary figure 2B online). Note that HDAC2 is not expressed in the embryonic anlage of the SEZ, the GE (Fig. 1J″), nor the region of origin of the hippocampus, the cortical hem (Fig. 1J′′′), during development.
Expression of HDAC2 in adult neurogenic regions. (A–J) depict fluorescence micrographs of immunostainings of HDAC2 and cell type-specific antigens as indicated on the left side of the panels. Note that HDAC2-immunoreactivity is contained in NeuN+ neurons (B), Dcx+ neuronal progenitors (C,D) and transit-amplifying precursors (BrdU + , E, BrdU+ Dcx- or Mash1 + , F), but not in hGFAP-GFP+ stem cells (G,H) in the two zones of adult neurogenesis (SGZ: C,E,G; SEZ: F,H). (I,J) show fluorescence micrographs of immunostainings of HDAC2 in the E14 telencephalon (I). High protein levels of HDAC2 are present in NeuN+ neurons in the cortical plate (J) but absent in Ki67+ progenitors at the VZ of the cortex (J′), the VZ of the GE (J″) or in the region of the cortical hem (J′′′). Arrows depict double-positive cells. Yellow rectangles depict cells in higher magnification. CP = cortical plate, Ctx = cortex, DG = dentate gyrus, GE = ganglionic eminence, mCtx = medial cortex, RMS = rostral migratory stream, SEZ = subependymal zone, SGZ = subgranular zone, VZ = ventricular zone. Scale bar in A and I = 100 µm; scale bar in B,E,G,H = 50 µm; scale bar in C,D,F′,F″,J–J′′′ = 20 µm; scale bar in F = 10 µm.

In the regions of adult neurogenesis, radial glia-like stem cells (Type B cells) give rise to fast proliferating transit-amplifying progenitors (TAPs; Type C cells), that then generate neuroblasts (Type A cells), progenitors and young neurons already expressing neuron-specific antigens such as doublecortin (Dcx) (Alvarez-Buylla et al., Reference Alvarez-Buylla, Garcia-Verdugo and Tramontin2001). HDAC2-immunoreactivity was not yet detectable in the adult neural stem cells labelled by GFP driven by the human GFAP promoter (Fig. 1G,H; Mirzadeh et al., Reference Mirzadeh, Merkle, Soriano-Navarro, Garcia-Verdugo and Alvarez-Buylla2008), but was up-regulated at the level of TAPs. TAPs can be identified either as Dcx-negative cells labelled by a short BrdU-pulse (1 h before perfusion) or by the transcription factor Mash1. Both labelling techniques showed co-localization with HDAC2-immunoreactivity (Fig. 1E,F–F″, see also McDonald and Roskams, 2008). HDAC2 expression is further maintained during neuronal differentiation as Dcx+ neuroblasts and NeuN-positive neurons were both HDAC2+ (Fig. 1B–D). In addition HDAC2-immunoreactivity was also detected in some astrocytes and other glia cells (data not shown). Taken together, HDAC2 is expressed in most cell types in the adult brain and appears in neural progenitors only at postnatal stages.
While HDAC2-immunoreactivity was absent in progenitors in the embryonic brain, HDAC1-immunoreactivity was already highly expressed in dividing cells of the developing cerebral cortex (see supplementary figure 1E,E′ online), while it was rather low in differentiating NeuN+ neurons (see supplementary figure 1E″ online). In the adult neurogenic zones hGFAP-GFP+ adult neural stem cells were HDAC1 + , while its immunoreactivity declined at the level of TAPs and was almost not detectable in Dcx+ neuroblasts (MacDonald and Roskams, Reference MacDonald and Roskams2008) and data not shown. Taken together, this cellular analysis revealed the complementary expression of HDAC1 and HDAC2 in largely non-overlapping cell types in the developing and adult forebrain.
Analysis of HDAC2-deficient brains
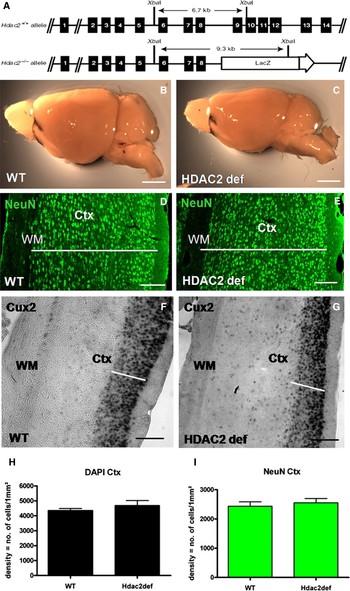
The above expression analysis suggests a possible role of HDAC2 in adult neuronal progenitors. To address this, we used two mouse lines deficient in HDAC2 function, a gene trap line lacking the catalytic domain of HDAC2 due to insertion of LacZ (Fig. 2A and Trivedi et al., Reference Trivedi, Luo, Yin, Zhang, Zhu and Wang2007) and a mouse line containing exons 2–4 of the HDAC2 locus flanked by loxP sites (Fig. 7A and Montgomery et al., Reference Montgomery, Davis, Potthoff, Haberland, Fielitz and Qi2007; Montgomery et al., Reference Montgomery, Hsieh, Barbosa, Richardson and Olson2009).
Anatomy and morphology of HDAC2-deficient brains. Schematic drawing in A depicts the genomic locus of a wild type and an HDAC2 gene trap allele with the insertion of the lacZ fusion construct between exons 8 and 9. (B,C) Lateral view of adult brains from wild type and homozygous HDAC2-deficient mice. (D,E) Fluorescence micrographs of sections of the cerebral cortex stained for neurons (NeuN) and F,G depicts Cux2 mRNA in the upper layers of the cortex. Note the smaller size of the cortex and single layers in the HDAC2-deficient mice marked with white bars. Histograms in H,I depict the density of all cells (DAPI + ) and the neurons (NeuN + ). Note the normal cytoarchitecture and cell density in HDAC2-deficient cortices. Sections in D–G are oriented with the pial surface to the right side of the panels. Ctx = cortex, WM = white matter. n = 3 animals each. Scale bar in B,C = 1 cm, scale bar in D–G = 50 µm.

First, we examined the gene trap mutant in order to determine a potential phenotype in these mice carrying the mutation in all cells, to then target the specific cell type requiring HDAC2 by Cre-mediated recombination in the second mouse line. To examine whether the disruption of the catalytic activity of HDAC2 in the brain of the gene trap mutant mice has a relevant impact on the overall HDAC activity, we determined the HDAC activity in several brain regions. Indeed, HDAC activity was significantly reduced in the olfactory bulb, hippocampus and cerebellum of homozygous mice compared to WT littermates (see supplementary figure 3 online), revealing a significant contribution of HDAC2-mediated deacetylation in these regions and further supporting the functional defects of the catalytic HDAC2 activity of the fusion protein generated in the gene trap (Trivedi et al., Reference Trivedi, Luo, Yin, Zhang, Zhu and Wang2007). While defects in catalytic activity are clearly established, the potential non-catalytic functions of the HDAC2 protein and hence the fusion protein are not clear. As neither a remnant function nor a potential dominant-negative function of the non-catalytic fusion protein can be excluded, we refer to mice homozygous for this gene trap as HDAC2-deficient. In addition, we utilize conditional deletion of the entire protein and compare the phenotype when the entire protein is missing or the non-catalytic fusion protein is still there (see below). As we find very similar effects in both mouse lines (see below), it appears that the fusion protein present in the HDAC2-deficient gene trap does not have a prominent remnant or dominant-negative function in the aspects examined here.
HDAC2-deficient mice are smaller in size (Trivedi et al., Reference Trivedi, Luo, Yin, Zhang, Zhu and Wang2007; Zimmermann et al., Reference Zimmermann, Kiefer, Prudenziati, Spiller, Hansen and Floss2007b) and accordingly also have a slight reduction in brain size (Fig. 2B,C). However, with the exception of the cerebellum (data not shown), the overall brain cytoarchitecture was not affected in HDAC2-deficient mice. For example, the layered architecture of the cerebral cortex was perfectly normal, including the formation of layer II/III labelled by Cux2 expression (Fig. 2D–G) and layers V/VI labelled by Tbr1-immunostaining (data not shown). Consistently, both cell and neuronal density per mm2 were well comparable between HDAC2-deficient and WT (cerebral cortex in Fig. 2H,I) and also the proportion of NeuN-positive neurons among DAPI-labelled cells was rather similar in the olfactory bulb of WT (83% ± 3 SEM) and HDAC2-deficient mice (74% ± 3 SEM; three animals per genotype). Moreover, we also did not detect any defects in the developing forebrain of HDAC2-deficient mice (see supplementary figure 4A–D online). Both, the number of neurons (labelled with Dcx, βIIItubulin or NeuN) and progenitors (labelled by phosphohistone 3) were similar in embryonic day (E)14 HDAC2-deficient and WT cortices from three different litters (see supplementary figure 4E,F online). Moreover, no difference in the proportion of NeuN+ neurons among DAPI-labelled cells was observed in the OB and dentate gyrus during postnatal stages (see supplementary figure 2C–E online). Taken together, these data show that neurogenesis and neuronal differentiation can occur fairly normally despite the absence of HDAC2 function. These findings are fully consistent with the data obtained after hGFAP-Cre-mediated deletion of HDAC2 (Montgomery et al., Reference Montgomery, Hsieh, Barbosa, Richardson and Olson2009).
Defective neuronal maturation in both adult neurogenic regions of HDAC2-deficient brains
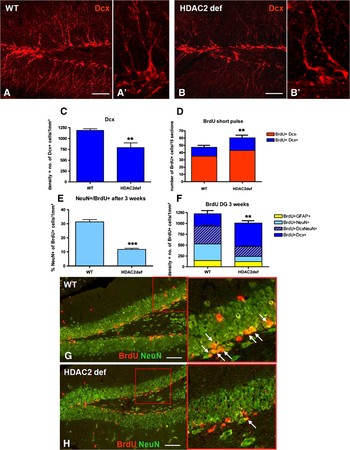
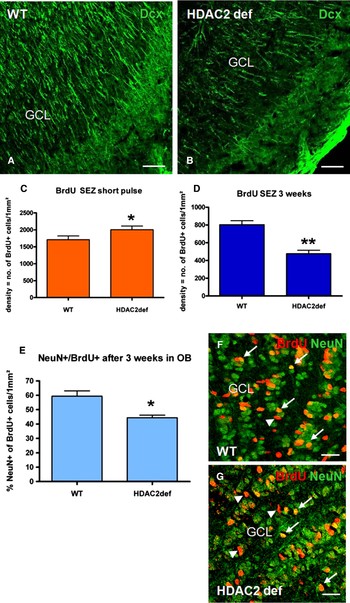
A major difference between expression of HDAC2 in the developing and adult brain was its absence in neuronal progenitors of the developing forebrain (Fig. 1I to J′′′), while HDAC2 was expressed in progenitors of the postnatal and adult neurogenic niches (Fig. 1C–H). We therefore examined these two regions in the adult brain by staining for doublecortin to reveal young neurons and neuronal progenitors. Indeed, Dcx-immunostaining revealed an obvious (and significant Fig. 3C) reduction of Dcx+ cells in both regions of adult neurogenesis in homozygous HDAC2-deficient mice compared to WT littermates (Figs 3A–C and 4A,B). As Dcx labels proliferating neuroblasts as well as differentiating postmitotic neurons, we first examined whether dividing progenitor cells may be reduced by labelling cells in S-phase with BrdU given 1 h before perfusion. Interestingly, the number of BrdU-incorporating, fast proliferating cells was found to be increased in both neurogenic zones of the HDAC2-deficient mice (Figs 3D and 4C). However, the composition of these fast proliferating cells was not affected as a similar proportion was Dcx-positive or -negative, respectively, despite the overall increase in proliferating cells (Fig. 3D). This increase in the number of BrdU-incorporating cells may be due to an increase in the total number of progenitor cells or an increase in the proliferation rate. To discriminate between these two possibilities we examined the labelling index (LI = BrdU + /Ki67 + ) a direct measure of the cell cycle length as it determines the proportion of proliferating cells (Ki67 + ) that are in S-phase and hence incorporated BrdU within the last hour. The faster the cell cycle is, the more progenitor cells are in S-phase at any given moment. Indeed, SEZ cells of HDAC2-deficient mice had a significantly (P < 0.01) increased LI (0.5, ±0.003SEM) compared to WT littermates (0.4, ±0.003SEM; three animals per genotype). Conversely, the overall number of Ki67+ cells did not differ significantly between WT and HDAC2-deficient SEZs (WT = 81 (±4) and in HDAC2-deficient mice = 95 (±5), n = 3 animals), even though we observed a tendency towards an increase in the number of Ki67+ progenitors. Taken together, these data suggest that the proliferation rate of progenitors in the adult neurogenic zone increased in the HDAC2-deficient mice.
Adult neurogenesis is impaired in the dentate gyrus of HDAC2-deficient mice. Fluorescence micrographs (A,B) and histograms (C–F) depict the reduced number of newly generated neurons in the dentate gyrus (DG) of HDAC2-deficient mice compared to control littermates. Note the significant increase in the number of proliferating cells (short pulse of BrdU for 1 h, D) while the number of differentiated cells, especially those expressing NeuN, is severely reduced in the HDAC2-deficient DG (E,F). Fluorescent micrographs depict BrdU+ NeuN+ cells in the DG after BrdU administration for 1–3 weeks (G,H). Note the reduced number of double-positive cells (arrows) in the HDAC2-deficient DG. Red rectangles depict cells in higher magnification. Error bars depict SEM and **, *** depict p < 0.01, 0.001 determined by unpaired t-test, respectively, n = 5 animals (C), n = 3 animals (D–F). Scale bar in A,B,G,H = 50 µm.

Defects in adult olfactory bulb neurogenesis in HDAC2-deficient mice. (A,B) Fluorescent micrographs of Dcx+ neuroblasts in the olfactory bulb (OB) showing a reduction in HDAC2-deficient mice (B) compared to WT littermate (A). Histograms in (C–E) depict the quantification of proliferating cells labelled with a short BrdU pulse (C) or the progeny of cells labelled with BrdU 1–3 weeks ago (D,E). Note the significant increase in the number of fast proliferating cells (C) and the converse decrease in maturating neurons (E) in the HDAC2-deficient subependymal zone (SEZ, D) and OB (E) compared to WT littermates that are double positive for BrdU and NeuN (arrows in F,G; arrowheads depict BrdU + , NeuN- cells). GCL = granule cell layer. Error bars depict SEM and *, ** depict p < 0.05, 0.01 determined by unpaired t-test, respectively. n = 3 animals (C–E). Scale bar in A and B = 50 µm; scale bar in F and G = 20 µm.

As proliferation was found to be increased rather than decreased in HDAC2-deficient adult neurogenic zones, it cannot account for the total decrease in Dcx+ cells. We therefore asked whether this decrease may be due to defects in neuronal differentiation. When differentiating cells were examined by BrdU-labelling 3 weeks prior to analysis (see Methods), their number was significantly decreased (Figs 3F and 4D). This was due to a significant decrease in differentiating neurons labelled by NeuN in the absence of catalytically active HDAC2 both in the DG (Fig. 3E) and OB, the final destination of neurons generated in the SEZ (Fig. 4E–G). Notably, the defects appear to start when NeuN is up-regulated and Dcx is still present, because the triple-positive cells (BrdU + /Dcx + /NeuN + ) were already reduced in number, while the proportion of BrdU+ cells containing only Dcx, but not yet NeuN, was even increased in the DG of HDAC2-deficient mice (Fig. 3F). This suggests that HDAC2-deficient neuroblasts have problems to further progress in neuronal maturation. Indeed, the defects at this critical stage of differentiation were further corroborated by immunostaining for Calretinin, a Ca-binding protein that is transiently expressed at the time of transition from Dcx to NeuN expression (Kempermann et al., Reference Kempermann, Jessberger, Steiner and Kronenberg2004) (see supplementary figure 5A–C online). Thus, the overall reduction in Calretinin+ and Dcx+ cells in the DG of HDAC2-deficient mice reflects defects during neuronal differentiation at the time when NeuN is up-regulated. The overall decrease in Dcx+ cells is not due to defects in proliferating Dcx+ cells or even young neuroblasts as the Dcx+ cells born only 2–3 weeks before (indicated by BrdU-incorporation) did not yet show a decrease at the Dcx+ neuroblast stage (Fig. 3F–H). However, when NeuN is up-regulated the Dcx + /NeuN+ cells were reduced in number, suggesting that the overall reduction of this population (which is also calretinin + ) leads to the overall decrease in Dcx+ cells noted initially (Fig. 3C). Taken together, this analysis revealed impaired neuronal maturation in both zones of adult neurogenesis of HDAC2-deficient mice.
As histone deacetylation is largely (although not exclusively) inhibiting gene expression (Zupkovitz et al., Reference Zupkovitz, Tischler, Posch, Sadzak, Ramsauer and Egger2006; Chen and Cepko, Reference Chen and Cepko2007), we next examined candidates that may be impaired in their normal down-regulation in the progression of neural progenitors towards differentiating neurons. As the proliferation was increased and differentiation was impaired, we speculated that genes expressed in progenitors may be increased in expression in the HDAC2-deficient mice. As many progenitors in the SGZ and SEZ express Sox2 (Suh et al., Reference Suh, Consiglio, Ray, Sawai, D'Amour and Gage2007), we examined Sox2 in WT and HDAC2-deficient DG. Sox2 expression was restricted to stem and progenitor cells in the WT DG and already Dcx+ cells rarely contained Sox2 (2.5%, see supplementary figure 6A,C,E online). Consistent with the absence of Sox2 in maturating and mature neurons, no Sox2+ NeuN+ cells were detectable throughout the entire telencephalon (see supplementary figure 7 online). The only Sox2+ cells outside the neurogenic progenitor niches are astrocytes (data not shown). In HDAC2-deficient DGs, however, the number of Dcx+ cells that contained Sox2 was significantly increased to almost 3× of the numbers in WT (see supplementary figure 6B,C,F online), suggesting that some Dcx+ neuroblasts retain Sox2 expression at abnormally high levels or for abnormally long periods. Interestingly, expression levels of Hes5 were not increased in the SEZ or SGZ (data not shown), consistent with the normal extent of neuroblast formation, rather than maintaining cells in an undifferentiated progenitor state. These data support the notion that the lack of HDAC2-function results in increased expression of progenitor transcripts causing an increase in proliferation rate and defects in neuronal maturation.
Increased cell death in adult neurogenic regions of HDAC2-deficient brains
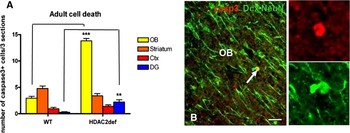
The decrease in neurons maturating from cells generated a few weeks before resulted in an overall reduction in the number of cells born 2–3 weeks earlier (Fig. 3F). These data suggests that cells do not convert their fate but rather may succumb to cell death. Indeed, labelling for activated caspase 3 revealed a significant increase in activated caspase 3+ cells in the two regions where adult generated neurons settle, the OB and DG (Fig. 5A, 3× increase). Co-localization of activated caspase 3 with Dcx and NeuN revealed a prevalence of positive cells among the dying cells in these regions in HDAC2-deficient mice (43% in WT versus 70% in HDAC2 def mice) (Fig. 5B), supporting the concept that a considerably increased proportion of adult generated neurons died during their maturation in the absence of catalytically active HDAC2. Conversely, the number of activated caspase 3+ cells was not different between the genotypes in other forebrain regions (Fig. 5A and data not shown), such as the cortex and the striatum, further supporting the concept that neuronal cell death is specific to adult generated neurons.
Increased cell death in HDAC2-deficient brains. Histogram in A depicts the number of activated-caspase 3+ cells in different brain regions of WT and HDAC2-deficient mice. B shows a fluorescent micrograph of an activated-caspase 3+ cell double-labelled with a Cy2-labelled secondary antibody for both neuron specific NeuN and Dcx. Ctx = cerebral cortex, DG = dentate gyrus, OB = olfactory bulb. Error bars depict SEM and **, *** depict p < 0.01, 0.001 determined by unpaired t-test, respectively. n = 5 animals. Scale bar = 20 µm.

HDAC2 function is not required in adult neural stem cells
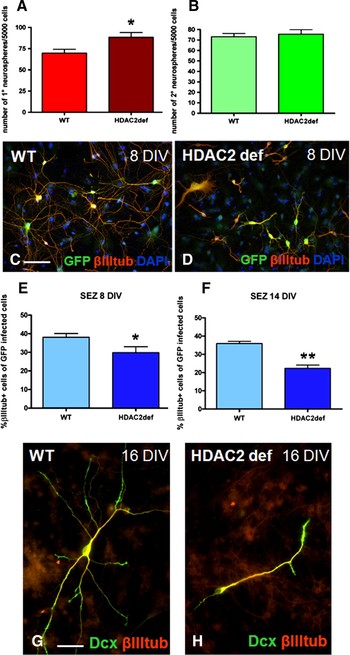
To examine neural stem cell function in the HDAC2-deficient mice, we first quantified the number of slow-dividing GFAP+ cells in the SGZ and observed no differences between WT and HDAC2-deficient mice (Fig. 3F). To further scrutinize whether stem cell self-renewal may be affected, we used the neurosphere assay to examine the propagation of neural stem and progenitor cells. Consistent with the higher proliferation observed in HDAC2-deficient SEZ (Fig. 4C and data above), we observed a significantly increased number of primary neurospheres formed by HDAC2-deficient SEZ cells compared to those derived from WT SEZ (Fig. 6A). To examine the number of self-renewing stem cells in this assay, we quantified the formation of secondary neurospheres (Fig. 6B). Notably, the number of secondary neurospheres was very similar among cells derived from the SEZ of both genotypes, further supporting the concept that stem cells, that do not express HDAC2 (Fig. 1G,H) are not affected in the HDAC2-deficient mice. These data also imply that the other alterations observed in adult neurogenesis in HDAC2-deficient mice do not affect stem cell proliferation in an indirect manner, e.g. by a feedback mechanism.
HDAC2-deficient cells in neurosphere culture. Histograms in A,B depict the increase in the number of primary neurosphere forming cells (=proliferating cells), but not self-renewing neurospheres (=stem cells) isolated from HDAC2-deficient SEZ. Upon exposure to differentiating conditions HDAC2-deficient cells initially generate a slightly reduced number of neurons (E, 8 days in vitro, DIV) that exhibit shorter processes (micrographs in C,D) and then further decrease by cell death after 14 DIV (F) or show major defects in neuronal maturation after 16 DIV (G,H). Error bars depict SEM and *, ** depict p < 0.05, 0.01 determined by unpaired t-test, respectively. n = 3 independent experiments (A, B and E, F), Scale bar in C and D = 20 µm; scale bar in G and H = 10 µm.

To examine, whether the defects in neuronal differentiation in the SEZ-OB neurogenesis would also occur under these isolated in vitro conditions, we exposed neurosphere cells to differentiating conditions by plating them onto adhesive substrates and omitting the growth factors EGF and FGF2 (see Methods). In order to selectively label cells dividing at this time we infected them with a GFP-containing retroviral vector at the time of plating and then followed their progeny (Hack et al., Reference Hack, Sugimori, Lundberg, Nakafuku and Gotz2004). Already 8 days after differentiation and more severely after 14 days, the number of HDAC2-deficient neurons was decreased (Fig. 6E,F). As we did not observe a converse increase in other cell types, we conclude that this decrease in HDAC2-deficient neurons is also due to cell death. This is further supported by the poor morphology of the remaining HDAC2-deficient neurons (Fig. 6C,D,G,H). As these defects appear de novo in isolated cells in vitro, we would conclude that the phenotype in adult neurogenesis is not due to general alterations in the HDAC2-deficient mice.
Conditional deletion of HDAC2 in adult neural stem cells results in defective neuronal differentiation and cell death in vivo
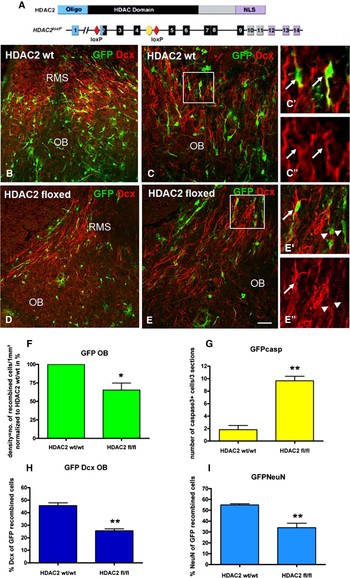
To examine whether the HDAC2 fusion protein present in the gene trap mice may still have a remnant function or conversely even exert dominant-negative effects, we deleted the entire HDAC2 protein in adult neural stem cells by crossing mice containing exons 2–4 of the HDAC2 gene flanked by LoxP sites (Fig. 7A) (Montgomery et al., Reference Montgomery, Davis, Potthoff, Haberland, Fielitz and Qi2007) with the GLAST::CreERT2 line that mediates recombination inducible in adult neural stem cells (Mori et al., Reference Mori, Tanaka, Buffo, Wurst, Kuhn and Gotz2006; Ninkovic et al., Reference Ninkovic, Mori and Gotz2007; Colak et al., Reference Colak, Mori, Brill, Pfeifer, Falk and Deng2008). These experiments also allow us to detect any indirect effects on adult neurogenesis that may be responsible for the defects seen in the full HDAC2-deficient mutants that contain mutant protein in all cells of their body and are also affected in size. Cells that had undergone genetic recombination mediated by CreERT2 translocation to the nucleus induced by Tamoxifen were monitored by GFP expression using the Z/EG reporter mouse line (Novak et al., Reference Novak, Guo, Yang, Nagy and Lobe2000). When cells were examined 3 weeks after tamoxifen application, HDAC2 protein had disappeared in 81% of the reporter+ cells in HDAC2fl/fl mice [n(cells counted) = 905; n(number of animals analyzed) = 6; see supplementary figure 1 online]. As previously shown (Ninkovic et al., Reference Ninkovic, Mori and Gotz2007; Colak et al., Reference Colak, Mori, Brill, Pfeifer, Falk and Deng2008), 3 weeks after tamoxifen-mediated recombination, the first progeny derived from GLAST+ stem cells has already migrated through the RMS and reached the OB (Fig. 7B,C). Notably, significantly fewer GFP+ cells were detectable in the OB of mice homozygous for the floxed alleles (Fig. 7D–F). This may be due to defects in cell survival, migration or progenitor proliferation. As we observed no reporter+ cells outside the RMS in GLAST::CreERT2/HDAC2fl/fl this suggests that HDAC2-deleted neuroblasts did not leave the RMS. To examine whether cell death may cause the depletion of reporter+ cells in the OB, we stained for activated caspase 3. Indeed, the number of positive, apoptotic cells was increased by 5× in the OB of HDAC2fl/fl but not control mice (Fig. 7G). Moreover, the morphology of the remaining reporter+ HDAC2 − /− neurons arriving in the OB was poorly developed (arrowhead in Fig. 7E′, see supplementary figure 8A,B online), similar to our observations in isolated neural stem cell cultures (Fig. 6H). Further consistent with the defects in neuronal maturation and survival observed in the gene trap mice, the proportion of reporter+ cells expressing Dcx or NeuN in the OB or DG was significantly reduced compared to control littermates (Fig. 7H,I, see supplementary figure 8A,B online).
Time- and spatial deletion of HDAC2 in adult neural stem cells. (A) Schematic drawing depicts the HDAC2 protein and below the genomic construct of the HDAC2 locus with exons 2–4 flanked by loxP sites. (B–E) Fluorescent micrographs depict GFP+ recombined cells in the OB 3 weeks after tamoxifen induction. Note the majority of GFP+ cells expressing Dcx (C′,C″) in WT animals. Histograms in F–I show the percentage of GFP+ cells reaching the OB (F), the number of activated caspase3+ cells in the OB (G), the reduced percentage of Dcx+ (H) and NeuN+ cells (I). Arrows depict double-positive cells, arrowheads depict cells only positive for GFP. White rectangles show cells in higher magnification. OB = olfactory bulb, RMS = rostral migratory stream. Error bars depict SEM and *, ** depict p < 0.05, 0.01 determined by unpaired t-test, respectively. n = 3 animals. Scale bar in B–E (indicated in E) = 50 µm.

To examine how early these defects occur in the neural stem cell-derived lineage, we also quantified the percentage of reporter+ cells expressing Dcx in the SEZ rather than the OB, i.e. at the time when Dcx+ cells are still proliferating neuroblasts or just exited the cell cycle [see Colak et al. (Reference Colak, Mori, Brill, Pfeifer, Falk and Deng2008) for numbers on postmitotic neuroblasts in the SEZ]. Interestingly, at this early stage in the lineage the proportion of Dcx+ cells among reporter+ cells was still identical in both genotypes [84% (±3) in control animals and 86% (±2) in HDAC2 fl/fl animals, n = 3 per genotype], suggesting that the effect upon HDAC2 deletion does not occur early in the neural stem cell lineage but rather late during neuronal differentiation. Thus, the phenotype and its timing with a reduction of maturating neurons due to cell death observed after acute deletion of HDAC2 in adult neural stem cells was highly reminiscent of the phenotype observed in the HDAC2-deficient mice. Indeed, similar results were also obtained upon conditional deletion of HDAC2 in neural stem cells of the DG (see supplementary figure 8C–E online).
The inducible deletion of HDAC2 by GLAST::CreERT2-mediated genetic deletion also provided us with the ideal tool to examine in the same mouse line on the same genetic background the potential difference in the effect of HDAC2 on embryonic versus adult neurogenesis. After the prominent effects observed in this mouse line in adult neurogenesis, we deleted HDAC2 in radial glial cells at E14 by giving Tamoxifen to the pregnant mother at 14 days after plug check. Already at E19, i.e. 5 days after induction of genetic recombination, the proportion of HDAC2-immunopositive cells among the reporter+ cells had declined to 35% of the double-positive cells in HDAC2 fl/fl mice [n(cells counted) = 400 in control animals n(animals) = 4; and n(cells counted) = 446 in HDAC2 fl/fl mice; n(animals) = 5] and this lack of HDAC2+ protein persisted at similar levels into later stages (data not shown). However, the lack of HDAC2 protein in most differentiating neurons did not affect neuronal differentiation or survival, as the proportion of neurons among reporter+ cells was not different at all between 4 weeks old GLAST::CreERT2/HDAC2fl/+ and GLAST::CreERT2/HDAC2fl/fl mice in the cerebral cortex, as well as the OB and DG (see supplementary figure 9E online). Thus, in the very same regions where neuronal differentiation and survival is impaired among recombined cells in adult neurogenesis, no phenotype is detectable when recombination occurred at embryonic stages, strongly suggesting that HDAC2 is required for neuronal differentiation at adult, but not embryonic and neonatal stages. Taken together, conditional deletion of HDAC2 in neural stem cells at embryonic or adult stages demonstrates a cell-autonomous role of HDAC2 in neuronal differentiation exclusively in adult neurogenesis.
HDAC2 is not required for the neurogenic niche in the adult SEZ
While the above results suggest a cell-autonomous role of HDAC2 in the adult neurogenic lineage, loss of HDAC2 function in the HDAC2-deficient mice may in addition affect the neurogenic niche. To directly test this possibility, we examined whether cells of the WT SEZ could differentiate normally in an HDAC2-deficient SEZ environment. As described previously (Colak et al., Reference Colak, Mori, Brill, Pfeifer, Falk and Deng2008), cells were isolated from the SEZ of 6-week-old mice that ubiquitously express the fluorescent protein Venus (Rhee et al., Reference Rhee, Pirity, Lackan, Long, Kondoh and Takeda2006), transplanted into the SEZ of 8-week-old WT and HDAC2-deficient littermates (see supplementary figure 10A online) and examined 21 days after transplantation by double staining for GFP and NeuN (see supplementary figure 10B,C online). Notably, a similar proportion of transplanted WT cells had differentiated into mature NeuN-positive neurons in the HDAC2-deficient or WT environment (see supplementary figure 10C online), indicating that the neurogenic niche is still intact in the HDAC2-deficient brains supporting neurogenesis from WT SEZ-derived cells. Conversely, when HDAC2-deficient cells were transplanted into the SEZ of WT mice, the proportion of neurons amongst the transplanted cells was reduced to 70% of the percentage seen when WT SEZ cells were transplanted into the same region (see supplementary figure 10B,C online). The latter data, GLAST::CreERT1/HDAC2fl/+ further support a cell-autonomous function of HDAC2 in neuronal differentiation of adult generated neurons, as also demonstrated above by the conditional deletion of HDAC2 in adult neural stem cells in an otherwise unaltered environment.
CONCLUSIONS
• The study shows a surprising difference of epigenetic mechanism involved in regulating neurogenesis during development and adulthood.
• HDAC2 plays a specific role in adult neurogenesis and is required for full differentiation and survival of adult generated neurons, while it is dispensable during development.
• This specific role of HDAC2 in adult neurogenesis is important to consider when interfering with HDAC function in therapeutic treatments.
DISCUSSION
Here we unravelled a specific and pronounced role of HDAC2 in adult neurogenesis, in contrast to its dispensable function during development. Despite the prominent expression of HDAC2 in virtually all neurons already at embryonic stages, the absence of the catalytic HDAC2 function in the brain still allows fairly normal brain development with largely normal cytoarchitecture and only a marginal reduction in its size. Indeed, the absence of a phenotype in the developing brain was further confirmed by conditional deletion of the complete HDAC2 protein either inducibly by Cre (GLAST::CreERT2, here) or permanently driven in neural stem cells (Montgomery et al., Reference Montgomery, Hsieh, Barbosa, Richardson and Olson2009). These findings further imply that the effects on neurogenesis observed in the forebrain upon application of TSA to pregnant mothers (Shaked et al., Reference Shaked, Weissmuller, Svoboda, Hortschansky, Nishino and Wolfl2008) must be due to inhibition of HDACs other than HDAC2 or systemic effects of TSA application. Indeed, the conditional deletion of both HDAC1 and HDAC2 resulted in neurogenesis defects during development with a striking restriction in time (Montgomery et al., Reference Montgomery, Hsieh, Barbosa, Richardson and Olson2009). These data are also well in agreement with our observation that HDAC1 is upregulated ectopically in postmitotic neurons at the first two postnatal weeks in HDAC2-deficient mice (see supplementary figure 11 online), while it declines thereafter. This transient up-regulation may well be instrumental to allow neuronal differentiation and survival, which is compromised when both HDAC2 and HDAC1 are deleted (Montgomery et al., Reference Montgomery, Hsieh, Barbosa, Richardson and Olson2009).
Surprisingly, however, HDAC2 alone becomes necessary for neurogenesis at later stages. Both, in the gene trap HDAC2-deficient mice as well as upon conditional deletion of HDAC2 in the adult neural stem cell lineage adult generated neurons were severely impaired in their differentiation and survival. While the initial steps towards neuronal differentiation could occur, further maturation was affected in the absence of HDAC2 function leading to the death of adult generated neurons at the time when Dcx+ neurons acquire NeuN (or calretinin in the DG). Notably, HDAC1-immunostaining showed no up-regulation or expression into later stages of the adult neurogenic lineage (see supplementary figure 11G,H online), consistent with the suggestion that HDAC1 does not compensate the loss of HDAC2 in the context of adult neurogenesis.
This function of HDAC2 in adult neurogenesis is cell autonomous as demonstrated by conditional deletion of HDAC2 in adult neural stem cells and their resulting progeny as well as transplantation experiments. Deletion of HDAC2 within the adult neural stem cell-derived lineage, in an otherwise normal environment, proved to be sufficient to interfere with normal neuronal differentiation and survival. Moreover, HDAC2 is not expressed in astrocytes within the neurogenic niche, but only in fast proliferating progenitors, suggesting that GLAST::CreERT2-mediated deletion of HDAC2 is unlikely to affect the stem cell niche. Indeed, WT cells transplanted into the HDAC2-deficient SEZ could undergo normal neurogenesis and neuronal differentiation. This supports an exclusively cell-autonomous function of HDAC2 in the adult neurogenic lineage.
The observation that proliferation of adult neural progenitors is increased in the absence of HDAC2 function implies a function of HDAC2 already at the progenitor level (see summary in supplementary figure 12 online). Indeed, the phenotype observed exclusively in adult but not in embryonic neurogenesis correlates to the expression of HDAC2 in progenitors that occur only in postnatal and adult neurogenic progenitor cells. In contrast to HDAC2 expression in TAPs and neuroblasts in the regions of adult neurogenesis, HDAC2 was not detectable in neuronal progenitors located in the VZ during development. Further consistent with the critical role of HDAC2 in adult neural progenitors, we observed an aberrant maintenance of Sox2 expression in some HDAC2-deficient neuroblasts as well as an increased rate of progenitor proliferation. Thus, the down-regulation of Sox2 and probably many other progenitor transcripts during neuronal differentiation may be mediated by HDAC2-dependent deacetylation. Interestingly, aberrant maintenance of Sox2 expression was also observed in oligodendroglial progenitors upon pharmacological inhibition of class I HDACs in vitro (Lyssiotis et al., Reference Lyssiotis, Walker, Wu, Kondo, Schultz and Wu2007) and in vivo (Marin-Husstege et al., Reference Marin-Husstege, Muggironi, Liu and Casaccia-Bonnefil2002), suggesting that the repression of group B1 Sox transcription factors expressed in immature progenitors may be a more common role of class I HDACs to allow normal differentiation (Lyssiotis et al., Reference Lyssiotis, Walker, Wu, Kondo, Schultz and Wu2007; Li et al., Reference Li, Kato, Tsuji and Tsunoda2008). These data support the concept that the simultaneous presence of some otherwise progenitor- and neuron-specific transcripts in the HDAC2-deficient adult generated neurons would eventually drive these into cell death (see supplementary figure 12 online). Interestingly, the phenotype of HDAC1 and HDAC2 double mutants in the developing brain also revealed defects during the phase when progenitors differentiate into neurons (Montgomery et al., Reference Montgomery, Hsieh, Barbosa, Richardson and Olson2009). Thus, these data converge to a concept of class I HDACs being particularly critical in differentiation processes in the brain.
However, deacetylation is also of direct importance for already differentiated cells as only the deacetylated Ku70 interacts with the proapoptotic factor Bax and retains it in the cytoplasm. An increase in Ku70 acetylation results in liberation of Bax and the induction of cell death (Cohen et al., Reference Cohen, Lavu, Bitterman, Hekking, Imahiyerobo and Miller2004; Li et al., Reference Li, Yokota, Gama, Yoshida, Gomez and Ishikawa2007). This latter mechanism prompts the question why HDAC2 expression in mature neurons is not required for their survival, as most embryonic generated neurons survive well in the absence of HDAC2. Indeed, the compensatory up-regulation of HDAC1 occurs only transiently (see supplementary figure 11 online), and most neurons in the HDAC2-deficient mice then lack both, detectable levels of HDAC1 and HDAC2 catalytic function. Consistent with these data obtained by immunostaining, we also observed a significant reduction in the overall HDAC activity in these brains (see supplementary figure 3 online). Thus, the remnant level of HDAC activity is obviously still sufficient to deacetylate Ku70 or other proteins regulating neuronal survival (Kim et al., Reference Kim, Frank, Dobbin, Tsunemoto, Tu and Peng2008; Majdzadeh et al., Reference Majdzadeh, Wang, Morrison, Bassel-Duby, Olson and D'Mello2008) and neither HDAC2 nor HDAC1 that is not up-regulated at these latter stages are specifically required for the above-mentioned processes. Conversely, HDAC2 is critically required during the time of adult neuronal progenitor differentiation to silence progenitor transcripts, but then seems no longer be required for neuronal survival once these neurons have fully matured. Rather, HDAC2 may then exert different roles in fully mature neurons, as class I HDACs have been implicated in synaptic plasticity, and may become relevant again for survival after a challenge, such as brain injury or neuronal degeneration (Fischer et al., Reference Fischer, Sananbenesi, Wang, Dobbin and Tsai2007; Nott et al., Reference Nott, Watson, Robinson, Crepaldi and Riccio2008; Guan et al., Reference Guan, Haggarty, Giacometti, Dannenberg, Joseph and Gao2009).
Beyond the molecular mechanisms mediating the specific function of HDAC2, a key finding of our analysis here is the difference in molecular control of neuronal differentiation in the adult and embryonic brain. Most intrinsic fate determinants implicated in adult neurogenesis so far, such as Pax6, Dlx2, Olig2 or Tlx (Shi et al., Reference Shi, Chichung Lie, Taupin, Nakashima, Ray and Yu2004; Hack et al., Reference Hack, Saghatelyan, de Chevigny, Pfeifer, Ashery-Padan and Lledo2005; Brill et al., Reference Brill, Snapyan, Wohlfrom, Ninkovic, Jawerka and Mastick2008; Liu et al., Reference Liu, Belz, Bock, Takacs, Wu and Lichter2008; Zhang et al., Reference Zhang, Zou, He, Gage and Evans2008) exert similar roles in fate commitment or stem cell proliferation during development (Haubst et al., Reference Haubst, Berger, Radjendirane, Graw, Favor and Saunders2004; Roy et al., Reference Roy, Kuznicki, Wu, Sun, Bock and Schutz2004; Ligon et al., Reference Ligon, Fancy, Franklin and Rowitch2006; Petryniak et al., Reference Petryniak, Potter, Rowitch and Rubenstein2007). Moreover, adult neurogenesis is region-specific and employs the same factors responsible for neurogenesis in these respective regions during development and adulthood (Hack et al., Reference Hack, Saghatelyan, de Chevigny, Pfeifer, Ashery-Padan and Lledo2005; Kohwi et al., Reference Kohwi, Osumi, Rubenstein and Alvarez-Buylla2005; Merkle et al., Reference Merkle, Mirzadeh and Alvarez-Buylla2007; Brill et al., Reference Brill, Snapyan, Wohlfrom, Ninkovic, Jawerka and Mastick2008, Reference Brill, Ninkovic, Winpenny, Hodge, Ozen and Yang2009). Our findings about a role of HDAC2 in adult, but not embryonic neurogenesis provide therefore the first hint about molecular pathways required specifically in adult, but not embryonic neurogenesis. Such adult neurogenesis-specific pathways have indeed been postulated as neurons integrating into a pre-existing functional network (Ge et al., Reference Ge, Goh, Sailor, Kitabatake, Ming and Song2006, Reference Ge, Pradhan, Ming and Song2007) may have different molecular requirements than neurons differentiating simultaneously during development (Carleton et al., Reference Carleton, Petreanu, Lansford, Alvarez-Buylla and Lledo2003). Thus, the unique requirement of HDAC2 for the maturation of adult generated neurons now provides a basis towards a better understanding of the unique molecular machinery regulating the differentiation and integration of adult generated neurons, a process of obvious relevance also for any attempts to regenerate neurons after brain injury.
ACKNOWLEDGEMENTS
We thank Benedikt Berninger, Marco Canossa, Leanne Godinho for very helpful discussions and comments on the manuscript, Simone Bauer, Tatjana Simon-Ebert and Timucin Öztürk for excellent technical assistance and Alexander Nuber for recent help with the HDAC2 mouse colony.
This work was supported by a grant from the European Community (Integrated Project EuTRACC, grant. no. LSHG-CT-2007-037445), the SFB 596, CIPS and a research professorship fund of LMU Excellent, financial support by the Helmholtz Association in the framework of the ‘Helmholtz Alliance for Mental Health in Ageing Society’, and by the Bayerischer Forschungsverbund ‘ForNeuroCell’.
Statement of interest
None.
Supplementary material
The supplementary material referred to in this article can be found online at journals.cambridge.org/ngb.