


Introduction
Lyme disease (LD) is the most prevalent vector-borne illness in the USA (Schwartz et al., Reference Schwartz, Hinckley, Mead, Hook and Kugeler2017). The US Centers for Disease Control and Prevention estimated that over 300 000 human cases occur annually in the USA (Hinckley et al., Reference Hinckley, Connally, Meek, Johnson, Kemperman, Feldman, White and Mead2014; Nelson et al., Reference Nelson, Saha, Kugeler, Delorey, Shankar, Hinckley and Mead2015). LD in the USA is caused by the spirochete bacteria Borrelia burgdorferi sensu stricto and Borrelia mayonii which are vectored by the blacklegged tick (or deer tick) Ixodes scapularis. LD case numbers are continuing to increase due to the range expansion of I. scapularis (Hamer et al., Reference Hamer, Tsao, Walker and Hickling2010; Khatchikian et al., Reference Khatchikian, Prusinski, Stone, Backenson, Wang, Foley, Seifert, Levy and Brisson2015; Eisen et al., Reference Eisen, Eisen and Beard2016). There is a geographic difference in LD prevalence with a majority of LD cases in the USA (e.g. 95% in 2015) being reported to the CDC from 14 northeastern and northcentral states where LD is considered endemic (Centers for Disease Control and Prevention, 2017). Fewer LD cases are reported in the southeastern and southwestern states although B. burgdorferi has been found in I. scapularis and vertebrate hosts in the south (i.e. states south of 37°N latitude and east of 100°W longitude) (Teltow et al., Reference Teltow, Fournier and Rawlings1991; Kocan et al., Reference Kocan, Mukolwe, Murphy, Barker and Kocan1992; Oliver et al., Reference Oliver, Chandler, Luttrell, James, Stallknecht, McGuire, Hutcheson, Cummins and Lane1993a, Reference Oliver, Chandler, James, Sanders, Hutcheson, Huey, McGuire and Lane1995; Williamson et al., Reference Williamson, Billingsley, Teltow, Seals, Turnbough and Atkinson2010; Feria-Arroyo et al., Reference Feria-Arroyo, Castro-Arellano, Gordillo-Perez, Cavazos, Vargas-Sandoval, Grover, Torres, Medina, de León and Esteve-Gassent2014). Reasons for this geographic difference in LD prevalence are not fully understood. It has been proposed that perhaps the difference in LD prevalence is due in part to variation in the host-seeking behaviour of I. scapularis between these geographical regions (Arsnoe et al., Reference Arsnoe, Hickling, Ginsberg, McElreath and Tsao2015; Arsnoe et al., Reference Arsnoe, Tsao and Hickling2019). The most distinct type of host-seeking behaviour in ticks is called questing, which consists in the stretching out of the tick's forelegs in search of a host to latch onto. Ticks can quest on leaf litter and on understory vegetation and the height at which they quest is variable.
Vertical stratification in questing preferences has been correlated with preferred host or prey abundances in other arthropods. For example, Aedes mosquitoes which prefer mammals reside at low heights compared to Culex which prefers birds and resides higher at canopy level (Mitchell and Rockett, Reference Mitchell and Rockett1979). Similarly, spiders that specialize on prey that fly high build webs that are higher than spiders that specialize on prey that crawl or fly low which build lower webs (Olive, Reference Olive1980).
Ixodes scapularis is a three-host tick meaning it takes one blood meal per developmental stage dropping from the host when replete to moult, after which it finds another host. It is also a host generalist feeding on a wide variety of vertebrate hosts. It is thought that the general trend is for larvae to feed on small vertebrates (i.e. ~46 g or less), for nymphs to feed on medium-sized mammals (i.e. ~5 kg roughly the size of opossums), and for adults to feed on large mammals, mostly deer (Fish and Dowler, Reference Fish and Dowler1989; Keirans et al., Reference Keirans, Hutcheson, Durden and Klompen1996). However, larvae and nymphs can be found on any of those host size categories. In one study in New York, it was shown that 95% of adults feed on white-tailed deer (Wilson et al., Reference Wilson, Litwin, Gavin, Capkanis, Maclean and Spielman1990). Adults commonly feed on white-tailed deer in both the northern and southern USA (Oliver et al., Reference Oliver, Owsley, Hutcheson, James, Chen, Irby, Dotson and McLain1993c). However, the composition and abundance of available hosts for immature ticks between the northern and southern USA differs greatly (Oliver, Reference Oliver1996). For example, there is a more diverse assemblage of mammal (Wilson et al., Reference Wilson, Cole, Nichols and Foster1996; Wilson and Reeder, Reference Wilson and Reeder2005), bird (Macarthur and Macarthur, Reference Macarthur and Macarthur1961) and lizard species, as well as a higher abundance of lizards in the south (Rogers, Reference Rogers1976; Pianka, Reference Pianka1977; Oliver et al., Reference Oliver, Cummins and Joiner1993b). Several studies conducted in the southern USA have shown that lizards are the most frequently and heavily parasitized host of the immature stages of I. scapularis whereas these lizards do not occur in the northern USA or are only found in relatively low abundance (Apperson et al., Reference Apperson, Levine, Evans, Braswell and Heller1993; Oliver et al., Reference Oliver, Cummins and Joiner1993b; Levine et al., Reference Levine, Apperson, Howard, Washburn and Braswell1997; Kollars et al., Reference Kollars, Oliver, Kollars and Durden1999; Durden et al., Reference Durden, Oliver, Banks and Vogel2002). In contrast, mammals are the most frequently and heavily parasitized hosts of the immature stages of I. scapularis in northern states (Piesman and Spielman, Reference Piesman and Spielman1979; Carey et al., Reference Carey, Carey, Main, Krinsky and Sprance1981; Mather et al., Reference Mather, Wilson, Moore, Ribeiro and Spielman1989) and the relatively fewer lizards that were parasitized in the north had a much lower tick burden compared to in the south (Giery and Ostfeld, Reference Giery and Ostfeld2007).
If I. scapularis immatures from northern and southern locations differ in host preference, then they would likely show a tendency (i.e. questing height preferred in the absence of host cues) to quest close to the specific height of their preferred hosts in order to come into contact with those hosts since hosts occur at different heights. In general, the average shoulder heights of lizards are about 1–2 cm, rodents are about 4–5 cm, meso-mammals are about 30–40 cm, and white-tailed deer and humans have shoulder heights of 150 cm or higher (Reid, Reference Reid2006; Powell et al., Reference Powell, Conant and Collins2016). Although ticks can attach to hosts at ground level, they commonly quest up on the vegetation at different heights. Since host abundance and composition varies between the northern and southern USA, it is reasonable to expect differences in questing height tendencies between these regions. Additionally, a very important factor is that environmental conditions differ between these two locations with a higher risk of desiccation in the south for the desiccation prone I. scapularis and this might also influence questing height (Ginsberg et al., Reference Ginsberg, Albert, Acevedo, Dyer, Arsnoe, Tsao, Mather and LeBrun2017). Questing heights that are higher in the north than in the south could result in more ticks coming into contact with humans in northern locations.
It was first shown, using the 16S mitochondrial rRNA gene, that there are two clades of I. scapularis, the ‘American clade’ that extends throughout its entire range, and the ‘Southern clade’ limited to the south (Rich et al., Reference Rich, Caporale, Telford, Kocher, Hartl and Spielman1995). Subsequent studies found that ticks from southern regions were more genetically diverse and basal compared to ticks from northern region ticks (Norris et al., Reference Norris, Klompen, Keirans and Black1996). This suggests that I. scapularis originated from the south and migrated north with subsequent bottlenecks giving rise to two distinct geographic populations (i.e. the northern population and the southern population) (Norris et al., Reference Norris, Klompen, Keirans and Black1996; Van Zee et al., Reference Van Zee, Black, Levin, Goddard, Smith and Piesman2013, Reference Van Zee, Piesman, Hojgaard and Black2015; Sakamoto et al., Reference Sakamoto, Goddard and Rasgon2014; Gulia-Nuss et al., Reference Gulia-Nuss, Nuss, Meyer, Sonenshine, Roe, Waterhouse, Sattelle, de la Fuente, Ribeiro, Megy, Thimmapuram, Miller, Walenz, Koren, Hostetler, Thiagarajan, Joardar, Hannick, Bidwell, Hammond, Young, Zeng, Abrudan, Almeida, Ayllon, Bhide, Bissinger, Bonzon-Kulichenko, Buckingham, Caffrey, Caimano, Croset, Driscoll, Gilbert, Gillespie, Giraldo-Calderon, Grabowski, Jiang, Khalil, Kim, Kocan, Koci, Kuhn, Kurtti, Lees, Lang, Kennedy, Kwon, Perera, Qi, Radolf, Sakamoto, Sanchez-Gracia, Severo, Silverman, Simo, Tojo, Tornador, Van Zee, Vazquez, Vieira, Villar, Wespiser, Yang, Zhu, Arensburger, Pietrantonio, Barker, Shao, Zdobnov, Hauser, Grimmelikhuijzen, Park, Rozas, Benton, Pedra, Nelson, Unger, Tubio, Tu, Robertson, Shumway, Sutton, Wortman, Lawson, Wikel, Nene, Fraser, Collins, Birren, Nelson, Caler and Hill2016). These populations have been identified using a variety of molecular markers (i.e. 12S, 16S, ITS1 and ITS2 mitochondrial rRNA, COI mitochondrial DNA, nuclear genes and SNPs). Importantly, in a common garden experiment, the questing behaviour of the northern and southern populations has been shown to differ according to geographic tick origin regardless of testing location suggesting a genetic basis for the behaviour (Arsnoe et al., Reference Arsnoe, Hickling, Ginsberg, McElreath and Tsao2015).
Another geographic difference in behaviour is that all three stages of I. scapularis are easily collected in the northern USA using flagging and dragging (Falco and Fish, Reference Falco and Fish1992; Diuk-Wasser et al., Reference Diuk-Wasser, Gatewood, Cortinas, Yaremych-Hamer, Tsao, Kitron, Hickling, Brownstein, Walker, Piesman and Fish2006). In contrast, the same collection methods are unsuccessful for the immature stages (i.e. larvae and nymphs) in the southern USA even though they are successful for the adult stage (Diuk-Wasser et al., Reference Diuk-Wasser, Gatewood, Cortinas, Yaremych-Hamer, Tsao, Kitron, Hickling, Brownstein, Walker, Piesman and Fish2006; Goddard and Piesman, Reference Goddard and Piesman2006; Goltz and Goddard, Reference Goltz and Goddard2013). Reasons for this phenomenon are unknown. It has been proposed that southern immature stages must be residing within the leaf litter and thus not likely to be collected using flagging and dragging (Arsnoe et al., Reference Arsnoe, Hickling, Ginsberg, McElreath and Tsao2015; Ginsberg et al., Reference Ginsberg, Albert, Acevedo, Dyer, Arsnoe, Tsao, Mather and LeBrun2017). However, a recent study found that I. scapularis immature stages are not found in leaf litter or soil layers at sampling sites within the southern state of Texas (Tietjen et al., Reference Tietjen, Esteve-Gassent and Medina2019). Thus, perhaps the host-seeking behaviour of these ticks might be influenced by where these ticks are residing.
Ixodes ricinus, the European LD vector, follows a similar host preference pattern as I. scapularis with the adult stage feeding on taller hosts such as deer and the immature stages feeding on smaller vertebrates. In one study, the height at which each life stage quested was correlated with life stage, with larvae questing at lower heights compared to nymphs which also quested lower compared to adults (Mejlon and Jaenson, Reference Mejlon and Jaenson1997). This study follows the ‘host size-dependent questing strategy hypothesis’ which poses that ticks quest at the height of their preferred host (Mejlon and Jaenson, Reference Mejlon and Jaenson1997). Interestingly, studies conducted with two Haemaphysalis tick species also show that questing height is correlated with the body size of their preferred hosts (Tsunoda and Tatsuzawa, Reference Tsunoda and Tatsuzawa2004). Thus, it is not unreasonable to think that behavioural differences between northern and southern I. scapularis could involve differences in average questing height which may reflect variation in host preferences between ticks inhabiting northern and southern regions. If immature ticks in the north prefer relatively tall (e.g. meso-mammals and deer) and anthropophilic (e.g. mice) hosts and immature ticks in the south prefer relatively small and anthropophobic hosts (e.g. lizards), it is likely that ticks in the north are more likely to come into contact with humans than in the southern USA.
The objective of the current study is to compare the questing height tendencies of nymphs and adults from northern and southern I. scapularis populations, collected from field locations in Maryland and Texas, respectively.
Methods
Field collection
All of the ticks used in this study were collected using flagging and dragging (except for southern immature I. scapularis that are rarely collected with this method) which consisted of using a 0.5 m2 white cloth attached to a wooden dowel to flag across the vegetation or using a 1 m2 white cloth attached to a wooden dowel to drag across the leaf litter. All collected ticks were placed into microfuge tubes with holes in the lid for air and mesh cloth underneath the lid to stop ticks from escaping. These tubes were placed in a plastic bag with a wet cloth to create humidity and allowed ticks to be transported to the laboratory where they were kept in an incubator (Bahnson Environmental Specialties, EMCOR Group Inc., Raleigh, NC, USA) at 25 °C and 90% R.H until behaviour assays were completed.
Maryland ticks were collected at the Middle Patuxent Environmental Area (39°12′44.96″N, 76°55′04.94″W), Nymphs in June 2017 and adults in December 2017. All Texas ticks were collected at the Big Thicket National Preserve (30°43′11.63″N, 94°13′34.74″W). Adults were collected in January 2018 but, as discussed in the introduction, since southern nymphs cannot be collected using flagging and dragging, nymphs were collected as engorged larvae from mammals trapped in March and April 2017 and allowed to moult.
Small mammals were trapped using Sherman live traps (model LFATDG; H.B. Sherman Traps Inc., Tallahassee, FL, USA) and meso-mammals were trapped using Tomahawk live traps (model 206.5; Tomahawk Live Trap Inc., Hazelhurst, WI, USA) under the scientific collection permits SPR-1112-1052 issued by Texas Parks and wildlife, and BITH-2015-SCI-0016 issued by United States Department of Interior, National Park Services. Trapped mammals were transported to the Animal Resources and Research facilities at Texas A&M University and maintained in an isolation unit in accordance with Institutional Animal Care and Use Committee (IACUC) guidelines (Animal Use Permit number 2016-0243). Mammals were housed in cages above water trays to allow ticks to finish feeding and drop off where they then could be collected. Trays were checked daily in the morning for 7 days. Engorged ticks were placed into microfuge tubes and transported to the same incubator with the same conditions described for field-collected ticks where they were allowed to moult. After ticks moulted all species were identified using appropriate identification keys (Clifford et al., Reference Clifford, Anastos and Elbl1961; Brinton et al., Reference Brinton, Beck and Allred1965; Keirans and Clifford, Reference Keirans and Clifford1978; Keirans and Litwak, Reference Keirans and Litwak1989; Durden and Keirans, Reference Durden and Keirans1996; Keirans and Durden, Reference Keirans and Durden1998). Voucher specimens of I. scapularis and all the other tick species collected are kept in the Medina laboratory at Texas A&M University. Ixodes scapularis Texas nymphs, obtained as engorged larvae, were selected to be used in this study. All other ticks were collected using flagging and dragging.
Behaviour assays
Behaviour assays for each tick life stage were conducted in the same season at which each life stage is active in nature. Nymphs were tested in the summer of 2017 (in June for Maryland nymphs and in August for Texas nymphs) and adults were tested in the winter (December 2017 in Maryland and January 2018 in Texas). Most experimental groups consisted of 30 ticks except for Texas nymphs for which we were only able to obtain 27. Each individual tick was tested separately, and no individual tick was ever reused in any of the behavioural experiments. To test for potential location bias, two translocation tests were completed. Maryland nymphs were tested in Maryland (n = 30) and in Texas (n = 20), and Texas adults were tested in Texas (n = 30) as well as in Maryland (n = 30). Because of the labour involved in trapping hosts in order to collect engorged larvae to molt into nymphs, only enough Texas nymphs were obtained to be tested in Texas. Unfortunately, Maryland adults were only tested in Maryland and not in Texas. However, location bias tests were conducted for both nymphal and adult life stages, one in each reciprocal location. Thus, we are confident in the validity of our experiment.
Behaviour assay arenas consisted of a 50 cm wooden dowel with a diameter of 7 mm in the centre of a glass Petri dish which was held in place at a 90° angle using a small piece of modelling clay. The Petri dish was filled with a water moat surrounding the modelling clay to keep ticks from escaping (Fig. 1). Wood was selected as the material for the climbing pole as preliminary laboratory trials showed that ticks' behaviour on wooden dowels was comparable to their behaviour on plants from field sites where the ticks were found. Behind the Petri dish was a ruler to measure the height at which ticks quested to the nearest centimetre. A mirror was placed behind the Petri dish to assist with observations of the tick when on the back side of the wooden dowel so that observations could be done from a distance of one-half metre to avoid breathing on ticks. The behaviour assay arena was located on the bench top of the laboratory in order to conduct assays under the same controlled laboratory conditions without any host cues. One tick at a time was placed on the wooden dowel at 0 cm and observed for 15 min. Observation data such as an occurrence of a behaviour, the time it started and the time it stopped, etc., were logged into the behavioural observation program BORIS software v. 4.0.3 (DBios, Torino, Italy) (Friard and Gamba, Reference Friard and Gamba2016). The same exact materials and set up were used in Texas and Maryland. In Texas, the laboratory trials were conducted at a constant temperature of 25 °C and 43% R.H. In Maryland, trials were conducted at a constant room temperature of 25 °C and 34% R.H. Trials were conducted between the hours of 9am and 5pm.
Diagram of behaviour assay arena. Arena consisting of a 50 cm wooden dowel connected to a glass Petri dish using a small piece of modelling clay. Wave lines at bottom denote that there was a water moat at the bottom to keep the tick from escaping and a mirror behind the set up to observe behind the dowel.

Behaviour definitions
For behavioural experiments, questing was defined as a tick with both right and left forelegs outstretched and the other legs remaining motionless for longer than 2 s. Although there may be a difference between a tick questing and a tick just outstretching its forelegs to assess the environmental conditions by using their Haller's organ, there is no way to tell the difference between these two activities and thus we could only record the behaviour we could observe. Once a tick exhibited the defined questing behaviour, the duration of questing and its height on the wooden dowel were recorded. If all legs remained motionless on the dowel or the bottom of the arena for more than 2 s, this was recorded as resting. If the legs were moving for at least 2 s, this was recorded as climbing and the direction (up or down) and the duration of climbing was recorded. On some occasions, the tick would climb using its three pairs of back legs while questing with its forelegs stretched as it climbed, this was recorded as questing while climbing. Again, there is no way to tell the difference between host-seeking behaviour and escape behaviour, thus we could only record the behaviour we could observe. Additional recorded behaviours included falling off of the dowel, crawling around on the clay at the bottom of the arena and ‘hiding’. Hiding behaviour was defined as the tick crawling to the side of the clay, tucking itself there above the water edge and remaining motionless.
Statistical analyses
Differences between questing heights, questing durations, climbing durations and resting durations for individual ticks were examined using the non-parametric Kruskal–Wallis tests. The presence or absence of the ‘hiding behaviour’ was tested using a χ 2 test. Tests were performed using JMP Statistical Analysis Package (SAS Institute Inc., Cary, NC, USA).
Results
Texas nymphs had lower questing heights than Maryland nymphs
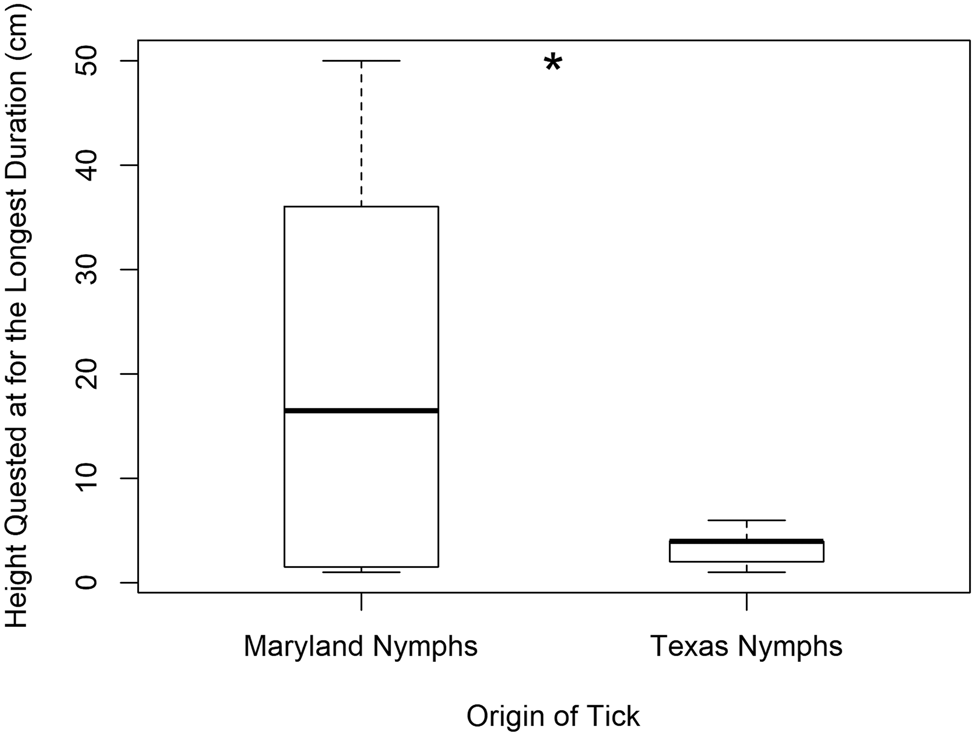
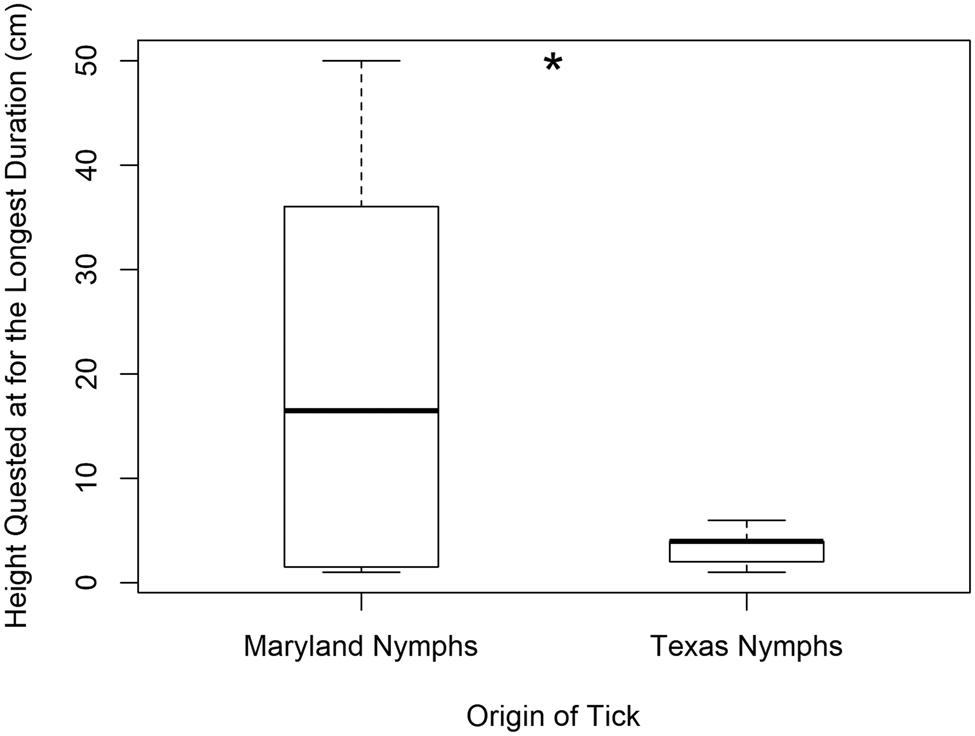
Questing heights of Texas and Maryland nymphs were significantly different with the overall mean questing height (±s.d.) being 3.7 cm (±2.5) and 21.0 cm (±17.5), respectively (H = 12.15, P < 0.001) (d.f. = 1 for this and all following tests). Texas nymphs never quested higher than 10 cm. This was true for the height at which they quested the longest (Texas nymphs 3.3 cm ± 1.6 and Maryland nymphs 20.4 cm ± 18.4) (H = 4.90, P = 0.027) (Fig. 2) and the average questing height per tick (H = 7.06, P = 0.008). However, they did not differ in the first height quested (H = 0.25, P = 0.621) perhaps because Maryland nymphs quest at lower heights before questing again at higher heights. Thus, Maryland nymphs had a wider range of variability in questing height including low and high heights (Fig. 2). Maryland nymphs also climbed for longer durations (520 s ± 318) than Texas nymphs (172 s ± 171) (H = 15.72, P < 0.001). Interestingly, only Texas nymphs exhibited the behaviour we categorized as ‘hiding’ of crawling to the side of the clay, which attached the wooden dowel to the Petri dish, and remaining there motionless (33% of Texas nymphs and 0% of all other categories of ticks tested; x 2 = 11.414, P < 0.001) (Fig. 3).
Box plot showing the heights (cm) at which Texas nymphs (n = 27) and Maryland nymphs quested for the longest duration (n = 30). Boxes represent interquartile ranges (median ± 2 s.d.). Asterisk denotes statistical significance, N.S. denotes no significance.
Thirty-three per cent of Texas nymphs exhibited hiding behaviour and no other group exhibited hiding behaviour. Bar graph showing the amount of ticks tested (dotted bars) and amount of ticks exhibiting hiding behaviour (solid bar).

No difference in questing height between Maryland and Texas adults
Maryland and Texas adults did not differ in any questing behaviour measured with the average questing height for Maryland adults being 21.1 cm (±16.8) and Texas adults being 23.5 cm (±20.5) (H = 1.90, P = 0.168). This also included the height at which the tick quested longest at (Maryland adults 24.2 cm ± 20.5 and Texas adults 27.7 cm ± 23.4) (H = 0.38, P = 0.827) (Fig. 4) and the height first quested (H = 1.19, P = 0.275).
Box plot showing no difference in the heights at which Maryland and Texas adults quested for the longest duration (n = 30 for each). Boxes represent interquartile ranges (median ± 2 s.d.), N.S. denotes no significant.

No difference in questing height between Maryland adults and nymphs
Maryland adults and nymphs did not significantly differ in any questing behaviour measured with the height at which the tick quested longest being 24.2 cm (±20.5) and 20.4 cm (±18.4), respectively (H = 1.92, P = 0.166) (Fig. 5). There was a more diverse range of questing heights for Maryland nymphs, however, the mode for Maryland nymphs was 1 cm compared to Maryland adults which had a mode of 50 cm. The only detected behavioural difference between Maryland nymphs and adults consisted of nymphs climbing for a longer duration (520 s ± 318) than adults (277 s ± 249) (H = 13.94, P < 0.001).
Box plot showing no difference in the heights at which Maryland adults and Maryland nymphs quested at for the longest duration (n = 30 for each). Boxes represent interquartile ranges (median ± 2 s.d.), N.S. denotes no significance.

Texas nymphs had lower questing heights that Texas adults
Lastly, Texas nymphs quested at lower heights compared to Texas adults including first height quested (H = 6.53, P = 0.011), height quested the longest (H = 4.9, P = 0.027) and average questing height (H = 13.34, P < 0.001).
Lack of location bias
Adult ticks from Texas were tested in the laboratory in Texas and in Maryland to make certain that observed behavioural differences were due to place of origin and not testing location. For all questing behaviours measured, there was no statistically significant difference between Texas adults tested in Texas and Texas adults tested in Maryland including height quested at the longest being 27.7 cm (±23.4) and 29.1 cm (±19.4), respectively (H = 0.10, P = 0.752) (Fig. 6). This was also the case for Maryland nymphs tested in Maryland and Maryland nymphs tested in Texas including height quested at the longest being 20.4 cm (±18.4) and 13.9 cm (±16.3), respectively (H = 1.28, P = 0.965) (Fig. 7). Although there was no difference in height quested at the longest and the first height quested for Maryland nymphs when tested in Maryland and in Texas, there was a difference in resting duration which was higher when tested in Texas (221 s ± 210) vs in Maryland 75 s ± 71) (H = 4.09, P = 0.043).
Box plot of location bias test, showing no difference in the heights at which Texas adults tested in Texas compared to Texas adults tested in Maryland quested at for the longest duration (n = 30 for each). Boxes represent interquartile ranges (median ± 2 s.d.), N.S. denotes no significance.

Box plot of location bias test, showing no difference in the heights at which Maryland nymphs tested in Maryland (n = 30) compared to Maryland nymphs tested in Texas (n = 20) quested at for the longest duration. Boxes represent interquartile ranges (median ± 2 s.d.), N.S. denotes no significance.

Discussion
We report that Texas nymphs tend to quest at significantly lower heights compared to Maryland nymphs. This difference in questing height may correspond with differences in host preference. Texas nymphs are likely targeting shorter (i.e. smaller) hosts compared to Maryland nymphs. This difference in host preference might reflect the different composition and abundance of hosts between these two geographic areas. In contrast, there was no significant difference in questing height between Maryland adults and Texas adults. This was to be expected since adults are commonly feeding on white-tailed deer in both locations (Wilson et al., Reference Wilson, Litwin, Gavin, Capkanis, Maclean and Spielman1990; Durden et al., Reference Durden, Luckhart, Mullen and Smith1991). Additionally, there was no significant difference in questing height between Maryland nymphs and Maryland adults. This is not unexpected because nymphs can also feed on deer and it is more common for nymphs to be collected from white-tailed deer in the northern USA than in the southern USA (although not as commonly as adults) (Watson and Anderson, Reference Watson and Anderson1976; Durden et al., Reference Durden, Luckhart, Mullen and Smith1991; Allan et al., Reference Allan, Simmons and Burridge2001). Interestingly, Maryland adults, Texas adults and Maryland nymphs had a wider range of questing heights than Texas nymphs reflecting lower variation in host preference among individual Texas nymphs than among individual adults.
Questing height has been correlated with host height in several other tick species giving rise to the ‘host size-dependent questing strategy hypothesis’ (Mejlon and Jaenson, Reference Mejlon and Jaenson1997). Even though behaviour among individual ticks within the same species may vary significantly, general trends appear when comparing questing heights among tick species that differ in host preference. For example, Haemaphysalis leporispalustris almost exclusively feeds on rabbits and selects positions that correlate with rabbit body height (Camin and Drenner, Reference Camin and Drenner1978). Also, I. pacificus targeting hares and cervids prefers to quest at 25 and 50 cm, heights that correspond with the average heights of their preferred hosts (Loye and Lane, Reference Loye and Lane1988). Similarly, larvae of the one-host tick Dermacentor albipictus, which feeds on larger cervids such as moose, quests at 1–1.5 m (Drew and Samuel, Reference Drew and Samuel1985). Ixodes hirsti larvae in Australia quests at 12.4 cm (Oorebeek et al., Reference Oorebeek, Sharrad and Kleindorfer2009) which correlates with the host thought to be the most preferred by this stage, ground-dwelling birds (Barker and Walker, Reference Barker and Walker2014). Also, Rhipicephalus microplus larvae cluster together at cattle height (Wilkinson, Reference Wilkinson1953).
In addition, several parasite populations are locally adapted to their sympatric hosts and show lower fitness on their allopatric hosts (Blanquart et al., Reference Blanquart, Kaltz, Nuismer and Gandon2013). Thus, it is possible that I. scapularis populations could be adapted to different host compositions throughout their range as observed in our study when comparing questing heights between Maryland and Texas populations. Interestingly, a study examining host preference in laboratory conditions found that larval I. scapularis preferred mice over lizards but in the nymphal stage there was no preference (James and Oliver Jr, Reference James and Oliver1990). Thus, perhaps either of these hosts is acceptable to these ticks but the height at which they quest and the abundance of hosts in their environment ultimately determines which host they attach to, rather than just their preference tendencies observed in choice tests. Nevertheless, in the field, a tick questing at a height corresponding to the height of its most abundant and preferred host may optimize its fitness.
The average questing height and the height at which ticks quested the longest was lower for Texas I. scapularis nymphs compared to Maryland nymphs and Texas nymphs never climbed higher than 10 cm. These lower heights may correlate with the height at which ticks are most likely to encounter hosts in the south. However, Texas nymphs and Maryland nymphs did not show a difference in the first height quested. Ticks in behaviour assays all started at 0 cm and climbed up from there so Maryland nymphs did pass and quested at lower heights before they continued up to quest higher, so this may explain the lack of difference in this variable.
In addition to variation in host composition between these two geographic areas, there are also climate differences. Ticks require high relative humidity for survival and the smaller the life stage the more susceptible they are to desiccation (Needham and Teel, Reference Needham and Teel1991). Relative humidity has been shown to play a role in questing behaviour and survivability for ticks in many studies (Lees, Reference Lees1948; Stafford, Reference Stafford1994; Vail and Smith, Reference Vail and Smith2002; Rodgers et al., Reference Rodgers, Zolnik and Mather2007). Ixodes scapularis has a higher risk of desiccation in the south compared to in the north due to higher temperatures (Ginsberg et al., Reference Ginsberg, Albert, Acevedo, Dyer, Arsnoe, Tsao, Mather and LeBrun2017). Thus, Texas nymphs may tend to quest at lower heights to avoid heat and desiccation stress. Although ticks' questing heights may also be affected by the presence of host cues such as CO2 and kairomones (Falco and Fish, Reference Falco and Fish1991; Carroll et al., Reference Carroll, Klun and Schmidtmann1995; Benoit et al., Reference Benoit, Lopez-Martinez, Philips, Elnitsky, Yoder, Lee and Denlinger2008), the intention of this study was to determine innate questing height tendencies under controlled laboratory conditions. However, we acknowledge that laboratory conditions are different than environmental conditions and our findings need to be taken cautiously for there is the possibility that our findings may not fully translate in the field.
Interestingly, Maryland nymphs spent more time climbing and quested more often than Texas nymphs, suggesting that Maryland nymphs are more active. This corroborates Arsnoe et al. (Reference Arsnoe, Hickling, Ginsberg, McElreath and Tsao2015) and Arsnoe et al. (Reference Arsnoe, Tsao and Hickling2019) reports of northern nymphs being more likely to be observed above the leaf litter and having higher rates of questing compared to southern nymphs. The Arsnoe et al. studies examined the presence and absence of questing under field conditions; thus, our laboratory data further support their field data with the addition of recording the heights at which questing occurred. The current study also observed a behaviour that has not been previously reported in laboratory studies of tick questing that we defined as ‘hiding behaviour’. Only Texas nymphs exhibited hiding behaviour. This behaviour involved the tick crawling to the side of the clay, tucking itself there above the water edge and remaining motionless even without leaf litter or some substrate to ‘hide’ under. This hiding behaviour might be related to Texas nymphs having fewer active behaviours perhaps to avoid desiccation in hotter southern climates and/or to come into contact with lizards that would also be in hidden habitats. Hiding behaviour might partially explain why southern nymphs are not as easily collected through flagging and dragging while northern nymphs are easily collected using these methods.
In a previous study, our group hypothesized that southern populations of I. scapularis may exhibit a mixed host-seeking strategy with adults questing in the open (i.e. non-nidicolous) and immatures residing in their hosts' nests or burrows (i.e. nidicolous) (Tietjen et al., Reference Tietjen, Esteve-Gassent and Medina2019). In the midwestern USA, I. scapularis immatures have been found in mouse burrows after using radio telemetry to find mice nests and sample the nesting substrate (Larson et al., Reference Larson, Lee, Zembsch, Bron and Paskewitz2019). Also, the species of lizards I. scapularis is most often found on (Plestiodon laticeps and P. fasciatus) (Oliver et al., Reference Oliver, Cummins and Joiner1993b; Garvin et al., Reference Garvin, Noden, Dillwith, Fox, Payton and Barker2015) nest in similar habitats to these mice (i.e. downed logs, inside tree trunks and in the ground). Thus, some southern I. scapularis immatures may be nidicolous in both mice and lizard nests. If Texas nymphs are acting as nidicolous ticks, one would expect them to be less active as they would not have the need to actively search for hosts. Also, perhaps the hiding behaviour they exhibit is related to hiding within the nest substrate. It has been documented that nidicolous ticks still exhibit questing behaviour in the nest (Benoit et al., Reference Benoit, Lopez-Martinez, Philips, Elnitsky, Yoder, Lee and Denlinger2008; Godfrey et al., Reference Godfrey, Nelson and Bull2011). Presumably ticks in the nest substrate need to quest in order to latch onto hosts once they are present in the nest. However, it would be easier for ticks to come into contact with these hosts at relatively lower heights as there is limited space in a nest. Thus, nidicolous ticks would not need to climb very high to quest. If the immatures of the southern population of I. scapularis are acting as nidicolous ticks, this might explain why Texas nymphs are questing at lower heights.
We are confident that questing behaviour was due to tick's origin and not testing location. For the most part, the states at which ticks' questing height was tested did not affect their behavioural response except Maryland nymphs tested in Maryland had lower resting durations compared to Maryland nymphs tested in Texas. But this might be due to the loss of energy due to experimental subjects' transportation stress (from Maryland to Texas) and not a reflection of testing location as there was no difference in first questing height, height quested at the longest and total questing duration.
If Texas nymphs are good representatives of southern I. scapularis ticks, their questing at lower heights and their hiding behaviour may make them less likely to come into contact with humans. Thus, contrasting activity levels between northern and southern ticks may have public health implications since more active ticks would be more likely to come into contact with humans. Perhaps this can partially explain the difference in LD incidence between Maryland and Texas, or northern vs southern regions in general. Vector behaviour has been shown to influence pathogen transmission. In fact, vector behaviour is considered a critical component of vector competency (DeFoliart et al., Reference DeFoliart, Grimstad and Watts1987). For example, Anopheline mosquitoes that are vectors of malaria have been shown to differ in their biting patterns, host preference and house-entering behaviour. In one species, Anopheles nuneztovari, cytotype A biting peaks at dusk. But for cytotype B (the most relevant vector cytotype), biting peaks at midnight (Lounibos and Conn, Reference Lounibos and Conn2000). Biting at midnight is thought to be an adaptation for easier access to asleep humans. Also, most malaria vector species rest on walls inside houses after feeding, making residual insecticides a successful option. However, A. darlingi has a type of behavioural insecticide resistance wherein it does not rest on walls but leaves after feeding therefore making these insecticides ineffective against this species for malaria control (Charlwood, Reference Charlwood1996). Similarly, tick surveillance and control methods need to have a clear understanding of tick behaviour in order to improve their effectiveness.
The differential questing behaviour between I. scapularis nymphs has been proposed as explaining geographic variation in LD risk in the eastern USA (Arsnoe et al., Reference Arsnoe, Tsao and Hickling2019). This study provides further support to this hypothesis with evidence of southern I. scapularis nymphs questing at lower heights and demonstrating a newly described hiding behaviour. These behaviours may contribute to the reduced incidence of LD in the southern USA.
Acknowledgements
We would like to thank Annah Lee (Texas A&M University), Jaqueline Matias (Universidade Federal de Mato Grosso do Sul), Jonathan Hernandez (Pennsylvania State University), Grace Hummell (University of Maryland), Patrick Roden-Reynolds (University of Maryland), Carson Coriell (USDA-ARS IIBBL) and Laura Beimfohr (USDA-ARS IIBBL) for help with bioassays and tick collections. We are grateful to Ivan Castro-Arellano (Texas State University), Bradford Westrich (Indiana University), Matthew Milholland (USDA-ARS IIBBL), Joey Martinez (Texas State University) and Michelle Benavidez (Indiana University) for the mammal trapping portion of the study. We would also like to thank The Big Thicket National Preserve U.S. National Park Service and Howard County Maryland Department of Recreation and Parks for providing collection permits.
Financial support
This study was partially funded by the National Institutes of Health (award #: 1R21AI107380-01A1).
Conflict of interest
None.
Ethical standards
The authors assert that all procedures contributing to this work comply with the ethical standards in accordance with Institutional Animal Care and Use Committee (IACUC) guidelines (Animal Use Permit number 2016-0243).