Implications
The study quantifies the huddling behaviour of pigs from thermal images and relates that behaviour to the temperature response to immune challenge. The ability to detect both the temperature and behavioural aspects of febrile responses using algorithms applied to thermal images advances the development of an automated system for the early detection of diseases of swine.
Introduction
Diseases of swine not only impact the health and welfare of animals but can also impact human health and have very significant effect on the costs of production. For example, the H1N1 ‘swine flu’ pandemic of 2009 triggered international alarm and ultimately led to the deaths of over 14 000 people worldwide (Crosier et al., Reference Crosier, McVey and French2015). In terms of the potential impact on production, porcine reproductive and respiratory syndrome caused an estimated annual loss of $664 million to the US breeding and growing pigs herds, and at the level of the individual farm the costs of complete depopulation and repopulation of infected barns was estimated to be between $341 and $483 per sow (Yeske, Reference Yeske2012). The early diagnosis of disease is crucial to mitigating the consequences of disease through improving the efficacy of treatment and by limiting the spread of infectious diseases. Observations of changes in behaviour have long been a mainstay in the recognition of illness in animals.
Hart (Reference Hart1988) reviewed the evidence that the behavioural responses to febrile diseases are not maladaptive, undesirable effects, but instead are behavioural strategies that potentiate the thermal response and are often critical to survival. Behavioural changes typical of illness are lethargy, depression, anorexia, a reduction in grooming and an increase in huddling. In particular, huddling behaviour functions to potentiate the febrile response by conservation of heat. The ability to detect and manage diseases in swine is critical both to animal and human health, and is largely achieved by good husbandry practices by stockpersons and scrutiny by veterinarians. However, the diagnostic efficacy of observational indicators of illness is highly variable and difficult to quantify. In addition, intensively housed livestock operations may involve many thousands of animals, often overseen by a very few number of stockpersons. It is logistically very difficult for those persons to screen livestock for behavioural changes, and it is all too easy to miss signs of illness. Nevertheless, in one respect the increasing scale of intensively housed livestock operations has potential to contribute to the early diagnosis of illness through the adoption of technologies that are capable of the automated monitoring of animal behaviour and performance (Weary et al., Reference Weary, Huzzey and von Keyserlingk2009). An automated assessment of pig activity based on video analysis has been shown to highly correlate with human observations (Ott et al., Reference Ott, Moons, Kashiha, Bahr, Tuyttens, Berckmans and Niewold2014).
Infrared imaging and thermography is the visualization of radiated heat and the measurement of surface temperature from a radiometric image. This technology has the potential to achieve concomitant physiological and behavioural measurements (Cook et al., Reference Cook, Chabot, Liu, Bench and Schaefer2015). Thermography has been shown to detect febrile responses of pigs to inoculation with Actinobacillus pleuropneumoniae (Loughmiller et al., Reference Loughmiller, Spire, Dritz, Fenwick, Hosni and Hogge2001). The radiated temperature measurements of groups of pigs have been reported to be predictive of illness 2 days before mortality within the group (Friendship et al., Reference Friendship, Poljak and McIntosh2009). Thermal images of groups of piglets has been shown to detect febrile responses to vaccination, even when the prevalence of vaccinated animals within the group is as low as 10% (Cook et al., Reference Cook, Chabot, Liu, Bench and Schaefer2015). The temperature variables derived from thermal images of groups of animals are affected by the spatial distribution of the pigs within the images. Pigs that are huddling together exhibit higher radiated temperature, and huddling behaviour has been shown to increase relative to a febrile response to vaccination (Cook et al., Reference Cook, Chabot, Liu, Bench and Schaefer2015). Thus, the increase in radiated temperature in response to vaccination is the combined effect of an increase in metabolic activity that underpins a febrile response, and an increase in huddling behaviour to conserve body heat.
However, this work relied on a manual method of assessing clustering behaviour, which is impractical as a diagnostic tool and cannot be automated. In the present study, pigs in the thermal images were isolated from the background using an algorithm that subtracted the background temperature from that of the pigs. Removing the background leaves thermal ‘blobs’ that may be an individual animal or a group of animals. The numbers of blobs in an image can be automatically counted, together with the size of the blobs and their temperature variables. However, automated blob analysis cannot necessarily distinguish between pigs lying down or standing, or exhibiting huddling behaviour or incidental contact. Thus, the questions addressed in this study are: how accurately does automated blob analysis reflect manual cluster analysis and how does the blob analysis related to febrile responses to immune stimulation? If these relationships are quantifiable it opens the possibility of using automated, thermal-image analysis to measure a combination of physiological and behavioural variables in the same image, and to combine these variables into a diagnostic tool for detection of febrile responses to disease.
Material and methods
Animals and treatments
The study was approved by the Animal Care Committee of the Lacombe Research Centre and animals were cared for in accordance with the guidelines set out by the Canadian Council on Animal Care in Science (2009). Large White Landrace×Duroc newly weaned piglets at 21 to 28 days of age, with a mean (SE) weight of 8.91 (0.22) kg were housed in groups of seven in a pen measuring 6×4 feet with fully slatted flooring. Piglets were provided with ad libitum access to water, crumble feed and an electrolyte solution (Vetoquinol, Lavaltrie, QC, Canada) that contained vitamins and electrolytes for correcting dehydration and electrolyte imbalances during periods of stress such as weaning. Piglets were allowed to acclimatize to the test pen for a minimum of 3 days before recording of thermal images and up to 5 days before vaccination or sham treatment.
Pigs were allocated into one of three treatment groups: vaccination group (Vac), given an intramuscular injection of the three-way vaccine FarrowSure Gold (Zoetis Inc., Kalamazoo, MI, USA); sham group (Sham), given an intramuscular injection of 0.9% saline (2 ml); and control group (Con), given no treatment. FarrowSure Gold is a three-way vaccine for porcine parvovirus, erysipelas caused by Erysipelothrix rhusiopathiae and leptospirosis caused by Leptospira bratislava, Leptospira canicola, Leptospira grippotyphosa, Leptospira hardjo, Leptospira icterohaemorrhagiae and Leptospira pomona. These treatments were applied in revolving order over eight replications with three treatment groups and seven piglets per group, giving a total of 168 piglets used in the study.
Thermal imaging and analysis
A radiometric IR camera (FLIR A320; FLIR Vision Systems, ITM Instruments Inc. Calgary, Alberta, Canada) was mounted in the nursery barn on the ceiling over the piglets’ pen. Ambient air temperature, humidity, emissivity (0.98) and distance (2 m) were entered into the camera settings at the start of each treatment group. When the images were analysed for temperature the ambient air temperature and the radiated background temperature were entered into the analysis software to account for the effect of these variables. Infrared images were recorded for the group of animals at 5-min intervals beginning at 5 min after midnight on the day of treatment (vaccination or sham) for eight replications of the experiment. These images were designated as ‘Vac’ and ‘Sham’, and the equivalent images of the control animals were designated as ‘Con’. In the last four replications of the study, images were recorded over the 24-h period before the application of treatments. Images recorded during these periods were designated as ‘Vac Con’ and ‘Sham Con’. Thus, in the vaccinated group animals were their own controls for the last four replications in the study. The addition of the pre-vaccination day imaging created five groups of images: Con, Sham, Sham Con, Vac and Vac Con, and allowed for comparison of responses within- and between-treatment groups. The total numbers of images recorded for each group were Con=2290, Sham=2106, Sham Con=1095, Vac=2277 and Vac Con=1111.
Image time was expressed as clock time and treatment time. The clock time for each image was recorded, and for analysis purposes was rounded to the nearest 5 min (e.g. 09:32:29 h rounded to 0930 h and 09:32:30 h rounded to 0935 h) in order to make direct comparisons between-treatment groups. Expressing data by clock time provided a means of assessing daily activity, particularly for the control groups. Treatment time was expressed relative to Time 0 which corresponded to the time of administration of the treatments (Vac and Sham). Time 0 for the Con group was taken as the image recorded closest to the Time 0 image in the Vac treatment group for that replication. Expressing data by treatment time provided a means of assessing responses to vaccination.
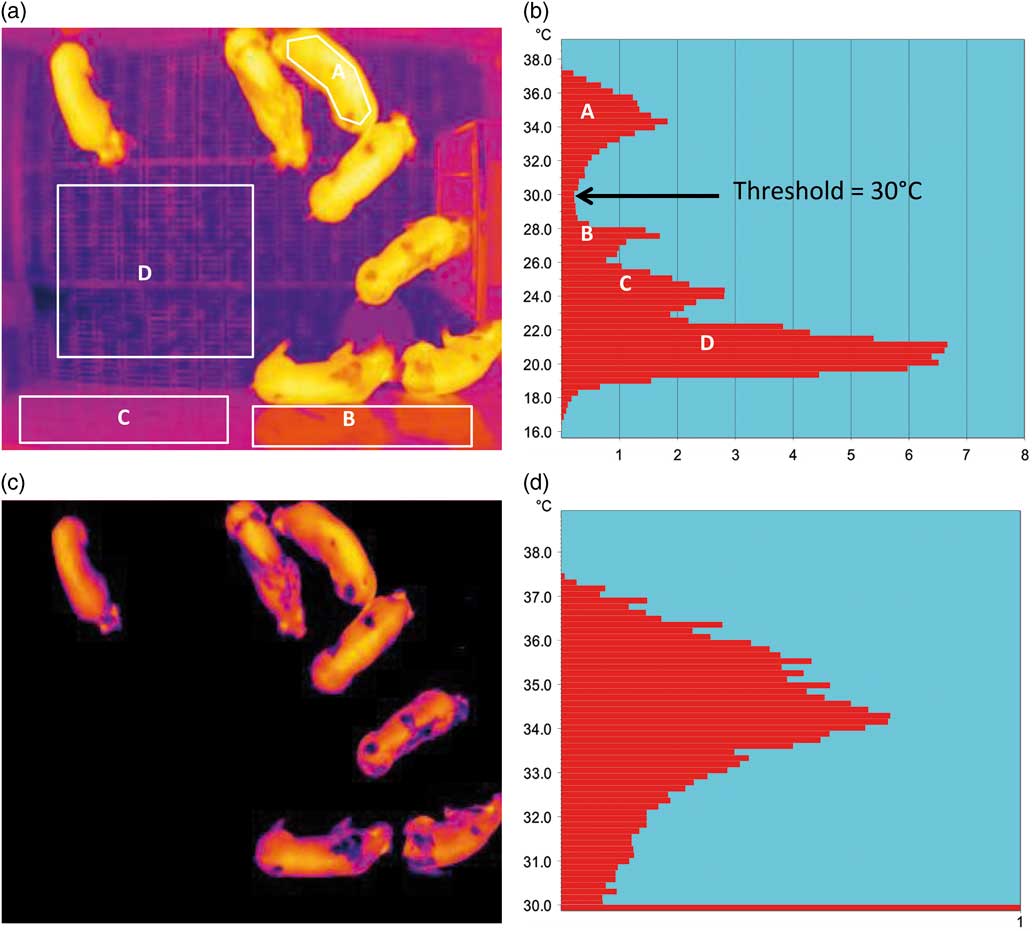
Images were analysed using ThermoCAM Research Pro 2.7 (FLIR Vision Systems), which allowed for temperature measurements of the whole image or parts of the image that were defined by shapes or free drawing tools. The temperature data from thermal images were the minimum, maximum and average temperatures. However, in all images much of the temperature data were obtained from the walls, floor, feeder and electrolyte solution. Moreover, reflected heat off the walls, faeces, urine, mice and other extraneous factors added to the temperature variability. Most of the time these extraneous factors exhibited temperatures that were lower than that of the pigs, and thus by application of a threshold temperature during image analysis these extraneous factors were eliminated. To obtain the threshold temperature an algorithm described by Parker (Reference Parker1997) was applied to each image. The algorithm detected the two highest temperature peaks within the image and the lowest temperature between the highest peaks. The lowest temperature was taken as the threshold value and applied to the image leaving thermal ‘blobs’ on a black background (Figure 1). The algorithm counted the thermal blobs to give a blob score (BS) and calculated the temperature parameters for each of the blobs. The size of each blob in the images was represented by the number of pixels.
Infrared image of a group of pigs and the temperature distributions before and after the application of a threshold temperature of 30°C. (a) infrared image of pigs in pen. (b) temperature distribution of pigs and pen. (c) infrared image above threshold. (d) temperature distribution greater than threshold.

Very rarely heat reflected off the feeder from the overhead heater was recorded as the maximum image temperature. These high temperatures were easily identified as single spikes that stood out against the normal variation in the maximum temperature variable. The images were then manually examined to determine the source of the high temperature. In all instances, images that exhibited abnormally high spikes in temperature (>mean+3 SD) were due to heat reflected off the steel feeder and these images were removed from the data set. A strip of crumpled aluminium foil was placed on the top of the feeder and was clearly visible in all images. The temperature of the aluminium strip was recorded to give a measure of background radiated temperature. A Kestrel 4000 weather meter (Optimum Energy Products, AB, Canada) was mounted above the pen and recorded ambient air temperature (°C), humidity (%) and atmospheric pressure (inHg) every 10 min. Tests of the environmental effects on huddling behaviour were performed on the images irrespective of treatment. The maximum pig temperatures within the different methods of determining huddling behaviour (see below) was calculated only on control images because it was recognized that temperature was increased in vaccinated animals and this would have interfered with the relationship between pig temperature and huddling behaviour. Ambient air temperature was recorded every 10 min and radiated background temperature in each thermal image was taken as the average radiated temperature of the aluminium foil strip placed on the top of the feeder.
Figure 1a shows the whole image and Figure 1b the temperature distribution (temperature (°C)×pixels (%)). Area A is the warmest distribution of temperatures and represents the pigs. Area B is the next warmest distribution and represents reflected radiated heat from the pigs off the walls, and the radiated heat from the overhead heater reflecting off the feeder. Area C represents mostly the walls but also parts of the floor and Area D is mostly the floor. Parker’s algorithm defines each temperature peak in the image and selects the lowest temperature between the two warmest peaks. Applying this threshold isolates the pigs in the image (Figure 1c) and highlights the distribution of temperatures within the pigs only (Figure 1d).
Pig behaviour
Pig behaviour was manually assessed using crude count (CC) and cluster score (CS) systems. The CC was the number of pigs in the largest cluster of pigs and the CS was the number of clusters in the image. If the pigs were individually distributed in the pen, with clear separation between all pigs, than an individual pig was considered to be a ‘cluster’. Two pigs standing in close proximity were considered to be a cluster if at least 50% of their body lengths were in contact and aligned in a straight line, that is nose-to-nose or tail-to-nose. Two pigs aligned in a ‘V’, ‘L’ or ‘T’ shape were considered to be two clusters, unless 50% their body lengths were in contact. Two scorers individually assessed each image using the CS system, while another two scorers assessed each image by the CC method. When the two scores of a method did not match, a third individual coded the image and the scores that matched was the one recorded. For example, if initial scores were CS=6 and CS=5, and a third score gave CS=6 then a score of CS=6 was recorded. There were no instances in which the third independent score did not agree with either one of the first two scores. A total of 8879 images were recorded in which there were matched CS, CC and BS.
In the CC system a CC=1 meant that the largest cluster was one pig, therefore the pigs were individually distributed throughout the image, whereas a CC=7 meant the largest cluster was seven pigs, that is all the pigs were huddled in one cluster. In the CS system if CS=1 then all pigs were grouped into one cluster and where CS=7 all pigs were individually spatially distributed throughout the image, that is the CC and CS scales were in opposition to one another. The spatial distribution of pigs could be different between images with the same CS, giving rise to different CC. For CS=1, 6 and 7, there was only one possible distribution. However, if CS=2, 3, 4 or 5 there could be two or three spatial distributions. For example, in CS=4 pigs could be distributed as 4 : 1 : 1 : 1 or 3 : 2 : 1 : 1 or 2 : 2 : 2 : 1 and the CC would be either 4, 3 or 2. The CS was analogous to the BS. Whereas the CC was analogous to the largest blob in the image determined by the numbers of pixels.
Statistical analyses
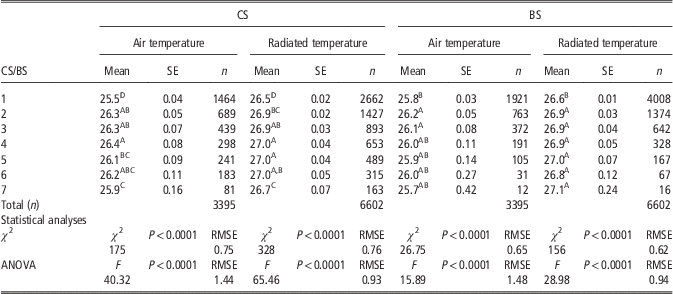
Manual CS and CC were taken as the standards to which BS and largest blob areas were compared. Statistical analysis was done using JMP version 10 (SAS Inst. Inc., Cary, NC, USA). The relationship of CS and BS to ambient air temperature and radiated background temperature were tested using a logistic fit model. In this model the environmental variables, represented as continuous data (temperature), were the X-factor and the ordinal CS and BS categories were the response factor. Logistic fit gives the χ 2 statistic and the associated level of significance, and is analogous to the F ratio in an ANOVA. Similarly, a one-way ANOVA was performed on the same data in which the ordinal CS and BS categories were the X-factors and the environmental variables were the response factors. Differences in mean temperature values between any two scoring categories were tested for significance by Student’s t test. These analyses are presented in Table 1.
Mean (SE) environmental temperature variables within cluster score (CS) and blob score (BS) categories in non-vaccinated animals

A,B,C,DWithin scoring categories mean values not sharing the same superscript letters were significantly different (P<0.05).
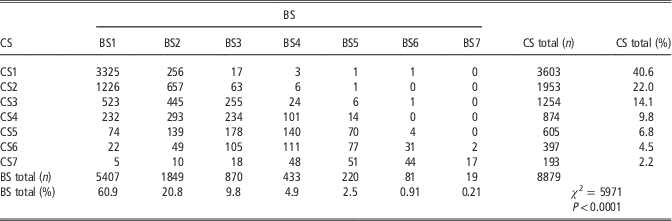
A contingency table (Table 2) was used to express the relationship of CS to BS. Differences in the distribution of images between CS and BS was tested by χ 2 analysis. The standard was considered to be the CS system and therefore the rate of agreement between scoring systems was the number of images in a BS category that matched the same CS category, expressed as a percentage of the total number of images in that BS category. For example, in the BS1 category there was a total of 5407 images and of these 3325 images were also classified as CS1. Thus, the rate of agreement was 3325/5407×100=61.5%. The CS total and BS total columns in Table 2 give the number of images within a category as the percentage of the total number of images, for example there were 3603 images classified as CS1 out of a total of 8879 image (40.6%).
Contingency table of cluster score (CS) and blob score (BS)

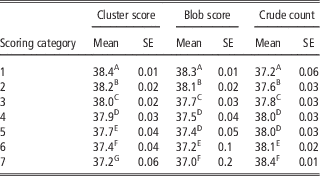
The mean (SE) of the maximum pig temperature for control images within CS, BS and CC categories are given in Table 3. Differences in maximum pig temperature among categories was examined by one-way ANOVA, and post hoc analysis of differences in pig temperatures between individual CS and BS categories was tested by Student’s t test.
Mean (SE) of the maximum pig temperature for control images within scoring categories for clusters, blobs and crude counts

A,B,C,D,E,FWithin scoring methods mean values not sharing the same superscript letters were significantly different (P<0.05).
Image-to-image variation was reduced by taking the hourly average temperature, CC, CS and BS. The effect of vaccination was made on the hourly average of these variables after combining all data from control images. The difference between the vaccinated and control images for CS and BS were tested by Student’s t test.
The febrile and behavioural responses to vaccination were expressed as the difference between time-matched images within animals, that is Vac−Vac Con. The relationships between the maximum pig temperature response parameter to the cluster and blob response parameters were expressed as Pearson correlations.
Results
Environmental effects on pig temperature, cluster and blob scores
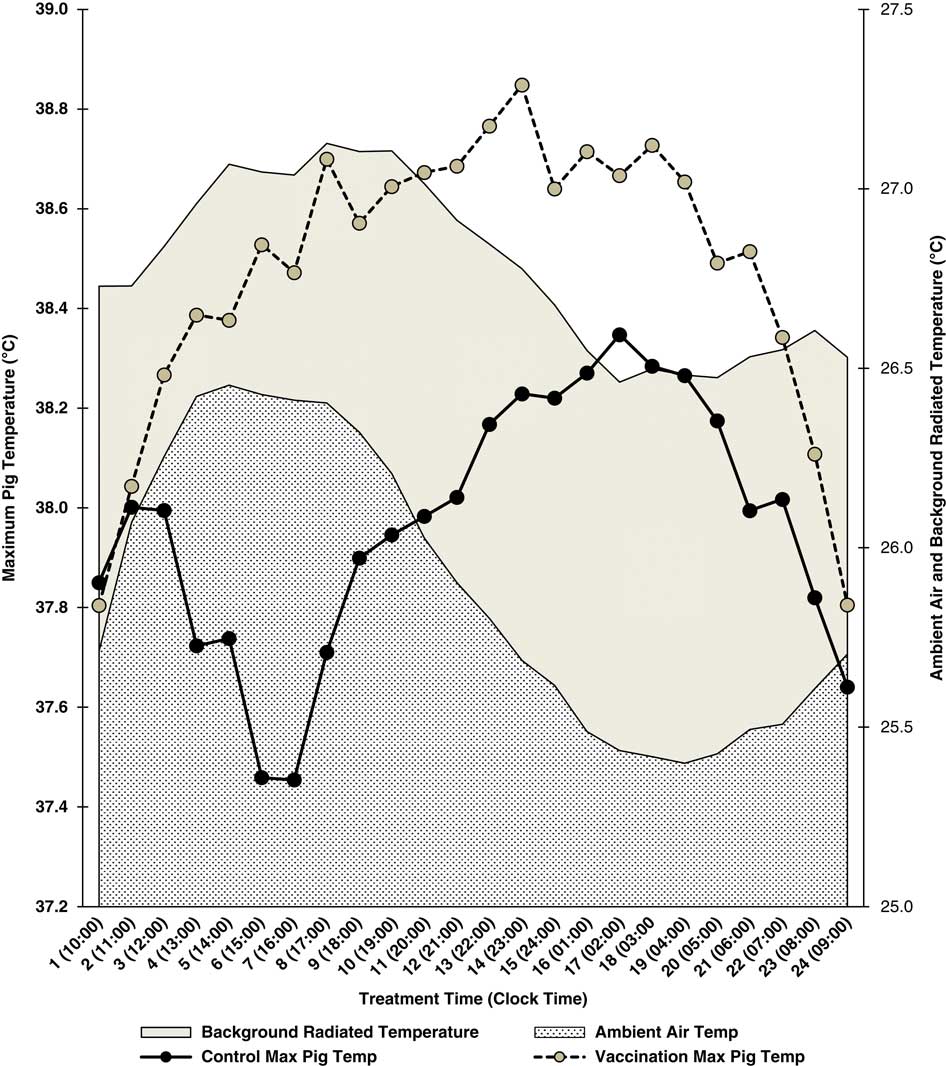
There were a total of 4569 images with matching air, radiated background and maximum pig temperatures. Figure 2 shows the average hourly air and radiated background temperatures by time (h) post-treatment and by clock time. This allows for visualization of the relationship of environmental variables to clock time, and the pigs responses to treatment and clock time. Note that there was not an exact match between treatment and clock times because vaccination was not always given at the same time of day for all replications of the experiment. Vaccination occurred at ~0900±30 min and so the time between 0900 and 1000 h is given as 1000 h for clock time and as 1 h post-vaccination for treatment time.
Mean hourly ambient air temperatures, radiated background temperatures and maximum pig temperatures for control and vaccinated animals relative to treatment time (h) and clock time.

There was a marked circadian variation in both measures of environmental temperature. In Figure 2, ambient air and radiated background temperatures parallel each other and there was a significant correlation between these variables (r=0.71, P<0.0001). In Figure 2, superimposed on the environmental temperature variables are the hourly average maximum pig temperatures for vaccinated animals and for all control animals (Con, Vac Con, Sham and Sham Con). Pearson correlations were performed on the hourly average pig maximum temperature v. the hourly average ambient air temperature and background temperatures shown in Figure 2. There were strong negative correlations between the hourly average maximum temperature in the control pigs with air temperature (r=−0.78) and background radiated temperature (r=−0.72). This is seen in Figure 2 as a trough in the maximum temperature in the control pigs during the afternoon and a peak in the ambient air and radiated background temperatures at approximately the same time. In addition, maximum temperature in the control pigs peaked during the early morning hours, coinciding with a trough in the environmental temperature variables during the same period. The correlations between the maximum pig temperature with air temperature (r=−0.19) and radiated background temperature (r=−0.16) in the vaccinated pigs were much weaker because of the maximum temperature response to vaccination.
The relationship of CS and BS to ambient air and radiated background temperatures were examined by logistic fit analysis and one-way ANOVA. Table 1 gives the mean ambient air temperatures and mean background radiated temperatures within CS and BS categories. The number of measurements differed between the air and radiated background variables because the background radiated temperature was measured in every 5-min image but the air temperature was recorded at 10-min intervals. The χ 2 values from the logistic fit analysis and the F-ratios from the one-way ANOVAs were significant for each of the scoring categories for both measures of environmental temperature. This meant that there were significant differences in temperature between categories within scoring systems. It was noteworthy that the lowest air and background radiated temperatures were recorded in CS1 and BS1 categories. This indicated that more huddling behaviour occurred with lower environmental temperatures. However, this relationship was not consistent across all CS and BS categories. Some of the lowest air and background radiated temperatures were observed in CS7 and BS7 categories, which represented the largest spatial distribution.
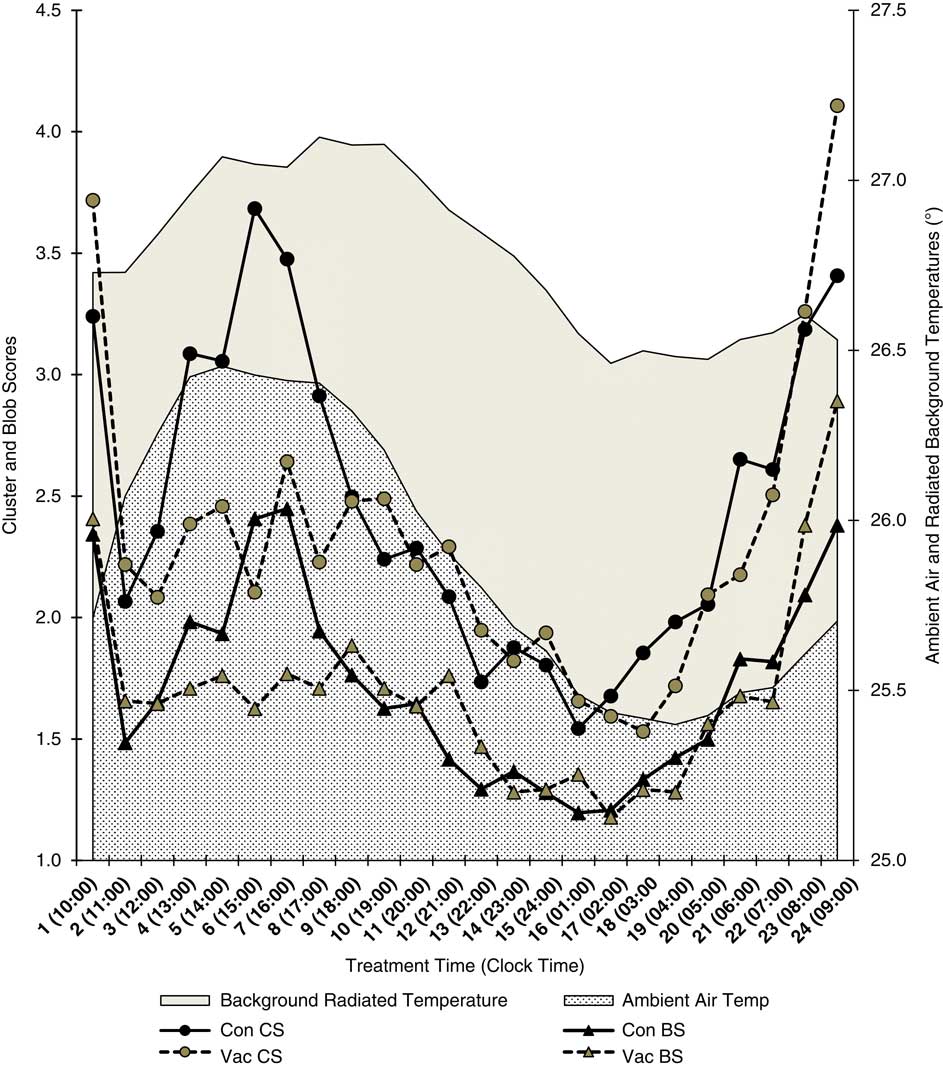
The relationship of huddling behaviour to ambient air and background radiated temperature in control and vaccinated animals is illustrated in Figure 3. Time was expressed as post-treatment time (h) and clock time to permit visualization of the relationships between huddling behaviour to vaccination treatment and environmental variables. Note that there were two peaks in activity in control CS and BS at approximately 1500 and 0900 h but only a single peak in environmental variables at ~1500 h. Thus, although there was a statistic relationship between environmental variables and huddling behaviour this relationship was not a simple causation effect. At times during the day, particularly during the evening and early morning huddling activity appeared to parallel environmental temperatures, but this relationship broke down during the mid-morning peak in activity between approximately 0600 and 1100 h.
Mean hourly ambient air temperatures, radiated background temperatures, cluster and blob scores for controls and vaccinated animals relative to treatment time (h) and clock time.

Huddling behaviour was most common at night. In the CS1 category, 55% of all images (1983 from 3603) occurred during a 10-h period at night between 2000 and 0500 h. A reciprocal observation was made for CS7 images in which 80.3% of all CS7 images occurred during the day between 0800 and 1700 h.
Relationship between cluster and blob scores
A contingency table (Table 2) gives the numbers of images within CS and BS categories and the percentages of CS and BS within each category. There were significant differences between CS and BS for the distribution of images among categories (χ 2=5961, P<0.0001). The rate of agreement (%) was the number of BS images in the equivalent CS category as a percentage of the total number of BS images for that category. Thus, the total number of images in which the BS=CS was 4456 from a total of 8879 images, that is 50.2% agreement. However, the rate of agreement depended on the scoring category. The total number of BS1 images was 5407 and of these 3325 images were in the CS1 category, that is 61.5% of BS1 scores were correctly matched the cluster score (CS1). The lowest percentage of matches (23.3%) occurred for BS4 and the highest (89.5%) was for BS7.
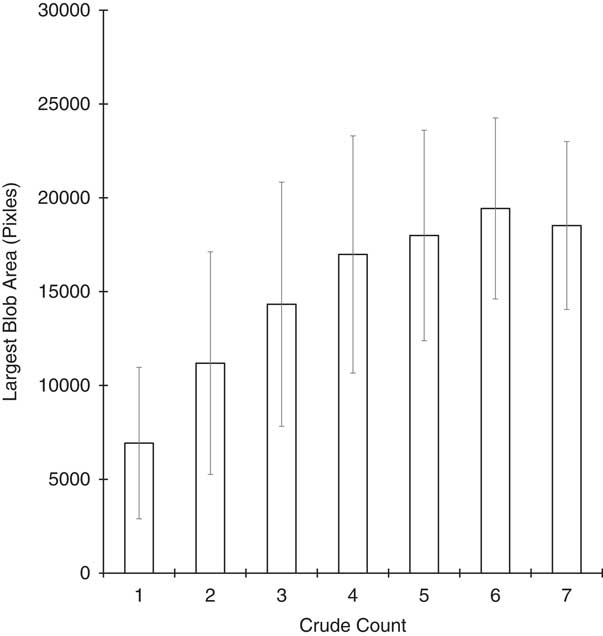
The area (pixels) of the largest blob was assumed to be analogous to the CC. This relationship was analyzed by ANOVA and presented graphically in Figure 4. The relationship between the CC and largest blob area was statistically significant (F ratio=470.8, P<0.0001). Although all group means were significantly different from each other the mean area for CC7 was less than the area for CC6.
Mean (±SD) of largest blob areas within crude counts.

Cluster scores, blob scores, crude counts and the effects on pig temperature
The analysis of the relationship of pig temperature to the methods of assessing huddling behaviour was limited to the maximum pig temperature as this was previously shown to be the most responsive of the radiated temperature variables to vaccination (Cook et al., Reference Cook, Chabot, Liu, Bench and Schaefer2015). Table 3 gives the means (SE) of the maximum temperatures for control images within cluster, blob and CC categories. Images from vaccinated animals were excluded because it was recognized that vaccinated animals exhibited higher radiated temperatures than control animal and their inclusion would interfere in the relationship between huddling behaviour (CS and BS) and pig temperature. A one-way ANOVA of scoring categories and pig temperatures revealed a significant relationship (P<0.0001). The fewer the numbers of clusters or blobs and the more animals there were in the CC the higher the maximum pig temperatures. The most clear-cut association was between CS and maximum pig temperature. In this case, the mean of the maximum temperatures were significantly different between all levels of CS. For BS and CC most temperatures were significantly different between categories with the exceptions of between BS4 and BS5, and between CC4 and CC5.
Effect of vaccination on cluster and blob scores
Image-to-image variation was reduced by taking the hourly average for pig temperatures and each of the huddling measures. The hourly mean values for all variables was calculated for all matching control images, that is combining time-matched images for Con, Sham Con and Vac Con into a single group designated as ‘All Control’. This made for a clearer graphical comparison of the effects of vaccination v. non-vaccination on huddling behaviour. The mean hourly CS and BS by treatment time and clock times are shown in Figure 3. There was a significant reduction in activity, that is lower CS and BS, between 3 and 8 h post-vaccination. The differences in mean CS and BS between All Con and Vac images were not significant over the entire 24-h period but during the period of 3 to 8 h post-vaccination there were significant differences between the Vac and All Control CS and BS (P<0.004 and P<0.02, respectively). In control images there were two periods of greater activity in the morning and afternoon with peaks at approximately 0900 and 1500 h. As vaccination was performed at 0900 h (±30 min) the morning peak was observed in the vaccinated animals. However, the peak in afternoon activity was suppressed because it coincided with the increase in huddling behaviour from approximately 3 to 8 h post-vaccination.
Huddling behaviour and temperature response to vaccination
The relationships between the pig temperature and huddling behaviour were examined by correlation comparisons within-treatment groups. There were significant inverse relationships between maximum pig temperature with CS and BS within each treatment group. Thus, for the Con group the correlations of pig temperature to CS and BS were r=−0.89 and −0.87, respectively. In the Sham group the correlations were r=−0.95 for both CS and BS, and in the Vac group the correlations were r=−0.83 and −0.81, respectively.
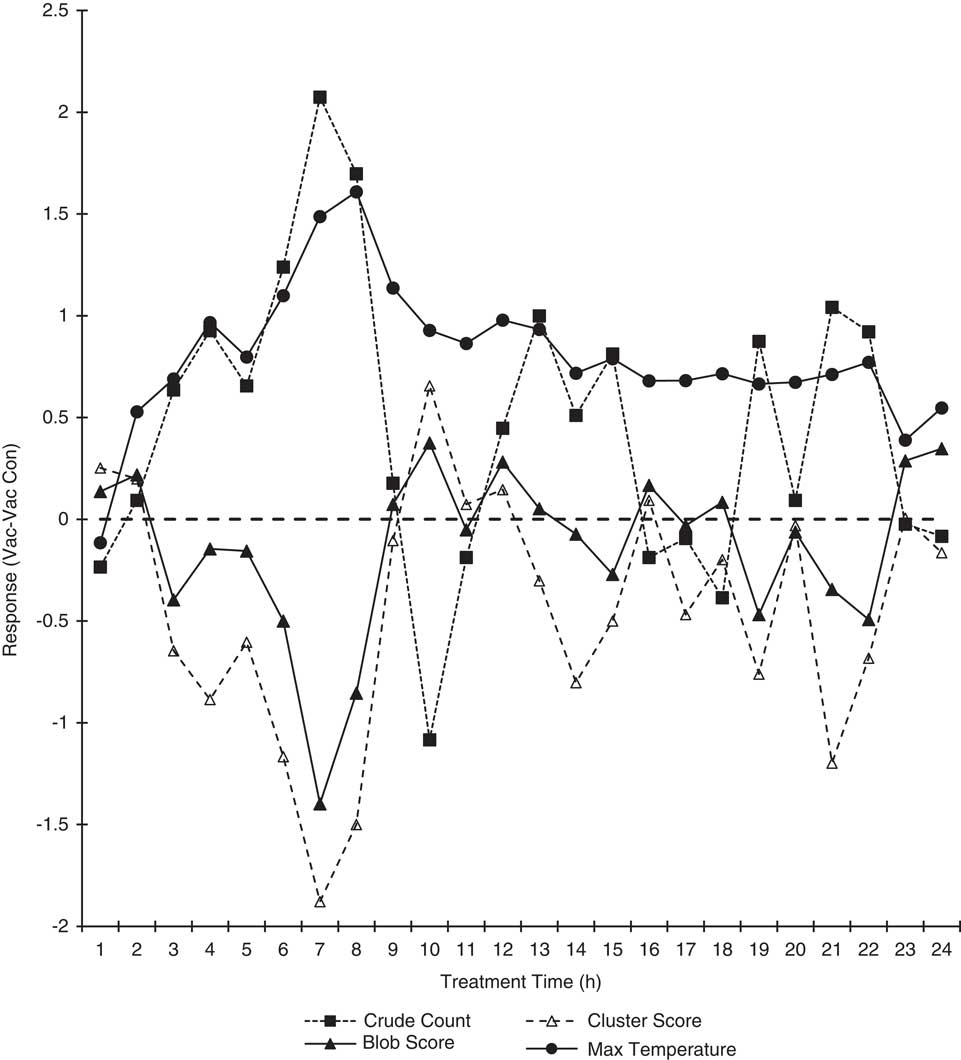
To test the specific effect of vaccination, a response parameter to vaccination was defined as the difference within animal between Vac and Vac Con variables in time-matched images. These response parameters are shown in Figure 5. The response in maximum pig temperature was evident from 2 h post-vaccination to 24 h. The response in CC, CS and BS was evident from approximately 3 to 8 h post-vaccination. The peak temperature response of 1.03°C occurred at 8 h post-vaccination and the peak huddling responses occurred at 7 h post-vaccination. Note that the pattern of responses in the CC and CS were almost mirror images since the scales were in opposition. However, they were not exact opposites and thus one or the other was not a redundant scoring system. Pearson correlation coefficients of the relationship between the temperature response variable and the cluster, blob and CC response variables over the completed 24-h period were r=−0.58, −0.6 and 0.6, respectively.
Response parameters within vaccinated animals for maximum pig temperature, cluster score, blob score and crude counts relative to treatment time (h).

Discussion
The current paper reported on an automated counting method of determining clustering behaviour and compared that method with a manual cluster count, and the changes in huddling behaviour associated with a febrile response to vaccination.
There are probably at least three interacting drivers for huddling behaviour. First, environmental conditions can drive huddling behaviour, with increased huddling under cool conditions and decreased huddling under warm conditions. This effect was noted in the present study as a parallel relationship between CS and BS with environmental variables during the evening and early morning. Spoolder et al. (Reference Spoolder, Aarnink, Vermeer, van Riel and Edwards2012) noted that huddling declined as environmental temperature increased in finishing pigs, and Vasdal et al. (Reference Vasdal, Wheeler and Boe2009) reported that reduced huddling in suckling piglets with an increase in IR temperature. Moreover, Hayne et al. (Reference Hayne, Tennessen and Anderson2000) noted that pigs provided with less straw bedding huddled more than those with greater amounts of bedding when environmental conditions were relatively cold (approximately 5 to 10°C). The relationship between huddling behaviour and ambient temperature is highly dependent on the range in environmental temperatures. Nasirahmadi et al. (Reference Nasirahmadi, Hensel, Edwards and Sturm2017), using an automated visual analysis of spatial distribution of pigs, reported an increase in huddling behaviour between 14 and 18°C, and an increase in spatial distribution between 24 and 28°C. Ekkel et al. (Reference Ekkel, Spoolder, Hulsegge and Hopster2003) noted that calculations of space requirements based on huddling behaviour only applied to thermoneutral conditions as the behaviour would change if the pigs were housed in temperature outside of the thermoneutral zone. Under more extreme conditions there is a greater likelihood of differences in huddling behaviour. It should be noted that in the present study the temperature in the nursery was kept relatively constant at a mean (±SD) of 25.9 (±1.72)°C, and therefore this narrow range had much less influence on huddling behaviour than what has been observed with wider ranges in ambient temperature (Nasirahmadi et al., Reference Nasirahmadi, Hensel, Edwards and Sturm2017).
Sleep patterns driven by the light/dark cycle influence huddling behaviour because pigs tend to huddle to sleep at night. Grower pigs spend 80% to 90% of their time lying inactive (Costa et al., Reference Costa, Ismayilova, Borgonovo, Leroy, Berckmans and Guarino2013), and mostly during the night (Ekkel et al., Reference Ekkel, Spoolder, Hulsegge and Hopster2003). Observations in the present study were that huddling was most prevalent at night, and higher levels of activity were observed during the day. There is an interaction between the light/dark cycle and temperatures because ambient temperatures are lower at night and higher during the day. Thus, there are interactions between sleep patterns, light/dark cycle and ambient temperature that affect huddling behaviour.
The third major driver for huddling behaviour, and the main concern for this paper, is the febrile responses. Febrile responses increase body heat as an adaptive mechanism to infection. Huddling behaviour both ameliorates and maintains the febrile response. In the present study we observed an interaction between environmental conditions and clock time (light/dark cycle) with huddling behaviour that was disrupted by a vaccination-induced febrile response. There were two peaks in daytime activity at approximately 0900 and 1500 h that was observed in all treatment groups with the exception of the vaccinated group. These peaks in activity were distinguishable using both CS and BS methods. Thus, although the absolute numbers in CS and BS differed the patterns in daily activity were almost identically described by both methods. In the period between 3 and 8 h post-vaccination there was an increase in huddling behaviour in the vaccinated animals relative to both the control animals (Figure 3), and relative to their own control images from time-matched images recording during the preceding day (Figure 5). Thus, the increased huddling behaviour in response to vaccination that was observed in both CS and BS systems clearly demonstrated that a febrile response disrupted normal activity by increasing huddling behaviour.
There was no positive associations between environmental temperatures and pig maximum temperatures for either control or vaccinated animals. In fact, there was a strong negative association between pig maximum temperature in control animals and the environmental variables. This meant that control pigs tended to be warmer at times when the air temperature was coolest. The observation was almost certainly due to the narrow limits in the environment temperature in the nursery barn that were maintained throughout the trial. In Figure 2 the mean (±SD) ambient air temperature was 25.9 (±1.72)°C and the mean (±SD) background radiated temperature was 26.77 (±0.97)°C. Thus, the animals were never exposed to temperatures outside of their thermoneutral zone and consequently the environmental temperature had a minimum effect on the radiated temperature of the pigs. The negative association between environment and pig temperature in control animals was due to most clustering activity occurring at night when the environmental temperatures were at their lowest. The relationship between environmental conditions and pig temperature differed in the vaccinated pigs because these animals exhibited a very marked temperature response to treatment.
The agreement between the methods of assessing spatial behaviour (CS v. BS) depended on the complexity of the distributions. In spatial distributions with only one possible arrangement there tended to be good agreement between CS and BS, but in those spatial distributions with two or three possible arrangements there was less agreement. Over all categories the agreement was 50.2% but in CS1 and CS7, in which there is only one possible spatial distribution, the agreement was 61.5% and 89.5%, respectively. Whereas in CS4, in which there were three possible spatial distributions, the agreement was 23.3%. At the ends of the scale there was less chance of misinterpretation by the BS method because there were only one possible distribution of pigs in the clusters, but in the middle of the scale there was a greater chance of disagreement because there were up to three possible distributions. The lowest agreement was for CS4 (23.3%) because many of the BS4 images were classified as CS5 (32.3%), CS6 (25.6%) and CS7 (11.1%). This meant that 69.1% of BS4 images overestimated huddling behaviour, that is they tended to lump together separate clusters. Conversely, there were BS4 images (n=33) that were classified as CS3 or less, that is 7.6% of BS4 images underestimated huddling behaviour.
There were two reasons for the error rates in the BS system relative to the CS. The strongest effect was for the BS to overestimate huddling behaviour, for example BS1 comprised 60.9% of all images whereas CS1 comprised only 40.7%. This was because the computerized method was unable to distinguish between different manifestations of contact between animals. The manual method was governed by a set of rules that defined a cluster and discounted incidental contacts, whereas the computer method could only count blobs. This explains why there were many more BS1 than CS1 images.
The other source of error was derived from the threshold value used to subtract the background and thus isolate the thermal blobs in the automated method. If the threshold value was too low then thermal blobs tended to defuse into one another and separate blobs became joined together. In this case the BS overestimated huddling behaviour. However, if the threshold value was set too high the effect was to break up the thermal blobs into patches of higher temperature. In this scenario pigs that were in contact with each other via anatomical regions that were relatively cold, such as feet and legs, appeared as more than a single blob, that is the BS overestimated the spatial complexity and underestimated huddling behaviour. This scenario occurred much less frequently but explains why there was some cases in which the BS was higher than the CS.
As expected, there was a strong positive relationship between the sizes of the largest blob (pixels) with the number of animals in the largest blob (CC). However, there was an exception to this pattern for CC7 in which the mean area was smaller than for CC6. This could have been a statistical anomaly because there were many more images classified as CC7 (n=26 432) than CC6 (n=7302). Nevertheless, the explanation for this apparent anomaly may lie in the pattern of huddling behaviour and clock time. It appeared as if pigs in the CC7 category were more tightly packed than those in the CC6 category and thus occupied a smaller area. As previously observed, there was more clustering activity at night, coinciding with lower environmental temperature. There was no discernable pattern of CC6 image and clock time, and thus the CC6 clusters were not associated with ambient temperature. These observations suggest that lower temperatures at night encourage sleeping pigs to huddling in a more tightly packed arrangement in order to conserve heat. Whereas sleeping behaviour during the day is not driven by the need to conserve heat and consequently pigs are less tightly packed in their huddle.
Despite the limitations of the BS method to distinguish details of clustering behaviour the method performed well in identifying a relationship to pig temperature measurements. Maximum radiated pig temperature measurements were shown to relate to both methods of assessing spatial arrangement such that higher temperatures were recorded with increased huddling behaviour. The febrile response is metabolically costly and it is generally accepted that a 1°C increase in body temperature requires a 13% increase in metabolic activity (Hart, Reference Hart1988). Although it should be borne in mind that this figure is highly variable across species and depends to a large extent on the size of the animal and the ability to conserve heat. Nevertheless, a behavioural response that accompanies the febrile response and serves to conserve heat can mitigate the energetic costs of an increase in metabolic activity. The febrile response is driven by endogenous pyrogens such as interleukin-1 stimulation of prostaglandins (PG). Anti-pyretic drugs such as aspirin block the action of PGs and reduce fever. However, such drugs may also alter the behavioural response to febrile disease. The inactivity, reduced feed intake and increased body temperature associated with injection of lipopolysaccharide was blocked when pigs were pre-treated with indomethacin, a compound that blocks PGs, demonstrating that behavioural responses were at least partly driven by PGs (Johnson and Von Borell, Reference Johnson and Von Borell1994). Observations regarding the close timing of the pig temperature and behavioural responses to vaccination in the present study are consistent with the hypothesis that both febrile and behavioural responses are cytokine driven. The almost mirror image responses of temperature and huddling behaviour, and the strong correlations between these variables, reflect the role that huddling has on potentiating the febrile response. A related observation of behavioural responses linked to febrile diseases is the increased lethargy, depression, inactivity and increased sleeping. Hart (Reference Hart1988) points out that a common observation in sick animals and humans is increased sleepiness, or a tendency to sleep during normal periods of wakefulness. This observation is consistent with the decrease in activity and increased huddling behaviour exhibited by the vaccinated animals in the present study.
In the vaccinated animals there was an increase in temperature over the 24-h period following vaccination compared with control animals in Figure 2, and for vaccinated animals acting as their own controls (Figure 5). Similarly, huddling behaviour was increased 3 to 8 h post-treatment in vaccinated animals compared with control animals (Figure 3), and for vaccinated animals acting as their own controls (Figure 5). The behavioural response to vaccination effectively eliminated the normal peak in activity that occurred between approximately 1200 and 1700 h for control animals, and this effect was observed for both CS and BS. Again, the strong correlations in the response parameters for maximum pig temperature and the response parameters of huddling behaviour demonstrate the close interrelationship of the physiological and behavioural responses to immune challenge.
Dawkins (Reference Dawkins2004) identified two basic questions with regard to animal welfare. First, are they healthy? Second, do they have what they want? Thermography could be a useful tool to address both questions. First, the images can measure temperature and behavioural responses related to febrile responses, and addresses the question of health status. Second, the images can be used to determine the utilization of available space and spatial distributions, and addresses the question of need. Dawkins (Reference Dawkins2004) predicted that ‘we can look forward in the not-too-distant future to widespread surveillance of the behaviour of animals with automatic recognition of behaviour in zoos, farms and laboratories’. It is debatable if that future has yet arrived but the results of the present study suggest that remote temperature measurement and an automated assessment of huddle behaviour derived from IR images are tools that could be a part of that future. The application of IR thermography for the automated detection of disease states based on temperature and behavioural parameters is currently the subject of at least two current studies in Alberta and Quebec, Canada.
Acknowledgements
The authors thank the staff of the swine unit of the Lacombe Research Centre for the care of the animals used in these studies. The authors also thank the students at the University of Alberta including Caitlyn Erickson, Amy Kachurowski, Natalie May, Leah Quanstrom, Michele Burke and Teryn Gilmet who volunteered their time to code thousands of IR images for huddling behaviour. The study was funded by a grant (2010R066R) from the Alberta Livestock and Meat Agency.