


When lawmakers consider their legislative agendas, they face a choice between introducing broad bills addressing major public policy needs and pushing for particularistic policies to meet the electoral demands of their districts or core constituencies. This decision often sets their policy goals against their political ambitions, forcing them to trade off among the competing priorities that Fenno (Reference Fenno1973, Reference Fenno1978) and Mayhew (Reference Mayhew1974) outline. In making this decision, legislators must consider the structure of their house, the incentives provided by that structure, and their own place in the chamber's power struggles. How they resolve the tension between common policy considerations and personal electoral needs is at the root of legislative action. The aggregation of individual decisions about the mix of legislation that each will pursue has important consequences for the balance of public and particularistic goods that the political system as a whole will produce, analyzed theoretically in Battaglini and Coate (Reference Battaglini and Coate2005); Leblanc, Snyder, and Tripathi (Reference Leblanc, Snyder and Tripathi2000); Lizzeri and Persico (Reference Lizzeri and Persico2001); Lowi (Reference Lowi1964); Volden and Wiseman (Reference Volden and Wiseman2007); and Wilson (Reference Wilson1980).
We focus on one important type of particularistic good that a legislator can provide—a bill tailored specifically to his or her district. In political systems that tie representatives to geographic constituencies, such “district bills” are woven into the fiber of the electoral connection. Yet, identifying and analyzing them is a nontrivial task. Empirically exploring the complex choices that legislators make between introducing broad bills and particularistic legislation requires a research design that features a wide range of political variation occurring under relatively controlled institutional arrangements. One option is to conduct a cross-national comparison with comparative data on bill introductions that are made under a variety of political conditions. Crisp et al. (Reference Crisp, Escobar-Lemmon, Jones, Jones and Taylor-Robinson2004) assess the incentives that lead to particular mixes of parochial and national bills introduced into the legislatures of Argentina, Chile, Colombia, Costa Rica, Honduras, and Venezuela in the late 1980s and 1990s. In this article, we look instead to institutional variation within the United States, turning to the American state legislatures as a laboratory for studying the mix of statewide and district bills.
Although the states represent ideal arenas for considering the interplay of institutional rules, party competition, degrees of professionalism, and the variety of bills, no prior scholarship has compared the prevalence of parochial and broad bills across states. The neglect is due in part to the paucity of available data. Information on the introduction of bills, especially data from many states and many years, requires deep and sustained immersion in original legislative journals. With rare exceptions, these data do not sit in electronic archives or any other preexisting databases waiting to be mined. But the neglect has also been due to the long-standing view that legislators in state houses duplicate the kind of work that the U.S. Congress pursues on a national level. Indeed, Squire and Hamm's (Reference Squire and Hamm2005) comprehensive study identifies this characteristic as perhaps the most important basis of comparison between state legislatures and Congress: “At a macro level the functions and roles that the two sorts of legislative institutions play are the same. . . . With the exception of trade and defense issues, state legislatures and Congress consider the same sorts of legislation regarding taxation, spending, and the like” (2). Other leading state scholars take a similar approach, discussing statewide issues ranging from veterans’ benefits to natural resources to transportation as the major work of state legislators (Jacoby and Schneider Reference Jacoby and Schneider2001) or focusing on budgeting and oversight as the main policy-making areas that deserve study (Moncrief, Thompson, and Cassie Reference Moncrief, Thompson and Cassie1996, 320–1).
Descriptive statistics summarizing our new data set of historical bill introductions, presented in Figures 1 and 2, show that statewide policies are not the only issues taken up in state legislatures. Because American federalism grants each state complete authority over the local governments within it (Frug Reference Frug1980, Reference Frug1999), state legislators devote much of their attention to intervening in local affairs. Figures 1 and 2 are drawn from a data set assembled over the past decade that is unprecedented in its size and sweep. To create this data set, we identified every bill introduced into the lower house of thirteen state legislatures in seven sessions between 1880 and 1997.Footnote 1 In total, our database includes 165,284 distinct bills, each identified from the original journals of these legislatures and coded as Statewide Bills, General Local Government Bills, or District Bills. As we explain, these bills were categorized by a series of research assistants working over the past decade. Registering high levels of intercoder reliability, they distinguished between bills that implemented policy across a state; legislation that broadly affected the operation of local governments in a state; and bills aimed at a particular person, organization, or locality in a specific district.
Variation across Time in Types of Bills Introduced

Variation across States in Types of Bills Introduced

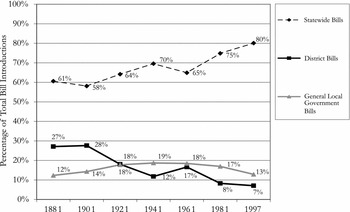
Figure 1 shows that broad bills with a statewide impact have long composed a majority of the business coming before the average state legislature. Even in 1881 and 1901, most legislation in these states dealt with statewide issues, and the number rose throughout the 20th century. That movement came in two eras of expansion: the first between the 1910s and 1930s, and the second between the 1960s and 1980s. Between the Progressive Era and World War II, state legislatures pursued an array of initiatives, developing highway systems, adopting income taxes and sales taxes as major new sources of revenue, introducing regulatory frameworks, organizing state parks, and establishing statewide programs of public assistance and aid to education (Teaford Reference Teaford2002). This explosion of creative activity is visible in Figure 1, as the proportion of statewide bills increased from 58% in 1901 to 70% in 1941. A second era of growth occurred in the 1960s, 1970s, and 1980s. Corresponding with the movement for more professional legislatures, as well as the reapportionment revolution, the proportion of statewide bills increased from 65% in 1961 to 80% in 1997. Clearly, the number of statewide bills has always been significant, and it has grown greater in recent years.
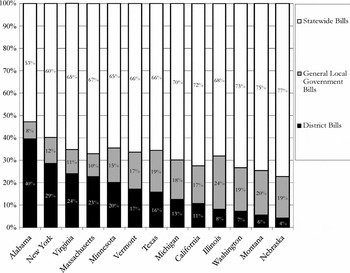
Still, a significant portion of legislative business, today and in the past, has been entirely about local governments. This is a species of legislation that gets little attention in most literature on state legislatures, but it has always been a major component of state legislatures’ workloads. As late as 1961, as Figure 1 shows, one of every three bills dealt with local, rather than state, issues. Indeed, as we begin to examine specific states and years, the press of local legislation at times dominated the work of the legislature. In the 1900–1901 session of the Alabama legislature, for example, 69% of all bills introduced were local bills—and nearly all those bills dealt not with every local government across the state (general local government bills), but with the concerns of specific, named localities (district bills). This was not simply an Alabamian, or a southern, phenomenon. Almost 60% of the bills considered in the New York legislature in 1901 were local bills of some sort, and 53% of all bills were district bills, each affecting a particular local place, such as a certain village or city or county. Nor was this simply an ancient tendency. Of the bills introduced in Massachusetts in 1961, a majority were local bills, and 35% dealt with a specific locality.
The extent to which a legislature devotes its work to these particularistic district bills, rather than to policies with a broad impact, has varied over time and across states. Figure 1 shows that district bills have generally declined as a proportion of all bills introduced over the past century but that the decline has not been constant. State-by-state analysis also demonstrates that it has not been complete. Figure 2 pools data from each of the thirteen states in our sample across time to demonstrate the variation in the mixture of legislative introductions across states over the past 120 years. In Alabama, statewide bills constitute only a bare majority of all bills introduced over this time, whereas 40% of all bills have been district bills. Indeed, in more than half the states we examine, statewide bills have made up less than two thirds of all legislation. New York and Massachusetts, historically boasting two of the nation's most professional legislatures, have long waded through swamps of district legislation. District bills over the past century have constituted 29% of all bills considered in the New York Assembly and 23% of all bills considered in the lower house of the Massachusetts General Court. Meanwhile, district bills have historically been inconspicuous in states as diverse as Nebraska, Montana, Illinois, and Washington, where they have made up less than 10% of all bills since the 1880s.
We are not the first to observe the role of localism in state legislatures. Teaford (Reference Teaford1984, 84) has drawn on historical sources to note that “thousands” of bills that came before state legislatures in the late 19th century were district or “special” bills. Wiltsee (Reference Wiltsee and Scott1956, 19) mentioned the continued press of “local and special legislation” and calculated that one southern state had considered 1,200 such bills in its 1953 session. Burns and Gamm (Reference Burns and Gamm1997, 59) chart the prevalence of local bill introductions in three states from 1871 to 1921, and Hanson (Reference Hanson1998) examines the myriad ways in which state and local governments interact. Our analysis, however, presents a comprehensive view of the prevalence of district legislation across all regions of the United States over more than a century, and for the first time allows us to ask what explains variation in the attention that state legislatures devote to local rather than broad policies.
This article develops and explores hypotheses that explain much of the historical and state-to-state variation in the scope of legislation. As the article progresses, we develop hypotheses rooted in individual incentives and institutional dynamics that generate predictions about how the characteristics of a legislature should determine the relative mix of statewide and district legislation that its members produce.
The variation is not simply a function of professionalism or state population; large states with professional legislatures like those in Massachusetts and New York have produced much district legislation, whereas Illinois has not. Instead, political considerations and party dynamics explain much of the variation in the production of particularistic policy. Consistent with our focus on the factors that give legislators the means and the motivation to craft statewide policy, we find that legislative salaries, state house turnover, and state incomes affect the mix of district and statewide legislation. But our most dramatic finding is the importance of vigorous two-party competition in these states. Analyzing this database, we are able to test V.O. Key's (Reference Key1949) classic argument that two-party politics produces meaningful policies, while one-party states feature factionalized, localized, non-programmatic politics. Key's hypothesis, which has long been difficult to test in a systematic way, is powerfully confirmed in our analysis. Where parties compete on equal terms, we find that statewide issues have an especially prominent place on the legislative agenda. Yet, as the majority party grows more dominant, the proportion of district bills introduced in that legislature rises, and the proportion of statewide bills falls. This finding is strong and robust, present both in the one-party Democratic states that once characterized the South and in the once-Republican (and, more recently, Democratic-dominated) states of the North. Not only is the finding robust across states and party control, but it embraces both historical and contemporary legislatures.
GENERATING HYPOTHESES EXPLAINING PATTERNS IN BILL INTRODUCTIONS
The aggregate phenomenon that we are studying here—the mixture of bills introduced in a session that address statewide, general local government, or district issues—is the product of many individual choices. Each legislator must construct a portfolio of bill introductions that suits his or her needs. Collectively, these add up to the mix of legislation in any session, but our theoretical framework focuses on the incentives and constraints that are likely to guide an individual legislator's decision about what types of bills to introduce.
Why would a legislator introduce a district bill? We argue that this is often the simplest, most direct way of serving constituents. Passing district legislation, or even the mere act of introducing it, sends a clear and transparent signal to voters and the local political establishment that a legislator is looking after their needs. In short, it is action aimed squarely at winning reelection. In this way, bills that address a specific local government, organization, or individual play a role similar to that of “pork” budget items or appropriations measures that deliver state funding to the district. Promoting such distributive policy is often characterized as an electoral activity. A key assumption underlying Weingast's (Reference Weingast1979, 250) model of distributive policy making is that “the representative seeks to be returned to office and his electoral fortunes are related to the benefits he brings home to his district.” Formal work by Herron and Shotts (Reference Herron and Shotts2006, 383) begins with the assumption that “self-interested voters in a collection of districts prefer representatives who deliver pork.” A legislator's incentive to pursue pork is so powerful that it can even form the basis for wider policy achievements, as when committee leaders attach pork projects to broader policy proposals in order to win votes for the package “by satisfying the electoral needs of the rank and file” (Evans Reference Evans1994, 898). Bringing pork home to the district is, first and foremost, an electoral act.
Although very few of the district bills introduced into the state legislatures in our sample contain pork, they bring analogous benefits back to the district and are, we argue, introduced for the same reason.Footnote 2 They address issues that range from the recreational (Minnesota's 1881 S. 53, “A bill for the protection of fish in Lake Hanska,” located in Wantonwan County) to the vital (Virginia's 1981 H.B. 1283, “A bill to amend the acts that created the Norfolk Area Medical Center Authority”). Regardless of their impact, they deliver something that local interests desire. They are almost always introduced by the local representative, and, when they originate from a big city with a large legislative delegation, that delegation is almost always unanimous in supporting them (Burns, Evans, Gamm, and McConnaughy Reference Burns, Evans, Gamm and McConnaughy2009). For these reasons, they should be viewed as akin to distributive policy, pursued for the same electoral reasons. Whether they are successful, these bills are transparent attempts to deliver something to voters, or to the local machines that have, in many places and times, played such a crucial role in determining the political careers of state legislators (Banfield and Wilson Reference Banfield and Wilson1963; Erie Reference Erie1988; Griffith Reference Griffith1974). Like performing constituent service or running a campaign advertisement, introducing a district bill is an electoral activity that should be most attractive to the legislators who place the highest value on ensuring their reelection.
District bills should also, relative to other types of bills, be the easiest pieces of legislation to craft and to move. After running a successful campaign, a legislator knows what his or her district wants out of state government. District issues will be less complex, or at least more familiar, than areas of statewide policy, taking less time to craft and requiring fewer institutional resources. Once a district bill is introduced, it should not be particularly difficult to shepherd through the legislative process, and because it does not affect other legislators (or their districts) directly, it should not spark their opposition or even their close scrutiny. Moving a district bill, then, will rarely require assembling a coalition of legislators across the state who will agree with its aims and twist arms to ensure its passage. Delivering a district bill to the governor's desk can be done with less effort and organization.
In contrast, introducing a bill to shift statewide policy should require more expertise and information-gathering capacity, just as passing it will require tighter coordination with other legislators. Crafting a statewide bill, or one that affects local governments throughout the state, takes a greater investment of time or a higher reserve of institutional knowledge than simply addressing a local problem. Because these types of bills have a broad effect, they are more likely to spark the interest and potential opposition of other legislators; moving them through the legislative process will thus require some coalition-building apparatus. Contrasting them to distributive policies, Weingast (Reference Weingast1994, 320) characterizes the types of regulatory and redistributive programs that are often addressed in statewide legislation as “politically divisive because there are clearly identifiable winners and losers.” Passing them will be no easy task.
Yet, the return on this investment in a statewide or general local government bill can also be much higher than the gains won through introducing district legislation. In addition to furthering a member's reelection ambitions, authoring these broad bills can help advance the broader goals of a legislator spelled out by Fenno (Reference Fenno1973)—enacting policy change and gaining influence within the house. They can deliver electoral gains because the simple act of taking a position on an important issue can help a legislator's standing with voters (Mayhew Reference Mayhew1974). But just as important, they shape policy far beyond the boundaries of a district or local government. If they are successful, this is how a legislator leaves an imprint on policy and makes a mark in a legislature. Their effects can be profound, as in the 1961 New York bill extending the state's rent control law (Int. No. 4973), or apparently minor (as in another New York State bill from 1961, Rec. No. 516, which proposed an amendment to the state's motor vehicle law “in relation to removing or secreting the ignition keys of unattended motor vehicles”). But because other members pay attention to these bills and to their authors, proposing notable statewide policies can build a member's esteem with colleagues. Although bills affecting local governments generally—such as Nebraska's 1981 L.B. No. 66, which governed policy in the state's mosquito abatement districts—may not bring quite as many policy and reputational benefits as bills addressing state policy, they should still contribute more to these legislative ambitions than writing district legislation.
Our expectations about aggregate patterns are guided by this view, on the one hand, of district bills as electoral tools that require little research or coordination, and, on the other hand, of general local government and, especially, statewide bills as more intensive efforts that yield higher reputational and policy payoffs. Individual members’ decisions about which mixture of bills to introduce should depend on their capacity to carry each type of legislation as well as their incentives to pursue policy and reputational rather than purely electoral ambitions. To generate the hypotheses that follow, we make arguments about how a potential explanatory factor should affect a legislator's means or motivation to author different types of bills, and thus shape the mixture of bills introduced in a legislature as a whole.
Party Competition. Our strongest expectation is that the mix of bills introduced in a legislature should depend on whether it features robust two-party competition. Influential scholarship on parties suggests that tighter competition will allow and encourage legislators to develop a statewide program, whereas single-party dominance can lead to an obsession with particularistic bills. V.O. Key's (Reference Key1949) Southern Politics in State and Nation makes it clear that although evenly matched parties have the incentive and ability to develop competing visions of state policy, one-party states such as those he studied in the South descend into regionalism and factionalism. “Factional fluidity and discontinuity probably make a government especially susceptible to individual pressures and especially disposed toward favoritism,” Key (305) writes in Southern Politics. Party-based politics, in contrast, according to Key, should promote “conditions favorable to government according to rule or general principle” (305). As Key suggested, this one-party factionalism could result in atomistic policy making, with little attention to the work of crafting broad legislation. Members of a house dominated by one party might resort to district bills as the only way to differentiate themselves from their copartisans: “In a loose, catch-as-catch-can politics highly unstable coalitions must be held together by whatever means is available. . . . A loose factional system lacks the power to carry out sustained programs of action” (305, 308).
When there is sharp two-party competition, though, opportunities and incentives to focus on statewide rather than district policy can be strengthened. Party ties can provide the links between members that are necessary to make carrying broad bills less costly. Wright and Schaffner's (Reference Wright and Schaffner2002) comparison of floor voting in Kansas with Nebraska's nonpartisan legislature shows that parties structure and align voting behavior, supporting our contention that robust parties will be better able to assemble coalitions for broad policies. Close competition can also increase the electoral payoffs of statewide and general local legislation. Cox and McCubbins's (Reference Cox and McCubbins1993) view of parties suggests that when competition is tightest, legislators will have the greatest personal incentive to build their party's “brand name” by helping to move its statewide program. The implication for our study is that members of evenly matched parties should introduce broad bills to nurture their party's collective reputation.
Using legislative rosters, we have carefully researched the partisan identity of each legislator in these sessions, then compiled the overall party breakdown and calculated the Majority Party Margin, the majority party's margin of control as a percentage of total seats.Footnote 3 This allows us to explore the hypotheses suggested by classic works on parties:
H1. In legislatures with larger majority margins (and thus less party competition), members will introduce more district bills and fewer bills of other types.
Legislative Professionalism. Numerous works in state politics have investigated the results of the vast variation between citizen legislatures and professional bodies in the salaries that they pay, the length of their sessions, and their staff support and other resources (Berry, Berkman, and Schneiderman Reference Berry, Berkman and Schneiderman2000; Carmines Reference Carmines1974; Karnig and Sigelman Reference Karnig and Sigelman1975; LeLoup Reference LeLoup1978; Ritt Reference Ritt1973, Reference Ritt, Welch and Peters1977; Roeder Reference Roeder1979; Squire and Hamm Reference Squire and Hamm2005; Thompson Reference Thompson1986). Because there are no consistent measures of staffing available for the historical sweep of our data set, we focus on salaries and session length and predict that their effects move in opposite directions.Footnote 4
We posit that higher legislative salaries should, by heightening a member's motivation to win reelection, shift the balance of bill introductions toward more district legislation. Many theories about legislatures view the reelection incentive as a constant, an ambition that always and everywhere consumes legislators. Although this may be fitting for the modern Congress, the assumption of a consistent drive to stay in office seems misplaced in state legislatures, where extremely low salaries in some states make office-holding burdensome and lead to frequent voluntary retirements. Very high turnover levels suggest that this was true of the great majority of state legislatures in the past (Burns et al. Reference Burns, Evans, Gamm and McConnaughy2008; Moncrief, Niemi, and Powell Reference Moncrief, Niemi and Powell2004; Niemi and Winsky Reference Niemi and Winsky1987). But even in the modern era, there is tremendous variation in the compensation—including both regular salaries and per diem payments—made to state legislators for their service. In 1997, California's legislators made $106,950 per year, whereas Montana's members received $6,500. Which of these sounds like the better job, worth every effort to keep? Hogan and Hamm (Reference Hogan, Hamm, Thompson and Moncrief1998, 73) find that state legislative candidates raise much more money for campaigns to obtain a seat in high-paying professional legislatures, reasoning that “a seat in such a chamber is probably more prized by candidates” (70), and we reason that they will work harder to keep these hard-won seats. To politicians, we hypothesize, service in a high-paying house is more attractive, which motivates them to devote more of their attention to the district bills that should contribute most directly and efficiently to their reelection efforts. To measure the Salary of Legislators in a manner that is comparable across time and states, we use the ratio of salary (plus per diem) to per capita state income reported in Burns et al. (Reference Burns, Evans, Gamm and McConnaughy2008).
H2. In legislatures with higher salaries, members will introduce more district bills, and fewer addressing statewide and general local government issues.
Another relevant component of legislative professionalism is the length and frequency of legislative sessions. As Squire and Hamm's (Reference Squire and Hamm2005) comprehensive work demonstrates, these vary widely across states and over time. We argue that holding a longer session leads to many more statewide bills, as well as more general local bills, for two reasons. First, a longer session expands the amount of time that members have to work on such relatively complex legislation. In Alabama, where the legislature traditionally met for one fifty-day regular session every four years, the legislative process was rushed and chaotic. “Every man is trying to get through his pet local bill and working for the general bills in which he is interested, and on the legislative days the members hustle and elbow each other about,” the Montgomery Advertiser wrote in an editorial on January 13, 1919, as a new legislative session was about to convene. “Not infrequently some good bills have been trampled to death in one of these stampedes.” When their time constraints are relaxed, legislators are better able to craft bills addressing statewide policy, as well as the bills affecting local governments broadly, which may be a bit more familiar to them if they have served in local office. Kousser's (Reference Kousser2005) analysis of state health care and welfare policies shows that legislatures with longer sessions produced more innovative policies, all else equal, providing evidence of the link between time constraints and policy complexity.
Second, we expect that legislators will also shift their attention away from district bills when longer sessions make them care more about establishing a good reputation within the house. Because it seems likely that members value this reputation more highly when they spend most of the year in the capitol, rather than only a month or two, longer sessions should motivate them to introduce more bills with a broad impact, valuing statewide bills first and general local government bills next. We measure Session Length in “legislative days,” the amount of time that members spend actually meeting in state capitols, taking our data from the various sources described in the appendix to Gamm and Kousser (Reference Gamm and Kousser2007a).
H3. In legislatures with longer sessions, members will introduce many more statewide bills, slightly more general local government bills, and fewer district bills.
Turnover. Over the past century, the legislatures that we study shifted from resembling conventions composed mostly of one-term members to becoming more “well-bounded” institutions (Polsby Reference Polsby1968) with low turnover rates. Whether this shift came through the abandonment of rotation in office norms such as Vermont's “Mountain Rule”Footnote 5 or through other changes in campaign dynamics or institutional incentives, a drop in turnover should shift the priorities of legislators. When members begin to come back to the capitol session after session, they should change from thinking of themselves as district delegates to identifying more closely with the state and its legislature. Their policy priorities will change accordingly as they start to care more about the statewide rather than the district impact of bills. They will also value their influence within the house more when this house is part of their future as well as their present, and as it develops the internal complexity and opportunities for internal advancement that often accompany institutionalization in Congress (Polsby Reference Polsby1968) and in state legislatures (Squire Reference Squire1992). Because district bills do little to further these aims, relatively fewer of them should be introduced in a bounded legislature with low rates of turnover. We gauge Turnover using the method and data in Burns et al. (Reference Burns, Evans, Gamm and McConnaughy2008), which reports the percentage of legislators who have never served in that house before.
H4. In legislatures with higher turnover, members will introduce more district bills and fewer bills of other types.
Large Cities or Small Districts. As we mention, the payoff that a legislator obtains from introducing a district bill will be larger when that locality covers an entire legislative district. This will occur more frequently in states with a large metropolis, like Massachusetts, Illinois, New York, or Michigan, where many legislators come from small sections of large cities such as Boston, Chicago, New York, or Detroit. We identified the biggest city in each state for our time periods using Gibson and Jung (Reference Gibson and Jung2005), recorded its population, and compared this to the population of the state overall (Haines Reference Haines, Carter, Gartner, Haines, Olmstead, Sutch and Wright2006, 1-180–1-365) in order to calculate the Size of Biggest City. Because individual cities and towns will also be more likely to cover entire districts when these districts have small populations, we computed Average District Size by dividing state populations by the total number of lower house seats, taken from legislative rosters.
H5. When a state's biggest city makes up a larger portion of its overall population, legislators will introduce more district bills and fewer bills of other types.
H6. When the average size of legislative districts in a state is larger, legislators will introduce fewer district bills and more bills of other types.
Control Variables. To test these hypotheses, it is important to hold constant the confounding factors that could also influence the mixture of legislation introduced in any state. One important factor that we control for is a legal constraint that should lead to less meddling by state legislators in the business of specific cities. The imposition of an effective Home Rule Provision granted cities autonomy over their affairs. In the absence of such a law, cities and other local governments have been viewed as “creatures of the state,” legally subject to every whim of state authority (McBain Reference McBain1916, 15; see also Frug Reference Frug1980, 1109–13). Much city business has to be conducted in state capitals, but when the enactment of home rule frees cities, it should also free state legislators from introducing as many district bills. Using Krane, Rigos, and Hill (Reference Krane, Rigos and Hill2001), which contains detailed chapters on home rule provisions for every state in our sample, we identified the sessions that were held when a strong home rule provision was in place. Many previous studies have found that Income Per Capita is an important predictor of state policy outputs (Dawson and Robinson Reference Dawson and Robinson1963; Dye Reference Dye1966; Hofferbert Reference Hofferbert1966; Winters Reference Winters1976). We measure income in constant dollars,Footnote 6 and—extending the logic of Desposato's (Reference Desposato2001) study of public goods provision in BrazilFootnote 7 and of Squire and Hamm's (Reference Squire and Hamm2005) work on American state legislative professionalizationFootnote 8—expect that richer states will produce more statewide bills. Finally, although we had little theoretical reason to expect that they would be linked to the mix of legislation in a state, we investigated the effects of a number of demographic variables that could be important controls: population size, population density, the nonwhite population percentage, and the rural population percentage, all taken from Haines (Reference Haines, Carter, Gartner, Haines, Olmstead, Sutch and Wright2006, 1-180–1-365). Because none of them exerted an apparent effect that was larger than its standard error, and because their exclusion did not change the substantive or statistical significance of other variables, we omit these factors in the multivariate analyses presented here.
IDENTIFYING TYPES OF STATE LEGISLATION
The central database for this article—which provides the dependent variable of bill introduction percentages—has been drawn directly from the legislative journals of thirteen states. We selected the states to maximize variation along an array of dimensions: region, urbanization, legislative professionalism and careerism, state incomes, racial and ethnic composition, home rule provisions, state constitutional arrangements, legislative structure, partisan rules of legislative elections and organization, and the date of the state's admission to the Union.Footnote 9 The states we include are Alabama, California, Illinois, Massachusetts, Michigan, Minnesota, Montana, Nebraska, New York, Texas, Vermont, Virginia, and Washington.
For each state, we identified every bill introduced into its lower house for seven different sessions between 1881 and 1997.Footnote 10 In the great number of cases, we studied the regular sessions of 1881, 1901, 1921, 1941, 1961, 1981, and 1997. We made exceptions only when state legislatures did not meet in regular session in one of these seven years. The exceptional years came in Alabama (1880, 1900, 1919, and 1939), Vermont (1880 and 1900), and Virginia (1920, 1942, and 1960). Our universe of bills—our full set of 165,284 bills—consists of every bill introduced into the lower houses, including not only all house bills but also those senate bills that came before the house for consideration.
For nearly every state and year, we needed to turn directly to the legislative journals to count total numbers of bills brought before the lower house. In most cases, house bills were clearly numbered in indexes, and we could easily identify senate bills that came before the house. But, in many other cases, no straightforward indexes exist. Where bills were numbered, but where no numbered bill index exists, we scanned indexes to locate the highest number assigned to a house bill, and then created senate bill indexes from scratch. Where bills were not numbered, we constructed bill indexes based on subject matter and page numbers, or, if we could not find evidence of duplication in the published indexes, we counted each subject entry in the index (after determining that each entry coincided with a specific bill). And where no indexes exist in any form, we counted bills by going through the journal, day by day, building our own page-by-page bill indexes. Whatever method we employed, we closely supervised the research assistants doing this work, and we required that at least two people, working independently, count the bills for each state and year. Our data on total bills, then, was verified, in every instance, by at least two different people.
From this population of 165,284 bills, we classified bills as either local or statewide in their scope. We identified 50,642 bills as local, leaving 114,642 bills as Statewide Bills. For each state and year, we randomly drew samples of approximately 100 local bills,Footnote 11 and then collected comprehensive information related to the bill's introduction, including the title and subject matter of the bill, the identity of its author, and the committee to which it was initially referred. Based on the bill contents, we then categorized each of the 9,378 randomly sampled local bills as being either District Bills or General Local Government Bills.
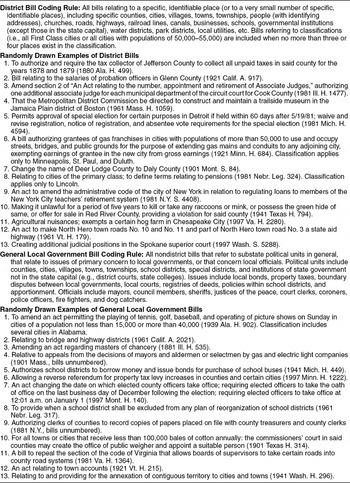
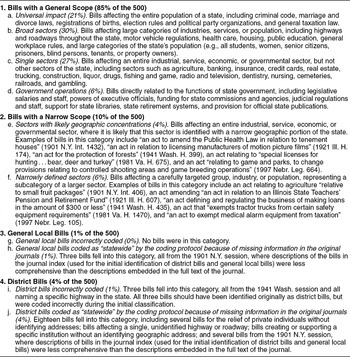
In Table 1, we summarize our coding rules for characterizing bills as either district bills or general local government bills. To do this coding, we developed a nine-page, single-spaced codebook, which guided the researchers doing this work. The codebook includes careful instructions for distinguishing local bills from statewide bills, and then for sorting district bills apart from general local bills. In addition to general rules and guidelines, the codebook offers multiple, concrete examples, along with snippets of early e-mail exchanges among the coders and the principal investigators as they sorted bills that were difficult to code.
Examples of District and General Local Government Bills

Note: We randomly selected one session from each state, and then randomly selected one district and one general local bill from the original sample of bills of these types that were tracked throughout the entire legislative session.
District bills were relatively easy to identify because these bills refer, by name or classification (e.g., “counties of the third class” or “Chicago” or “Berkshire County” or “the county commissioners of Tuscaloosa”), to a specific, geographically distinct, area of the state. For example, one bill in our sample, introduced into the 1880–1881 Alabama legislature (H. 23), was designed “to prohibit the sale, giving away, or otherwise disposing of, spirituous, vinous, or malt liquors within two and one-half miles of the Forest Home (Methodist) church, in Butler county.” A 1981 Minnesota bill (H. 835) provided for the transfer of state-owned land to the city of Hastings, and a 1997 bill introduced into the California Assembly (S. 1376) required “the Great Basin Unified Air Pollution Control District to direct the City of Los Angeles to implement measures in existing law to mitigate the air quality impacts of its activities relating to Owens Lake.” In addition, bills limiting their action to a “class” of governments, where the classification singles out just one local government or a handful of local governments, is also coded as a district bill. In Michigan, following a practice common in many states, the legislature bypassed prohibitions on district legislation by drafting laws that identified cities by population rather than by name, hence a 1941 bill (S. 184) that fixed salaries for probate judges at $6,000 a year in all “counties between 250,000 and 300,000 population.” (Only Oakland County satisfied this population classification.) Table 1 includes randomly drawn examples of district bills, one from each state, along with a summary of guidelines for identifying these bills.
We classified as general local bills those bills that relate to local governments or local affairs, but do not single out a specific local government for attention. These general local bills include bills that deal with units of government beneath the state level, such as cities, towns, villages, municipalities, water districts, school districts, sewerage districts, park districts, counties, and local courts and commissions. But these also include bills that address issues that primarily affect local governments. Thus, we coded bills as “general local government” if they addressed local bonds, property taxes, taxation beneath the state level, intrastate boundaries, local school policy, local government employees, local utilities, local government infrastructure, and government services typically supplied at the local level. Examples include an 1881 bill from the Montana territorial legislature (H. 7) regarding “county sinking funds” and a 1921 Nebraska bill (H. 67) relating to “the establishment of school districts.” In its 1961 session, the Vermont legislature considered a bill (H. 165) authorizing town selectmen “to permit public telephones in public places.” And a 1997 bill introduced into the lower house of the Massachusetts General Court (H. 624) provided for “payments in lieu of taxes to municipalities for certain properties exempt from taxation.” Again, Table 1 includes several examples of general local bills, drawn randomly from our database.
Statewide bills made up the remaining bills in the population. These bills range broadly in subject matter. Our original coding protocol focused entirely on selecting local bills, both district bills and general local bills, so we did not previously examine the content of these statewide bills. To scrutinize the content of this body of legislation, we drew a new sample of 500 statewide bills, random samples of 100 bills taken from each of five legislative sessions. Many of the bills we call “statewide,” we came to realize, may, in fact, have applied to a narrow slice of the state's population—perhaps not one defined geographically, but one that may nevertheless have applied only to a small constituency of people or interests within the state. Scrutinizing these 500 bills, we discovered that the vast majority were, in fact, statewide in scope. Table 2 summarizes our findings. As Table 2 indicates, 85% of the bills in the statewide sample have a general scope—applying to everyone in the state, broad sectors of population or industry (e.g., all roadways, all schools, all labor unions), single sectors (e.g., agriculture, dentistry, construction, pharmaceuticals), or government operations. Although we debated some questions, such as whether health care or education or agriculture represented a broad sector or a single sector, fully 85% of these bills apply, at minimum, to populations and industries with general scope. The next category, bills with a narrow scope, included bills that applied only to subsections of the broader categories (e.g., orthodontists, rather than all dentists; apple growers, rather than everyone in agriculture; bear and deer hunters, rather than all hunters; small lenders, rather than all banks), as well as bills that may have had a geographically concentrated constituency, such as bills affecting the movie industry in Illinois or the tenements of New York. These narrow bills made up 10% of the sample. The remaining 5% was made up of bills that, in retrospect, might better have been classified as district or general local bills. Some were misclassified in error, but most were classified as “statewide” because of missing data in the journals. Although some journals had comprehensive bill descriptions in indexes or bill directories, others had shorter descriptions in their indexes, and fuller descriptions were available only after reading the journal page by page—work that we did for coding local bills in our sample and for examining the sample of 500 statewide bills, but work that was simply not possible at the early stages of sorting bills.
Composition of 500 Bills Identified as “Statewide” Bills

Notes: “Statewide” bills were examined from five different legislative sessions, with 100 bills randomly selected from each of the five sessions (1901 N.Y., 1921 Ill., 1941 Wash., 1981 Va., and 1997 Nebr., the same five sessions selected for the intercoder reliability analysis). After the second team of coders identified all bills in each session as “statewide,” “general local,” or “district” bills, we selected 100 “statewide” bills at random from each of the five sessions, and then collected comprehensive descriptions of each. The authors themselves sorted each bill into the previous categories. Because of rounding, percentages of the subcategories do not always sum to the category percentages.
Throughout this work, we were sensitive to the difficulties of coding bills where classifications were ambiguous. Education bills, for example, proved to be a constant challenge. Where the bills dealt with local school districts, setting policy for districts or imposing requirements on a particular school, we considered the bill local in scope. Where the bill dealt instead with general education policy for the state, we considered it statewide. Bills relating to courts and judicial proceedings also needed to be sorted with care. Where the bill affected the entirety of the state's judiciary or its highest courts, the bill was classified as “statewide,” but where it dealt primarily with district courts or city courts, we termed it “local” in nature. We were keen to examine local government bills separately from statewide bills because of our interest in understanding whether state governments deal with local policy making as they deal with statewide policy making. The codebook, and continuing communication among the researchers, helped maintain consistency in coding decisions.
Because this data set was constructed over the course of a decade by many different researchers working at two universities and on site at archives, it is natural to ask about the reliability of the content coding of our bills. To investigate this, we conducted a recent replication to gauge the level of intercoder reliability. We recoded, in their entirety, all bills heard in five representative legislative sessions, and then compared the results to the work done by earlier teams of coders. As Appendix A shows, using two different metrics, this analysis reveals very high levels of intercoder reliability on both the distinction between statewide and local bills and the subsequent placement of local legislation into “district” and “general local” categories. This analysis demonstrates that our measures capture meaningful categories in a way that can be confidently compared across states and across eras.
EMPIRICAL FINDINGS
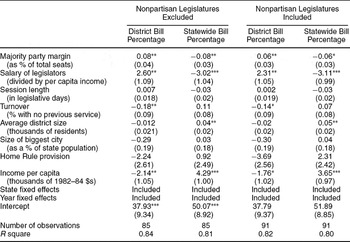
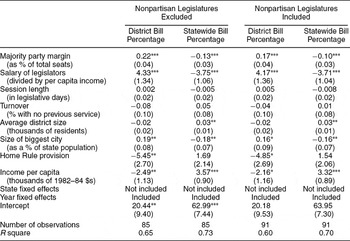
The multivariate models reported in Table 3 use this new data set to test our hypotheses by estimating the effect of each explanatory factor, holding the other factors constant. We show how changes in these factors lead to predicted changes in, first, the percentage of district bills introduced in a session and, second, the percentage of statewide bills introduced. (Because predicted changes in the percentage of general local government bills are determined wholly by the first two estimates, and can be obtained by summing these coefficients and then changing the sign of that sum, we do not report them.)Footnote 12 These are least squares models, which assume that the errors for each prediction are independent and normally distributed.
Explaining Variation in Bill Introductions

Table entries are estimated coefficients (standard errors) from an SUR model, weighted by the total number of bill introductions in an observation.
* Indicates that an estimate is significant at the 90% confidence level in a two-tailed test.
** Indicates that an estimate is significant at the 95% confidence level in a two-tailed test.
*** Indicates that an estimate is significant at the 99% confidence level in a two-tailed test.
We take three steps to help ensure that these assumptions are met. First, we estimate the reported models jointly as “seemingly unrelated” regressions to allow for the fact that our prediction error for district bills in, say, California in 1981 may be correlated with our errors for statewide bills and for general local government bills in that observation. Second, we estimate weighted least squares models, using the number of total bill introductions as our weights because we are more certain about the measures obtained from 10,324 bills introduced in New York in 1981 than we are about measures from Montana's 137 bills introduced in 1881. Third, we include state and year fixed effects to account for the possibilities that our prediction error for Virginia in 1880 may be linked to our error for Virginia in other years or that some unmeasured time trend creates a link between our errors in Illinois, Michigan, and Washington, for instance, in 1961. In Appendix B, we report the results of parallel models that omit state fixed effects and yield substantively similar results.
We report two sets of results here. The first is based on the 85 legislative sessions in which we can record the party affiliations of legislators. It excludes observations from the nonpartisan legislatures in which we cannot measure the majority party's margin of control, one of our key independent variables.Footnote 13 The second model includes these cases by using theory to guide our replacement of the missing data. Because a central finding of Key (Reference Key1949) is that one-party states usually operate like no-party states, we code nonpartisan legislatures as if they were controlled by one party. We fill in a value of 100% for the majority party margin variable in cases with nonpartisan legislatures, incorporating our conjecture that the absence of strong party organizations will leave legislators unable and unmotivated to move a statewide program. Although we recognize that this is not a wholly satisfying characterization of legislatures in which nonpartisan members often caucused along ideological lines, we believe that it is preferable to simply excluding the nonpartisan cases.Footnote 14 Fortunately, the two approaches yield nearly identical results. For brevity's sake, we focus on the second set of results for our full sample when we discuss the direction and strength of our estimated effects.
The findings in Table 3 provide support for three of our hypotheses, which hold up through a number of robustness checks.Footnote 15 The first statistically significant and substantively important effect is that of party competition. Hypothesis H1 states that when the majority party's margin of control is larger, the lack of competition should cause politics to devolve into factionalism, with little emphasis on statewide policy making, resulting in more district bills. Our analysis shows that legislatures dominated by one party indeed produce far more particularistic policies and far fewer statewide bills. Both effects are clearly significant. One way to gauge the scale of the estimated effects of this variable (and others) is to see how much the mix of legislation would change with the move from a case where the level of party competition was one standard deviation below the mean to a case in which it was one standard deviation above average. Shifting a majority margin like New York's in 1961 (when Republicans held a 56%–44% majority) to Vermont's in 1921 (when Republicans held an 88%–8% edge) brings a 4.4 percentage point increase in district bills and a 3.9 percentage point decrease in statewide bills.
Legislative salaries also appear to determine the balance of bill introductions. Higher salaries lead to more district legislation and fewer statewide bills, just as Hypothesis H2 predicts. A look at the shift caused by moving from cases one standard deviation below to one deviation above the mean is again instructive. This would be like shifting from Montana in 1981, where the legislative salary of $2,000 was 0.22 of the state per capita income at the time, to Michigan in 1981, where the $27,000 salary was 2.54 as large as the state income, and holding all other factors constant. Such a shift leads to a predicted 5.4 percentage point increase in district bill introductions and a 7.2 percentage point decrease in statewide bills (as percentages of total bill introductions). This robust empirical finding is consistent with our hypothesis that higher salaries increase reelection incentives, leading members to author more district bills for which they can claim credit in campaigns but which cost them little time to write.
Another aspect of professionalism, session length, does not appear to influence the mixture of bill introductions. Its estimated effect on district bills is minuscule, and its effect on statewide bills falls far short of statistical significance. Although this does not fit with our expectation that session lengths have an impact that runs counter to that of salaries, it suggests that these two components of professionalism have effects worth considering separately.
The last finding that is robust across many empirical approaches provides partial support for Hypothesis H6. When district sizes are larger, legislators introduce a higher percentage of statewide bills. Legislators representing districts containing 96,143 residents (like in Texas in 1981) should produce 4.7 percentage points more statewide bills than those with districts of 1,585 residents (like Vermont's in 1961). This provides only partial support for H6, though, because legislatures with larger districts did not produce significantly fewer district bills.
There is no support, in contrast, for our Hypotheses H4 and H5. Higher turnover rates do not lead to more district bills, and in fact, our first specification indicates that they lead to fewer district bills. This finding, which runs counter to our theoretical expectation, is consistent with Carey et al.'s (Reference Carey, Niemi, Powell and Moncrief2006) analysis of a 50-state survey of legislators to measure the impact of term limits. They show that when the enactment of term limits mandates high levels of turnover, state legislators are more likely to say that they are responsive to the broad needs of the state rather than to the narrow concerns of their district. This “Burkean shift” might predict the empirical link between high rates of turnover and lower rates of district bill introductions that we observe.Footnote 16 We also find, contrary to our expectation, no evidence that the size of the biggest city (relative to state population) affects the mixture of legislation.
The impact of our control variables is mixed. A state's per capita income in constant dollars does seem to shape the content of legislation: legislators from richer states can afford to have more of a statewide focus. In contrast, home rule does not appear to free cities from state interference. We used the case studies in Krane, Rigos, and Hill (Reference Krane, Rigos and Hill2001) to mark the adoption of strong “home rule” laws that might have led state legislators to shift their focus away from local governments and toward statewide issues. Home rule gradually spread across our states over time, but its adoption does not appear to account for the general decline in the percentage of district bill introductions shown in Figure 1. The estimated coefficients on home rule fall short of significance, providing no evidence that states adopting it saw especially sharp declines in local legislation.
Unfortunately, we could not locate a comprehensive data source to investigate the effects of special act chartersFootnote 17 on insulating local governments from state intervention, and we conducted only suggestive interrupted time-series analyses to explore the impact of bill introduction limitsFootnote 18 and multimember districts.Footnote 19 It is also difficult to estimate the effects of malapportionment using our full data set because the one-person, one-vote decisions that began with Baker v. Carr (1962) ensured that this variable would not vary across the states during our last two time periods. But we can look for patterns that support the hypothesis that in malapportioned legislatures that based their districts on geography, rather than population, legislators representing a town or a county would be particularly motivated to introduce district bills. On the eve of Baker, some states in our sample had much higher levels of malapportionment than others. If malapportionment leads to localism, then these states should see the steepest decline in district bill introductions from their heavily malapportioned eras (the 1941 and 1961 sessions, in our data set) to the post-Baker era of equitable apportionment (1981 and 1997). In fact, this is the case. Based on a measure of lower house apportionment in 1960,Footnote 20 the three states that had the highest levels of malapportionment saw district bill introductions drop by 11.4 percentage points over this period, whereas the five states with medium malapportionment experienced a 5.5 percentage point drop and the five states with low malapportionment saw a 4.6 point decline.
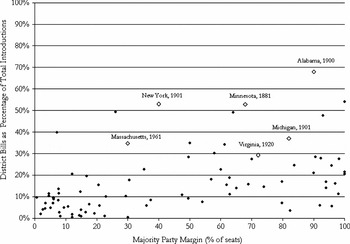
Finally, we illustrate our most striking finding—that party competition opens the door to the development of statewide policies—by presenting the straightforward, bivariate relationship from our data set. Figure 3 plots the link between party competition and the percentage of district bills that are introduced during a legislative session. It shows that when two-party competition is tight—for instance, in cases where the majority's edge is less than 20% of the seats—legislators typically devote only 5% to 15% of their bill introductions to district legislation. However, when one party dominates (a 50% majority margin represents a 75% to 25% edge in the seat share), legislators sometimes devote one third or even one half of bill introductions to district issues. This pattern is not driven solely by the one-party South or sessions taking place just after the “System of 1896” (Burnham Reference Burnham1970; Schattschneider Reference Schattschneider and Neumann1956) either. Labeling some of the sessions that produce this relationship shows that one-party Republican regimes in Michigan, Minnesota, and New York, as well as the 1961 session in Democratic-led Massachusetts, also produced many local bills. The party effect holds in both southern and northern states, as multivariate tests confirm.Footnote 21
Effect of Party Competition on District Legislation

Tracing the history of bill introductions within states also demonstrates the impact of party competition. When the “Solid South” became reasonably competitive, legislators shifted sharply away from district bill introductions. The Democratic Party lost its near-perfect control over the Texas and Virginia state houses between 1961 and 1981, and district bill introductions dropped by 13 percentage points in Texas and 7.7 points in Virginia over this period. The Democratic stranglehold over Alabama's house did not disappear until the 1981 to 1997 period, and that is when its sharp (5.2 percentage point) drop in district bill introductions occurred. To be sure, these declines may simply have been part of the long-term trend toward fewer district bills illustrated in Figure 1. California's history provides a useful natural experiment by breaking the link between the increase in party competition and the passage of time. At the beginning of our period of study in 1881, California's legislature was quite competitive (a party margin of 8%), and only 13.7% of the bills that its members introduced focused on a district. As Republicans began to dominate the legislature by 63% and 90% margins in 1901 and 1921, the district bill percentages rose to 18.9% and then 21.1%. When two-party competition reemerged with a 5% party margin in 1941, district bill introductions dropped to 4.9% of introductions and remained low as the state stayed reasonably competitive there-after.
Overall, these figures show that the level of party competition appears to affect the content of state legislation in dramatic ways, with one-party legislatures more likely to consider district bills and two-party legislatures more inclined to yield bills that promise policy payoffs for the whole state. Our database—made up of tens of thousands of bills introduced over more than a century's time in thirteen states—offers powerful, systematic evidence in support of Key's (Reference Key1949) famous insight.
DISCUSSION
The distinction between district legislation on the one hand and general local government and statewide bills on the other is ultimately the distinction between parochial concerns and broad policies. In explaining variation in the mix of these bills, we are seeking to determine how the incentives of individual legislators and the context in which they operate shape their legislative portfolios. We find support for many of the hypotheses taken from a theoretical framework that focuses on the means and motivations of individual legislators.
Higher salaries, we find, lead legislators to propose higher percentages of district bills. This is fully consistent with our hypothesis, in which electorally motivated legislators, seeking to keep high-paying jobs, work hard to curry favor with their constituents. Constituency size also matters. When legislators represent districts with more residents, they devote more of their time to statewide bills, although not at the expense of introducing district legislation. Most important, we see strong confirmation here of Key's contention regarding a state's party structure. In the absence of vigorous two-party competition, legislators are especially likely to focus on the particularistic and fragmented bills that constitute district legislation. It is in the states where both parties are viable that statewide policy making flourishes. This explains what Alabama and Massachusetts have in common—legislators in both states have always introduced a large proportion of district bills because their houses have traditionally been dominated by a single party. Our quantitative analysis shows that this sort of politics does indeed descend into favoritism and factionalism, as Key (Reference Key1949) observed.
The differences in legislative portfolios that emerge even from the relatively similar political contexts of American states suggest that the mixture of narrow and broad bills deserves further investigation in a broad range of legislatures. To what extent was the nineteenth-century U.S. Congress filled with “private bills” as Sensenbrenner (Reference Sensenbrenner1999) contends, and how was this shaped by fluctuations in the level of party competition? How frequently do bills with a local focus appear in parliaments, and to what extent do electoral rules determine this frequency? Echoing Crisp et al.'s (Reference Crisp, Escobar-Lemmon, Jones, Jones and Taylor-Robinson2004) widely comparative work, this study highlights the importance of seemingly trivial district bills to legislative life and the important lessons that can be learned by studying their prevalence.
APPENDIX A: ANALYSIS OF INTERCODER RELIABILITY
To conduct our analysis of intercoder (also known as “inter-rater”) reliability, two researchers at the University of Rochester in the spring of 2009 used the same archival sources to categorize bills in five sessions, working without access to any of the original coding decisions. Each session was held in a different state and in a different year, with sessions chosen so that this replication would reflect the range of variation in era, in party control, and in legislative professionalism present in our full sample. Just as the original research assistants did, the new coders read summaries of every bill heard on the floor of the lower house to identify statewide legislation and bills that affected local government. They then read bill descriptions for a random sample of approximately 100 of the local government bills to determine whether they were general local government bills or district bills.
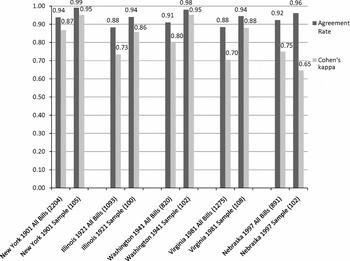
Comparing the original coding decisions to this recent, fully independent, replication reveals a high level of intercoder reliability. The first set of measures that we report uses the basic, intuitive measure of reliability that is recommended in Trochim and Donnelly (Reference Trochim and Donnelly2007, 88)—the rate of agreement between the coders. In Figure A1, we report the percentage of bills that were assigned to the same category by both the original coder and our research assistants working in 2009. In all five sessions and in both of the relevant coding decisions, the level of agreement was high by the conventional standards outlined in Lombard, Snyder-Duch, and Bracken (Reference Lombard, Snyder-Duch and Bracken2002). For instance, in New York's 1901 session, the two new coders read summaries of all 2,204 bills heard on the floor of the lower house and were asked to distinguish statewide bills from those dealing with local issues. They agreed with the original researcher on the coding of 2,066 of these bills, for an agreement rate of 0.94. For the random sample of legislation dealing with local issues, each set of coders had to categorize them as either district bills or general local government bills. They agreed on 104 out of 105, a rate of 0.99. As Figure A1 shows, agreement rates were consistently high, reaching their lowest registered level in the Illinois 1921 session, when coders still agreed about how to categorize the full set of 1,093 bills heard on the house floor 88.3% of the time (for an agreement rate of 0.88).
Measures of Intercoder Reliability, Five Sampled Sessions

Although it is intuitive and used often, the agreement rate can overstate the level of intercoder reliability because it fails to consider how often two coders might reach the same decision due to random chance alone. A well-known measure of reliability that takes this into account is “Cohen's kappa” (Cohen Reference Cohen1960). This coefficient measures how much higher the observed rate of agreement is than the expected rate of agreement due to random chance alone, relative to the expected rate of disagreement due to chance alone. For instance, when coding the full set of 2,204 bills in New York in 1901, our original coder categorized 60.0% of them as local bills and 40.0% as statewide bills, whereas our new coders categorized 63.2% of them as local and 36.8% as statewide bills. Based on these figures, their expected agreement rate due to random chance was 0.53, well short of their observed agreement rate of 0.94. Taking the difference between these two rates and dividing by the expected random error rate yields a Cohen's kappa of (0.94 – 0.53)/0.47 = 0.87. Although there is no clear cut-off for acceptable levels of kappa, Landis and Koch (Reference Landis and Koch1977) consider a kappa between 0.61 and 0.80 as indicating “substantial agreement,” and a kappa of 0.81 or higher as evidence of “almost perfect agreement.”Footnote 22 Because the Cohen's kappa measures 0.65 or higher in all sessions for both of the coding decisions, we are confident that our original research assistants categorized bills in a reliable, consistent manner.
APPENDIX B: MODELS WITHOUT STATE FIXED EFFECTS
In our main text, we present results from multivariate models that take the most conservative approach to estimating the impact of independent variables on bill introductions—models that use both state and year fixed effects. Including state fixed effects holds constant all idiosyncratic characteristics of states that we do not measure with our independent variables. Including year fixed effects holds constant any temporal dynamics that affect all states but are not captured by our variables. Regressions that include both sets of fixed effects draw their causal leverage when some independent variable changes over the course of time in a state, shifting it away from its baseline level in a manner that departs from what is occurring in other states at the same time.
Yet, one drawback of this conservative approach is that including state fixed effects does not allow us to probe the effects of constant characteristics of a state, thus drawing power from purely cross-sectional comparisons. In this appendix, we reestimate the models that we presented in Table 3 of our main text, without state fixed effects. (We retain year fixed effects, again taking the more conservative approach.) Table B1 reports the results of these models, which are consistent with our primary findings in their direction and statistical significance, although they are of higher magnitude. Just as in our main text, these are weighted least squares models estimated jointly as seemingly unrelated regression models. Just as in the main text, we focus our discussion of the findings on the analysis of the full sample, which yield results that are substantively similar to the analysis that is restricted to partisan legislatures.
Explaining Variation in Bill Introductions without State Fixed Effects
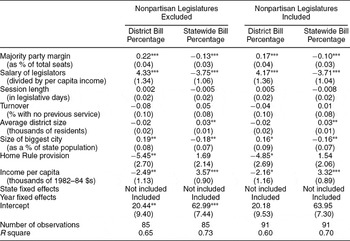
Table entries are estimated coefficients (standard errors) from an SUR model, weighted by the total number of bill introductions in an observation.
* Indicates that an estimate is significant at the 90% confidence level in a two-tailed test.
** Indicates that an estimate is significant at the 95% confidence level in a two-tailed test.
*** Indicates that an estimate is significant at the 99% confidence level in a two-tailed test.
The first statistically significant and substantively important effect is that of the majority party margin. We find that a lack of two-party competition leads legislators to shift their bill introductions in a matter consistent with Hypothesis H1. As the majority party's edge grows larger, a legislature produces more district bills and fewer statewide bills. Both effects are clearly significant at the 99% confidence level. A good way to gauge the scale of the estimated effects of this variable (and others) is to see how much the mix of legislation would change if we moved from a case where the party margin was one standard deviation below the mean to a case where the margin was one standard deviation above average. Shifting from a majority margin like New York's in 1961 (when Republicans held a 56%–44% majority) to Vermont's in 1921 (when Republicans held an 88%–8% edge) brings an 11.9 percentage point increase in district bills and a 6.8 percentage point decrease in statewide bills.
Next, we find that higher salaries lead to more district legislation and fewer statewide bills, just as Hypothesis H2 predicted. A look at the shift caused by moving from cases one standard deviation below to one deviation above the mean is again instructive. This would be like shifting from Montana in 1981, where the legislative salary of $2,000 was 0.22 of the state per capita income at the time, to Michigan in 1981, where the $27,000 salary was 2.54 as large as the state income, and holding all other factors constant. Such a shift leads to a predicted 9.7 percentage point increase in the percentage of district bills introduced and an 8.6 percentage point decrease in statewide bills. This empirical finding is consistent with our hypothesis that higher salaries increase reelection incentives, leading members to author more district bills for which they can claim credit in campaigns.
Another aspect of professionalism, session length, does not appear to have any influence on bill introductions. The estimated effects of this variable are weak and much smaller than their standard errors. The impact that turnover has on the mix of local and statewide bills also falls short of statistical significance. These findings thus provide no support for Hypotheses H3 and H4. Two other explanatory factors do seem to matter, but only in determining the percentage of statewide bills that is introduced. When districts are relatively large, or when the biggest city in a state is relatively small, legislators appear to introduce more statewide legislation. A state's per capita income also seems to be an important influence on the content of legislation—legislators from richer states can afford to have more of a statewide focus.
The finding from Table B1 that deserves the closest attention is that of a Home Rule provision. These models without state fixed effects indicate support (at the 90% confidence level) for the prediction that Home Rule would keep state legislators from authoring as many district bills. The presence of a Home Rule law brings an estimated 4.9 percentage point decrease in district bills. Yet, notice that this effect disappears in the models presented in the main text, when state fixed effects are included. Their inclusion “soaks” up the effect of Home Rule in states that never enact it, meaning that the estimate in Table 1 of the main text conveys the impact of the shift to Home Rule in states that enact it during our study. Based on that analysis, it does not appear that this change in the constraints placed on state legislators affects the sorts of bills that they introduce.



Comments
No Comments have been published for this article.