Introduction
Ethiopia is endowed with varied ecological zones and possesses diverse animal genetic resources (Janke, Reference Janke1983; Workneh, Reference Workneh1992; Alemayehu, Reference Alemayehu1993; Nigatu, Reference Nigatu1994; FARM-Africa, 1996; IBC, 2004; Getnet et al., Reference Getnet, Hegde, Bekele, Enyew and Workneh2005). There is a long history of trade with Arab countries across the Red Sea, with Sudan in the West, Kenya in the south and Somalia in south and southeast. The waves of this trade and physical movement of people and animals have influenced the genetic makeup of domestic livestock, including goats of Ethiopia (Janke, Reference Janke1983; Workneh, Reference Workneh1992; Alemayehu, Reference Alemayehu1993; Nigatu, Reference Nigatu1994; FARM-Africa, 1996; IBC, 2004; Getnet et al., Reference Getnet, Hegde, Bekele, Enyew and Workneh2005). According to CSA (2013) there are about 24.06 million goats in Ethiopia, of which, about 71.06 percent are females and 28.94 percent are males. With respect to breed, almost all of the goats are indigenous breeds, which account about 99.99 percent (CSA, 2013). Characterization of existing goat genetic resources is very important for breed improvement and to design appropriate breeding programme for breeds that have not been adequately characterized either phenotypically and/or genetically (Mwacharo et al., Reference Mwacharo, Okeyo, Kamande and Rege2006). Characterization is essential in breed identification and classification, and the first step of it is assessing variation of morphological traits (Delgado et al., Reference Delgado, Barba, Camacho, Sereno, Martinez and Vega-Pla2001). In Ethiopia, phenotypic characterization done by FARM –Africa long ago in 1996 has shown the presence of 14 goat types and that survey was the first step in breed characterization of Ethiopian goats. On the contrary, genetic characterization done by Alemu (Reference Alemu2004) revealed that the presence of only eight distinctively different breed types in Ethiopia.
Horro Guduru Wollega Zone is one of the geographically well-known pocket areas in the western highlands of Ethiopia and is a home for many phenotypically unique livestock species, which are nationally and internationally recognized. Some of the well-known and phenotypically unique livestock species in this area include the Horro cattle (Mekonnen et al., Reference Mekonnen, Haile, Dessie and Mekasha2012), Horro sheep (Zewdu, Reference Zewdu2008) and more recently unique livestock species such as Horro horses (Kefena et al., Reference Kefena, Dessie, Han, Kurtu, Rosenbom and Beja-Pereira2012) and Horro chicken (Nigussie, Reference Nigussie2011). Interestingly, any casual observer can note that the goat population inhabiting in this unique agro-ecology is phenotypically unique from any other goat populations explored in other parts of the country. However, there is no empirical evidence to substantiate this hypothesis. Therefore, the objective of this study is to phenotypically characterize the indigenous goats in this unique agro-ecological zone of Western Ethiopia and suggest sustainable breeding and conservation programmes to be adopted in the future.
Materials and methods
Description of study area
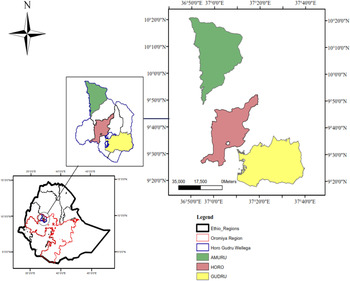
This study was conducted in three districts (Guduru, Horro and Amuru) of Horro Guduru Wollega zone, Western Ethiopia (Figure 1). Horro Guduru Wollega zone is found in the Western part of Ethiopia, 310 km west of Addis Ababa, the capital city of the country and the capital of the zone found 64 km to the North West of the main road from Addis to Nekemte. Horro Guduru Wollega zone is located between 09°29′N and 37°26′E, at an altitude of approximately 2296 m a.s.l, with a uni-modal rainfall ranging between 1200 and 1800 mm (Olana, Reference Olana2006). The rainy season occurs from April to mid-October where maximum rain is received in months of June, July and August. Maximum temperature of 23–27 °C are reached from January to March, and minimum temperature of 7–15 °C are normal from October to November (CSA, 2006).
Map of the study area.

Sampling techniques and sample size determination
From nine districts of the zone, three sample districts were selected purposively based on the presence of relatively large goat population. From each district, three Kebeles (Peasant Associations) were selected because of the relatively large goat population. Sample goats from three kebeles were taken by using simple random sampling method.
The sample size was determined by the formula for phenotypic characterization of livestock for simple random sample (FAO, 2012) as follows.
 $$n = {(z/m)^2}p(1 - p),$$
where z is the z value (e.g. 1.96 for 95 percent confidence level); m is the margin of error, and p is the estimated value for the proportion of the sample that will respond a given way to a survey question.
Based on the above formula, 612 goats (204/district and 68/kebeles) which had one and above pair of permanent incisor (1PPI) were used for body measurements and qualitative trait descriptions. Pregnant females and castrated males were not included in sample goats to avoid inaccuracy for body weight (BW) and linear body measurements (LBMs). Based on FAO (2012), from the total sample size, 10 percent of goats were males, whereas the other 90 percent were females.
Methods of data collection
All data were recorded based on breed morphological characteristics descriptor list of FAO (2012) for phenotypic characterization of goat. Data forheart girth (HG), body length (BL), wither height (WH), rump height (RH), chest depth (CD), shoulder width (SW), pelvic width (PW), ear length (EL), rump length (RL), rump width (RW), horn length (HoL), cannon bone length (CBL), cannon bone circumference (CBC) and head length (HL)) were measured using tailors measuring tape while BW was measured using suspended spring balance. Data were collected for qualitative traits (coat colour pattern, coat colour type, horn presence, horn shape, horn orientation, ear orientation, ruff presence and bear presence) through visual observations.
Statistical data analysis
All data gathered during the study period were coded and recorded. Different types of statistical analysis were used based on the nature of the data. Both qualitative and quantitative data were analysed using Statistical Analysis System (SAS version 9.2, 2008). Chi-square (χ 2) test was carried out to assess the statistical significance among categorical variables (qualitative variables). Multiple correspondence analyses were carried out for variables which were significant by χ 2 and fisher test to show the association among different categories of qualitative traits. General linear model procedure (PROC GLM) of SAS was used to identify district, sex and age group effect on quantitative traits. Tukey's comparison test was used to compare the sub factor brought significant difference.
 $${y_{ijk}} = \mu + {A_i} + {S_j} + {D_k} + {e_{ijk}},$$
where
y ijk , the observation of BW and LBMs excluding scrotum circumference in the ith age group, jth sex and kth district; μ, overall mean; A i , the effect of ith age group (i = one pair of permanent incisors, two pairs of permanent incisors, three pairs of permanent incisors, four pairs of permanent incisors); S j is the effect of jth sex (j = female, male); D k is the effect of kth district (k = Guduru, Amuru, Horro), and e ijk is the random residual error.
To estimate BW from LBMs, the maximum adjusted R 2 method of SAS (2008) was used. The small sample size of bucks in this study may decrease the accuracy of the result if separate age groups were used. Thus, instead of using separate equation for different age groups, it seems logical to pool age groups of male and female goats separately. Stepwise procedures were used to screen out the best fitted model. In the first step, all LBMs were entered together into the model for each sex and a group of variables having the maximum adjusted R 2 and minimum MSE were selected. In addition, Akaike's information criteria (AIC), the mallow's parameters C (P), Schwarz Bayesian criteria (SBC) were considered. In the second step, the variables which are selected by maximum adjusted R 2 and minimum MSE were entered together into the model to find the best fitted regression equation.
 $$y = {\beta _{0{\rm}}} + {\beta _1}{X_1} + {\beta _2}{X_2} + \cdots + {\beta _n}{X_n} + {\rm} {e_j},$$
where y is the dependent variable (BW); β 0, the intercept; X 1, …, X n , the independent variables (HG, BL, WH, RH, CD, PW, SW, EL, HoL, RL, RW, HL, CBC, CBL); β1… , βn, the regression coefficients of the variables X 1, …, Xn; and ej, the residual random error.
Results
Qualitative traits
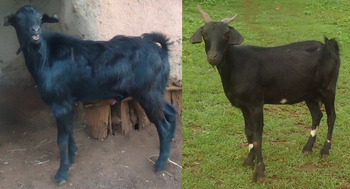
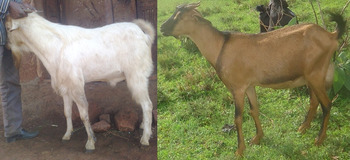
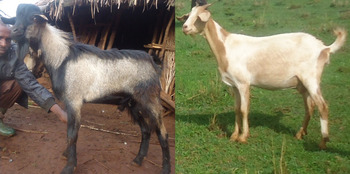
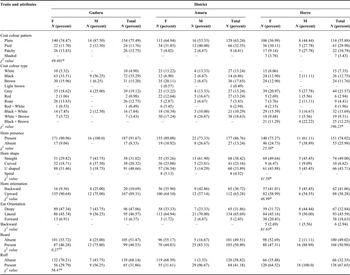
The most observed coat colour pattern in the study districts was plain (75.49 percent in Guduru, 63.24 percent in Amuru and 55.88 percent in Horro). Pied coat colour pattern was relatively observed in Amuru (32.35 percent) and Horro (29.90 percent) district goats than in Guduru district goats (11.76 percent). Eleven types of coat colours were identified in sample districts. From those colours, black and grey accounted 35.29 and 19.12 percent, respectively, in Guduru district goats (Figure 2 and Table 1), whereas in Amuru district goats, the dominant coat colour types were white and brown with brown dominant (18.63 percent) and brown (17.65 percent) (Figure 3 and Table 1). In Horro district goats, grey (21.57 percent) and black and white with black dominant (15.69 percent) were the frequently occurred coat colour types (Figure 4 and Table 1).
Adult indigenous breeding buck (left) and doe (right) in Guduru district.

Adult indigenous breeding buck (left) and doe (right) in Amuru district.

Adult indigenous breeding buck (left) and doe (right) in Horro district.

Qualitative traits of indigenous goats in Horro Guduru Wollega zone by sex and district.

*=P < 0.05 for both sexes across district, NS = P > 0.05
Majority of goats (91.67 percent in Guduru, 86.76 percent in Amuru and 74.02 percent in Horro) were horned and most of these horned goats had upward horn orientation. In Guduru, 48.66 percent of goats had U shaped horn; however, in Amuru and Horro, 38.42 and 49.00 percent of goats had straight horn shape, respectively. Most of goats in sample districts had Lateral and dropy ear orientations. Most of qualitative traits were not influenced by sex except beard and ruff presence which was mostly expressed in male goats.
Multiple correspondence analysis
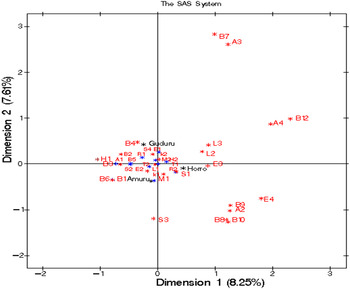
The common qualitative characteristics among goats of the three districts were investigated by a multiple correspondence analysis. A bi-dimensional graph representing the associations among different categories of qualitative traits is presented in Figure 5. The interpretation is based on points found in approximately the same direction from the origin and in approximately the same region of the space. Around 16 percent of the total variation is explained by the two dimensions (8.25 percent by the first and 7.61 percent by the second dimensions). On the dimensions identified, goat populations from the three districts shared some common characteristics. This might be due to the geographic proximity and possible gene flow among the three districts.
Bi-dimensional plot showing the associations among the categories of the different morphological variables.

Quantitative traits
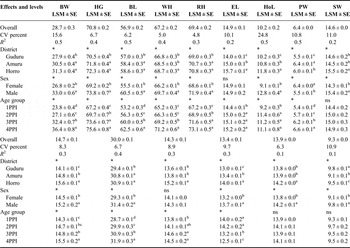
Sex effect: The least-squares means for the effect of sex had significant effect (P < 0.05) on all quantitative traits except EL and RL. This indicates that, sexual dimorphism was observed in most of quantitative traits. Male goats were consistently higher than female goats in all quantitative traits except PW, which is slightly higher for female goats (Table 2).
Least-squares means for body quantitative traits as affected by district, sex and age group.

a,b,c,dMeans on the same column with different superscripts within the specified sex, district and dentition group are significantly different (P < 0.05); ns, non-significant (P > 0.05).
BW, body weight; BL, body length; HG, heart girth; WH, wither height; RH, rump height; HoL, horn length; EL, ear length; PW, pelvic width; SW, shoulder width; 1PPI, 1 pair of permanent incisors; 2PPI, 2 pair of permanent incisors; 3PPI, 3 pairs of permanent incisors; 4PPI, 4 pairs of permanent incisors; HL, head length; CD, chest depth; RW, rump width; RL, rump length; CBL, cannon bone length; CBC, cannon bone circumference; 1PPI, 1 pair of permanent incisors; 2PPI, 2 pair of permanent incisors; 3PPI, 3 pairs of permanent incisors; 4PPI, 4 pairs of permanent incisors; NA, not applicable.
District effect: District had significant effect (p < 0.05) on all quantitative variables. For all quantitative traits except for CBC the Amuru and Horro district goats were significantly (P < 0.05) higher than Guduru goats (Table 2). At the scope of this study, it is very difficult to link this difference to any genetic background and it might be due to different management practice of the farmers.
Age effect: BW and all body measurements were significantly affected (P < 0.05) by age group except CBL. BW, CD, heart girth, BL, RH, EL and HL were increased as the age increased from the youngest (1PPI) to the oldest (4PPI) age group (Table 2). Though, is very difficult to generalize, a good observation from this study was that CBL hardly increases after goats replace their milk incisor teeth to permanent incisor teeth.
Correlation between BW and LBMs
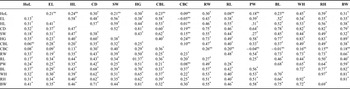
BW was significantly (P < 0.05) correlated with all quantitative traits of both male and female goats except CBC in male (Table 3). The quantitative traits in both male and female goat population depicted weak to strong correlations and most of the traits had significant (P < 0.05) and positive associations.
Correlation coefficients among BW and linear measurements ofHorro Guduru Wollega goats (values above the diagonal are for males and below the diagonal are for females).

ns, non-significant (P > 0.05); *, significant at 0.05 level.
BL, body length; HG, heart girth; WH, wither height; RH, rump height; RW, rump width; RL, rump length; CD, chest depth; PW, pelvic width; SW, shoulder width; HL, head length; CBL, cannon bone length; CBC, cannon bone length; HoL, horn length; EL, ear length; BW, body weight; SC, scrotal circumference.
In male goats, heart girth had strong positive correlation (r = 0.89) with BW followed by BL (r = 0.82), WH (r = 0.81), RH (r = 0.81). In female goats heart girth had also strong positive correlation with BW (r = 0.81).The strong positive and significant correlation between BW and heart girth suggested that these variables could provide a good estimate in predicting live BW of goats.
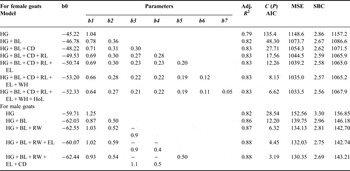
Prediction of BW from LBMs
Heart girth was the first variable to explain more variation than other variables in both female (79 percent) and male (82 percent) goats of Horro Guduru Wollega. As shown in Table 4, adjusted R 2 did not always increase as new variable was added to the model but the addition of new variables decreased the C (P), AIC, MSE and SBC with little or no influence on the adjusted R 2. It should be noted that when new variable was added to the model, C (P), AIC, MSE and SBC usually decreased but addition of unnecessary variable to the model might increase the error. Thus the result of the multiple regression analysis indicated that the addition of other LBMs to heart girth did not result in significant increase in adjusted R 2, but it significantly improved the accuracy of prediction by decreasing the error even though the amount was small. Therefore, at farmers level, where weighing scales are not available and complex formula is not understandable, BW could be predicted from the regression equation y = −45.22 + 1.04x for does and y = −59.71 + 1.25x for bucks, where y and x are the BW and heart girth, respectively.
Multiple regression analysis of live BW on different body measurements of female and male goats in the study area in all age groups

HG, heart girth; BL, body length; CD, chest depth; RL, rump length; EL, ear length; WH, wither height; HoL, horn length, R 2, coefficient of determination, AIC, Alkaike's information criteria; C (P), the mallow's parameters; SBC, Schwarz Bayesian criteria; MSE, mean square error.
Discussions
In this study, the physical description of goats for most of qualitative traits was different from the results of different authors in different areas (Farm-Africa, 1996; Mahilet, Reference Mahilet2012; Gebreyesus et al., Reference Gebreyesus, Haile and Dessie2013; Abegaz et al., Reference Abegaz, Sölkner, Gizaw, Dessie, Haile and Wurzinger2013). Around 65 percent of goats in the study area had plain coat colour pattern with 18.30 percent black and 17.97 percent grey. The result showed that the phenotypic characteristics of traits like coat colour pattern and coat colour type for Horro Guduru Wollega goats represent totally different population of goat than the previous report of Farm-Africa (1996) who reported that 51 percent of western highland goats had plain coat colour pattern with 42 percent white and 42 percent fawn. Most (84.15 percent) of goats in the study area were horned goats. Similarly, Farm-Africa (1996) reported that, 86 percent of goats in western highland of Ethiopia had horn.
The significant performance difference (P < 0.05) of male goats and female goats for most of quantitative traits shown in this study was in line with the results of Mahilet (Reference Mahilet2012) in Eastern Hararghe and Gebreyesus et al., (Reference Gebreyesus, Haile and Dessie2013) in Diredewa. The overall average BW of male (33 kg) and female (26.8 kg) indigenous goats in the study area differed from the average BW of Hararghe goats as reported by Mahilet (Reference Mahilet2012) with 27 and 24 kg for males and females, respectively. A significant effect of age is also reported by Mekasha (Reference Mekasha2007) who shows the effect of age on BW and other body measurements in different goat breeds of Ethiopia. The strong positive and significant correlation between BW and heart girth reported in this study strongly agrees with the results of Gebreyesus et al., (Reference Gebreyesus, Haile and Dessie2013) and Mahilet (Reference Mahilet2012).
Conclusions
This study provided that goat population in Horro district was significantly different from goat population in Guduru district in both qualitative and quantitative characters. In addition, goat population in the study area had shown different phenotypic characteristics with relative to western highland breed. At the scope of this study, it is very difficult to link this difference to any genetic background and it might be due to different management practice of the farmers. Further genetic study may fully describe this unique goat population and should be focus of future research.
Acknowledgements
We greatly acknowledge the Haramaya University for financial support. Special thanks go to farmers who spared their animals for this study and developmental agents for their keen support during field data collection.
Statement of interest
The authors declare that there is no conflict of interest involved in this study.