Introduction
Many biological and non-biological risk factors have been reported to be associated with cognitive decline (Yip et al., Reference Yip, Brayne and Matthews2006; Brayne et al., Reference Brayne1996). In cross-sectional analysis, the strong association of education with increased cognitive performance is well described but its association with longitudinal cognitive change is not so clear cut. In a review of the literature on the effect of education on cognitive change, Anstey and Christensen (Reference Anstey and Christensen2000) categorized into four types those studies that had investigated the topic: (i) studies reporting that better educated individuals declined at a slower rate; (ii) studies that did not find an effect of education on cognitive change; (iii) studies where the effect was only found in subpopulations; and (iv) studies that were restricted to certain outcome measures. A number of reasons were thought to explain these disparate findings. First, psychometric properties of the measuring tools used in the studies were not the same nor was the measurement of the education. For instance, change is likely to be underestimated where ceiling or floor effects are present in the outcome measure. Also, whether education was used as a continuous variable or coded as a categorical variable and, if categorical, the number of categories considered, may also affect results. Second, when examined longitudinally, characteristics of the study design such as proximity and frequency of interviews, length of follow-up and demographics of the sample examined were possible factors likely to affect findings. For instance, samples of volunteers or specific subgroups of the population are more likely to reflect a healthy participant effect, and hence, less likely to identify change.
Finally, differences in the methodologies employed in the analytical examination of the association between education and cognitive decline are also likely to affect findings. Often, this association is examined using Generalized Estimating Equations (GEE) (Liang and Zeger, Reference Liang and Zeger1986) and Repeated Measures Multilevel Models (also called random effects models) (Laird and Ware, Reference Laird and Ware1982). Whilst GEE generalize regression models accounting for correlated data modeling average change over time, multilevel models model individual change as deviations from the population averages. Both models produce estimates that are robust in the presence of missing data, though GEE have a strict missing data assumption (Laird, Reference Laird1988). Common to these two statistical models is the assumption that all individuals in the sample belong to a single population defined by the individual's mean developmental trajectory. For instance, in a linear random effects model with random intercepts and slopes, it is assumed that all individuals in the population decline at constant rate with random effects allowing for deviations of the individual level parameters from the population mean parameters. When covariates are included in the model, their effect applies across individuals in the population.
Growth mixture models (GMM) (Muthén and Shedden, Reference Muthén and Shedden1999) are an extension of multilevel models that relax the single population assumption. They permit the identification of unobserved groups of individuals with similar trajectories (classes) and allow for the examination of the role of class specific risk factors. GMM estimates, like those obtained from multilevel models, are robust against missing data that are missing at random (Muthén and Shedden, Reference Muthén and Shedden1999).
Cognitive decline is often measured by change in the Mini-mental State Examination (MMSE) (Folstein et al., Reference Folstein, Folstein and McHugh1975), a test that, despite being created as a ward-based screen for dementia, has become the most widely used instrument in the world for the measurement of cognition in the older population. The MMSE is inexpensive, quick to apply and has been shown in many settings to be associated with biological and neurological markers (Xuereb et al., Reference Xuereb2000; Ala et al., Reference Ala, Hughes, Kyrouac, Ghobrial and Elble2002). It has a range of integer scores from 0 to 30, with high values indicating good cognitive status.
We aimed to examine the hypothesis that the existence of more than one developmental pattern of cognitive decline (classes) in a population of the very old followed upon a prolonged period. These classes were then investigated further to see whether education was linked to the different patterns of change. Data from four interview waves of a population-based longitudinal study of aging, the Cambridge City over 75 Cohort study (CC75C), were used.
Methods
Study design
The Cambridge City over 75 Cohort Study (http://www.c75c.group.cam.ac.uk) is a population-based study which began in 1985, then called the Hughes Hall Project for Later Life (Fleming et al., Reference Fleming, Zhao, O'Connor, Pollitt and Brayne2007). People aged at least 75 years old in 1985 who were registered at five primary care practices and one in three from a sixth practice in the Cambridge City area were recruited. Those who agreed (95% response rate) were screened by trained interviewers in their home and sociodemographic information was collected. Cognitive status was assessed using the Mini-mental State Examination. When a question was not asked or was not applicable in the MMSE test due to sensory or physical impairment, the item was scored as zero (impaired) and included in the calculation of the final MMSE score. Individuals were asked at what age they left school. Two education groups were defined with a cut-point of 14 years old. Information about activities of daily living (ADLs) was also collected. Good mobility was defined as present if an individual responded that they could walk unaided around town or the block.
The screening interview was followed by a more detailed clinical interview of all individuals scoring 23 or less on the MMSE and a third of those with scores of 24 and 25 points. Further waves of interviews were carried out to establish incidence of dementia. After baseline, interviews were conducted on all the survivors at an average of 2, 7 and 9, 13, 17 and 21 years later. Data from the first four interviews were examined here. Characteristics of individuals at baseline and later interviews are shown in Table 1.
Number and percentage of individuals seen and lost to follow-up due to death or dropout over the four study interviews in the CC75C Study

§ Missing due to death or dropout.
MMSE = Mini-mental State Examination.
Eighteen individuals who dropped out of the study at the second interview re-entered, sixteen of them rejoined at the third interview and two at the fourth interview. Data on these re-entries were not used to produce a non intermittent data set. All individuals were observed at baseline, but 43, 24 and 17% of the sample had died or dropped out for the first time at the second, third and fourth interviews respectively.
Statistical model and model evaluation
Growth mixture models (GMM) allow for the identification of unobserved groups of individuals with similar trajectories. For each group, estimates of the average trajectory and its variation, of group probabilities and of each individual's most likely group membership are estimated. Estimates of the effect of risk factors on group specific parameters are also produced. In epidemiological studies where longitudinal data with missing observations are analyzed, it is often assumed that estimates are robust without proceeding any further into the examination of the missing data. However, if the missing data model is modeled jointly with the developmental process, there is the opportunity to identify and quantify the effects of risk factors for dropout and death.
We fitted a joint GMM and a model for the missing data using Mplus (Muthén and Muthén, Reference Muthén and Muthén2004), a statistical software package that produces estimates using maximum likelihood methods and numerical integration for models with missing data on dependent variables. A priori, the number of unobserved latent groups is unknown to the investigator. The standard procedure (Muthén and Shedden, Reference Muthén and Shedden1999) to identify the model that best describes the data in terms of goodness of fit and parsimony consists of fitting a range of models with an increasing number of latent groups. Then the values of indexes such as the Bayesian Information Criterion (BIC) (Schwartz, Reference Schwartz1987) are compared to identify the model with the lowest BIC value, which corresponds to the model with best fit, The BIC is calculated as BIC = –2 loglikelihood + r ln n; where r is the number of free parameters in the model and n the sample size. The entropy (Ramswamy, Reference Ramswamy1993) is a measure of classification that provides an indication of how well it is possible to predict group membership given the observed data. It takes values between 0 and 1, with high values indicating good classification. It is calculated as  ; where
 is the estimated conditional probability of individual i being in group k, K the total number of groups and n the sample size.
To model the missing data, we first created a missing data indicator Rit = 1 if individual i's MMSE score at time t was missing and 0 otherwise. Second, following Diggle and Kenward (Diggle, Reference Diggle1994), the probability of individual i's first dropout or death at time t was defined as pit = P(Rit = 1|MMSEi(t − 1), Xi), where Xi represents observed data other than MMSE scores and modeled using the logistic regression model: logit(pit) = αMMSEi(t − 1) + βXi
Model fitted
We fitted a series of linear and quadratic age-based growth mixture models to MMSE scores jointly with a logistic regression model to describe the missing data mechanism (for further details of the model fitted, see Appendix A1). The longitudinal effect of age was investigated considering age as a time-varying covariate centered at the average age at baseline, namely 81 years. According to the parameterization of the models fitted, the intercept of the models fitted represented mean cognitive performance at the age of 81 years for a reference individual (man aged 81 years at baseline with poor mobility who had left school aged 15 years or older) and the linear term its annual rate of decline. In the quadratic model the quadratic term represented the change in rate of decline (or its acceleration). To account for differences in baseline age, centered baseline age was also included as a time invariant covariate. Dummy variables were created to adjust group specific random effects for differences in education (1 = individual had left school at an age younger than 14 years old, 0 otherwise), gender (1 = women, 0 = men) and mobility (1 = good mobility, 0 = poor mobility). For each interview wave, missing data indicators were created for use in the logistic regression considered for the missing data model. The probability of dropout or death at each interview was adjusted for the last observed MMSE score, education, mobility, gender and the individual's age at baseline.
Results
Model selection and classification
Following the procedure described before, BIC values obtained from a series of linear and quadratic models with an increasing number of groups were compared. The lowest BIC corresponded to a quadratic model with three groups. Its entropy was calculated at a value of 0.86, which indicated that the model had a good classification of individuals into groups.
Groups and risk factors
Of the 2053 individuals seen at wave 1, 10 had missing information on the number of years of education. Owing to listwise deletion that excluded these individuals from the analysis, the sample size was reduced to n = 2043. There were no differences in baseline age, gender, cognitive scores and mobility between these individuals and the rest of the sample.
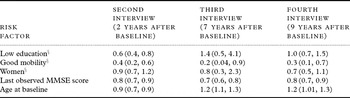
Results of the logistic regression model used to model the missing data indicate that across interviews, low cognitive scores in the previous interview, poor mobility, being female and older than 81 years at the beginning of the study predicted death or dropout (Table 2).
Adjusted odds ratios and 95% CI for death or dropout by interview

§ Reference categories: high education, poor mobility, men.
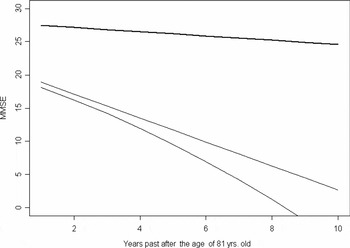
Three latent groups were identified. In two of the groups, individuals showed moderate cognitive impairment (19.8, SD = 0.6 and 20.7, SD = 3.6 points in MMSE) by the age of 81 years and declined sharply with age. Of these two groups of impaired individuals, the former was a large (n = 1102, 54% of sample) group of individuals experiencing an accelerating decline with age whilst the latter was a small group of individuals (n = 97, 5% of sample) who declined markedly but for whom the term indicating an acceleration in the decline did not reach conventional statistical significance. Individuals in the third group (n = 844, 41% of sample) had higher cognitive performance at the age of 81 years old and declined, to some extent, steadily, with no evidence of acceleration (good performers). Figure 1 shows the three estimated mean trajectory curves.
Mean curves of the three groups of individuals with different patterns of cognitive decline.

On average, the age distribution of baseline age across the three groups was similar (81 years). In the class of good performers, 85% of individuals had good mobility, 67% had low education and 38% were men. This pattern differed only slightly from the other two groups. The group of impaired individuals with constant decline had slightly larger proportions of individuals with good mobility (78%), low education (73%) and men (38%) than the group with accelerating decline (75%, 71% and 33% respectively).
In all groups, residual variances of cognitive performance at the age of 81 (p < 0.05 in all cases) indicated significant variability of individuals’ cognitive performance about mean group parameters above covariate adjustment. Residual variances of rate of decline and its change were also significant (p < 0.05) in the group of good performers.
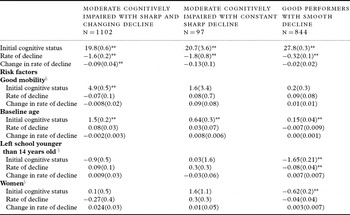
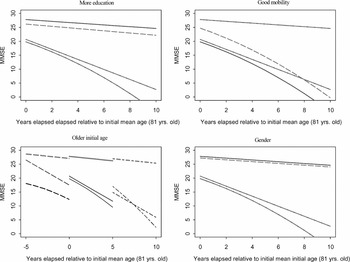
Estimates of group-specific mean parameters and of the effect of risk factors on model parameters are shown in Table 3. Within the group of good performers, higher level of education was positively associated with cognitive performance and lower rate of decline. In this same group, women had poorer performance than men. Figure 2 illustrates the effect of covariates on mean trajectory curves.
Estimates (S.E.) of group-specific mean parameters and of the effect of risk factors on group-specific initial cognitive status, rate of decline and its change

§Reference categories; ** Statistically significant at 5% confidence level.
CI = confidence interval.
Graphs showing the effect of more education, good mobility, older initial age and gender (clockwise from top left) on mean trajectory curves of cognitive decline.
Left top graph: Mean trajectories of men, aged 81 years old at baseline, with poor mobility and poorer education are plotted with dashed lines; mean trajectories of individuals of similar characteristics with more education are plotted in solid lines. The effect is marked for cognitive performance in the group of good performers with smooth decline.
Right top graph: Mean trajectories of men, aged 81 years at baseline, with poor education and poor mobility are plotted with a dashed line whilst those of individuals with similar characteristics but with good mobility are plotted with a solid line. The effect of good mobility on cognitive performance is clear in the group of individuals with accelerating decline.
Left bottom graph: The three dashed curves on the left are mean trajectories of men aged 76 years at baseline, with poor education, and poor mobility; solid curves in the middle are mean trajectories of individuals of similar characteristics aged 81 years at baseline, whilst semi-dashed curves on the right are mean trajectories of individuals aged 86 years at baseline. These three sets of mean curves show the effect of older baseline age on cognitive performance in all groups.
Right bottom graph: Solid lines show mean trajectories of men aged 81 years at baseline, with poor education and poor mobility; mean trajectories of women of similar characteristics are plotted using dashed lines. They demonstrate the effect of gender on cognitive performance for good performers with smooth decline.

In all groups, as expected, individuals older than 81 years at baseline had poorer performance than younger ones. In the group of impaired individuals with sharp accelerating decline, older baseline age was associated with more rapid decline.
Discussion
The population studied here started with a very high response rate and includes institutions so that these classes are representative of detectable groups at population level. The analytical methods used, which explicitly accommodate drop out, identified three groups, all with similar ages, gender and mobility but which have quite different starting points on MMSE and patterns of change over time. Nearly half start higher on MMSE, do have detectable decline but at a steady rate. The majority group starts a little lower and has an accelerating pattern of decline. The third group starts lower and declines faster. In the high start, slow decline group only is there a detectable effect of different levels of education so that within this relatively “successful” aging group, the cognitive decline of those with higher education is slower than in those with lower levels of education. In the other two groups, perhaps for different underlying reasons, education has no effect. When other variables were included in the model, different influences are revealed with mobility emerging as important in the more cognitively impaired group with accelerating decline.
Limitations of this study include the size of dropout but this is the function of the model. This analysis does not differentiate between death and dropout for other reasons as they cannot be accommodated within the analysis,
The MMSE was developed as a screening instrument for dementia and is known to have poor sensitivity to detect change in the tails of the distributions, or a truncated and skewed distribution. However, as the CC75C is a population-based study, and in the population very few individuals score in these areas of the distribution, MMSE's poor sensitivity to detect change does not affect our results to any great extent. GMM models require within-class normality of residuals, a distributional assumption not fully satisfied by MMSE scores. A transformation of the data can partially help overcome some of these conundra, although as most transformations recommended (MRC CFAS, 1998) are not isometric, do not adjust for truncation and limit considerably the interpretability of results, we opted to present results from non transformed scores.
Although GMM models are not new in the literature on aging, previous applications of GMM have been focused on its classification properties (Small and Backman, Reference Small and Backman2007) and on computational developments of the method (Proust and Jacqmin-Gadda, Reference Proust and Jacqmin-Gadda2005). Two similar population-based studies have used GMM to explore patterns of cognitive change. In one, Small and Backman (Reference Small and Backman2007) used data from a Swedish study of individuals aged 75 years and older to determine whether a linear or a quadratic model led to a better classification of Alzheimer's disease cases and compared the characteristics of those correctly and incorrectly classified by the model. They concluded that a two-group quadratic model produced a better classification of cases and non cases and fitted the data better than a linear or a single group quadratic model.
In the second study, Proust and Jacqmin-Gadda (Reference Proust and Jacqmin-Gadda2005; Small and Backman, Reference Small and Backman2007) reported the fit of a mixture model to data from a French study of individuals aged 65 years and older as an example of the application of a software package they had developed. They identified two cognitive groups: a large group of individuals who declined at a small and constant rate and a small group of individuals whose decline accelerated after the second interview.
Both differ from our investigation and between each other in their choice of time structure. Whilst Small and Backman considered an occasion-based time structure, Proust and Jacqmin-Gadda chose a time-to-event time structure (time to the interview conducted eight years after the first interview) and here an age-based structure is used. This choice is supported by the argument that if the area of interest to investigators is the estimation of aging effects across a wide age range, an age-based model provides more interpretable results than a time-based model, which is more suitable when the main interest is the estimation of change over a particular period of time (Shaw et al., Reference Shaw, Krause, Liang and Bennet2007).
The joint modeling of the missing data mechanism and the mixture model also allowed us to examine predictors of death and dropout. Lower cognitive scores, poor mobility, being female and advanced age at baseline were consistent predictors over time of death and dropout. These results agree with previous research (Matthews et al., Reference Matthews, Chatfield, Freeman, McCracken and Brayne2004; Chatfield et al., Reference Chatfield, Brayne and Matthews2005; Muniz Terrera et al., Reference Muniz Terrera, Matthews and Brayne2008) but not all (van Beijsterveldt et al., Reference van Beijsterveldt, van Boxtel, Bosma, Houx, Buntinx and Jolles2002).
This analytical approach allows exploration of different influences within class. In our analysis, education and mobility were found to be important in different groups. This suggests that we may miss findings of importance in an analysis which only attempts to look for effects which are consistent across groups when we know from our own and repeated longitudinal studies that patterns of aging are highly heterogeneous.
The simple measure of mobility emerged as a powerful factor related to cognitive performance in the group of cognitively impaired individuals whose rate of decline changed with age, but it had little effect in the other groups. Results also demonstrate that the effect of more education is not homogeneous across age-related cognitive decline groups. More education has a protective effect only in the group of good performers. The cognitive brain reserve hypothesis (Stern, Reference Stern2002) may partially explain this finding. This hypothesis suggests that the brain compensates damage to maintain its effective operation. Under this hypothesis, more educated individuals could sustain greater damage before showing functional deficits. As better educated individuals are also likely to have higher socioeconomic status, better nutritional habits and healthier lifestyles, the positive effect of education may also confound these other factors. In addition, the slower rate of decline in highly educated individuals may also be due to the crystallized content of many of the MMSE items. Our analysis did not identify a strong effect of education on individuals who had moderate cognitive impairment at the age of 81 years. This lack of association may be explained by the fact that these individuals were already too impaired at the age of 81 for education to have a positive effect on their decline as suggested by the threshold model (Katzman, Reference Katzman1993).
This is the first study to attempt a finer grained analysis of patterns of cognitive change and their population influences. Such an approach, when applied to the rich variety of longitudinal data available through the life course on cognition, may enhance our progress in understanding successful and pathological aging.
Conflict of interest
None.
Description of authors’ roles
Graciela Muniz Terrera fitted the models and wrote the paper. Fiona Matthews, Carol Brayne and the CC75C group collaborated in writing the paper.
Acknowledgments
Graciela Muniz Terrera's work is supported by U.K. Medical Research Council CDA WBS U.1052.00.013.00003. Fiona Matthews is supported by U.K. Medical Research Council WBS U.1052.00.013.00001. CC75C belongs to the Cambridgeshire and Peterborough Collaboration for Leadership in Applied Health Research and Care (CLARHC).
Appendix A1:
A graphical representation of the model fitted is:

In this diagram, latent variables are represented within ellipses (C = latent classes, Intercept = class specific initial cognitive performance, linear term = class specific annual rate of decline and quadratic term = class specific change in rate of decline). Observed variables such as MMSE scores (MMSE 1 to MMSE 4), missing data indicators (Miss 2 to Miss 4) and observed covariates are represented within rectangles. The arrows indicate the relationship between variables. Where binary variables are outcome variables, logistic regressions are fitted whilst linear regressions relate continuous outcomes with covariates.
Estimates with robust standard errors were produced using maximum likelihood estimation where a numerical integration algorithm was used.
More technically, to specify the model fitted, consider the likelihood  , where yi for i = 1.., n is the outcome variable for individual i, xi are covariates and ci are latent classes (i = 1.., K). With missing data, each term log [yi, |ci, xi]. can be expressed as:
log [yobsi, ymissi, mi|ci, xi] where mi are missing data indicators that take the value of 1 if an observation is missing and 0 otherwise, and yi, xi and ci as before. The likelihood focuses on the observed variables:[yobsi, mi|ci, xi] = ∫ [yobsi, ymissi, mi|ci, xi][mi|yobsi, ymissi, xi]dymissi; which under MAR can be expressed as [yobsi, mi|ci, xi] = ∫ [yobsi, mi|ci, xi][mi|yobsixi]dymissi