

INTRODUCTION
Rivers respond dynamically to changes in climate and hydrology. Some rivers respond predictably through adjustments in sediment transport regime and channel morphology, while others experience less predictable changes through complex planform adjustments or threshold responses to hydrologic decline. One such marked change is the transition, either temporal or spatial, from a continuous, single-channelled planform to a multichannelled network or floodout (Tooth, Reference Tooth1999) form on an alluvial plain as part of a distributive fluvial system (DFS) (Hartley et al., Reference Hartley, Weissmann, Nichols and Warwick2010; Weissmann et al., Reference Weissmann, Hartley, Nichols, Scuderi, Olson, Buehler and Banteah2010).
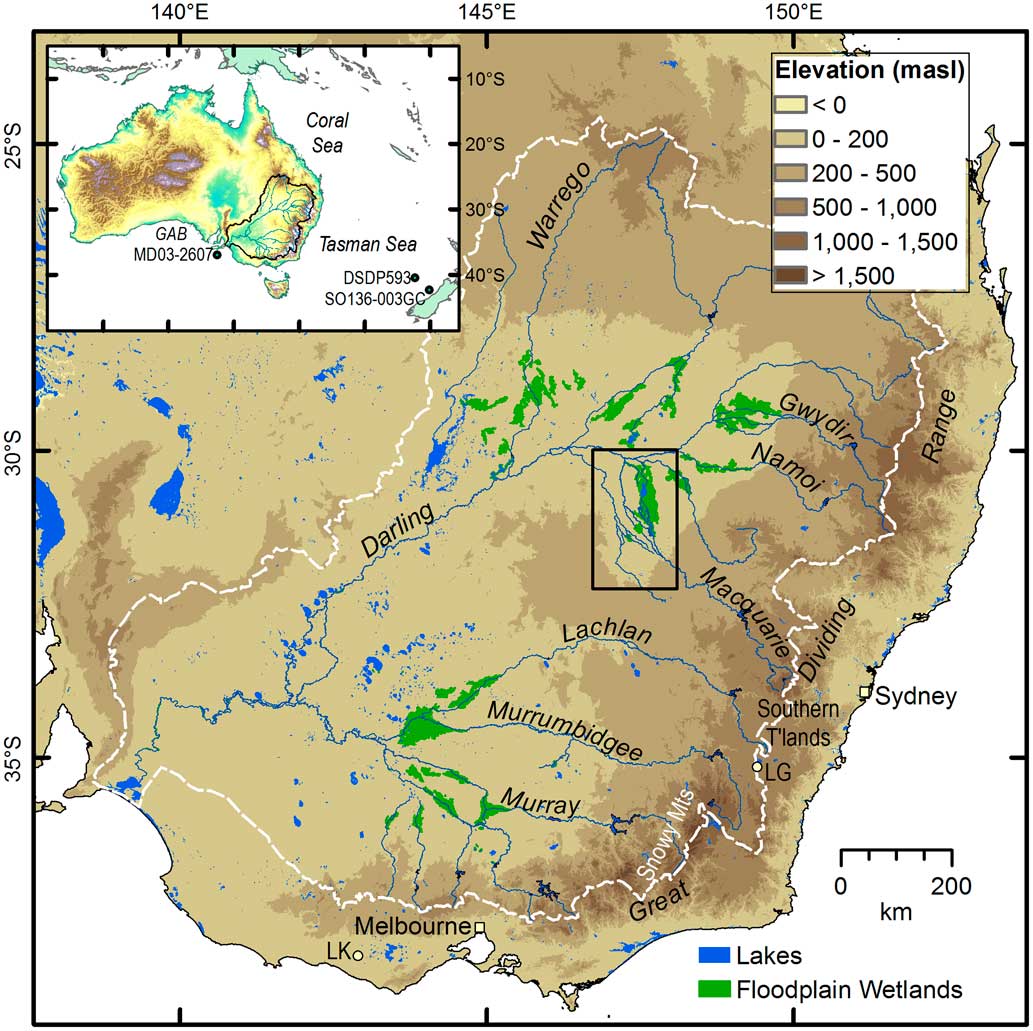
The recognition of large and morphologically diverse palaeochannels on the surface of the Murrumbidgee and Murray River alluvial plains (the Riverine Plain) of the Murray-Darling basin of southeastern Australia (Fig. 1) since the 1950s (Butler, Reference Butler1950; Pels, Reference Pels1964a, Reference Pels1964b, Reference Pels1966, Reference Pels1969) led to research into past climate change and its hydrologic and geomorphological impacts on this continent (Bowler, Reference Bowler1967, Reference Bowler1975). Declining channel size and increasing sinuosity from the late Pleistocene to the Holocene was recognised in early studies (e.g., Schumm, Reference Schumm1968), but only with luminescence dating have the timing and relations to hemispheric and global phases of climate change been clarified (Nanson et al., Reference Nanson, Price and Short1992; Page et al., Reference Page, Nanson and Price1996). The developing framework recognises several distinct (temporally and morphologically) fluvial phases within the last glacial cycle; large, bedload-dominated palaeochannels in the late Pleistocene succeeded by smaller, mixed- or suspended-load channels in the Holocene (Page et al., Reference Page, Kemp and Nanson2009). However, despite the increasing geographical range of studies within the Murray-Darling basin (Young et al., Reference Young, Young, Price and Wray2002; Kemp and Rhodes, Reference Kemp and Rhodes2010; Pietsch et al., Reference Pietsch, Nanson and Olley2013) and advances in dating techniques, the reasons for the declining discharge remain speculative, and the timing of the Holocene transition remains unclear in many river systems (Ogden et al., Reference Ogden, Spooner, Reid and Head2001). Additional studies over a broad geographical range supported by palaeochannel dating are one way of testing and refining hypotheses about the causes and timing of these hydrologic and morphological changes.

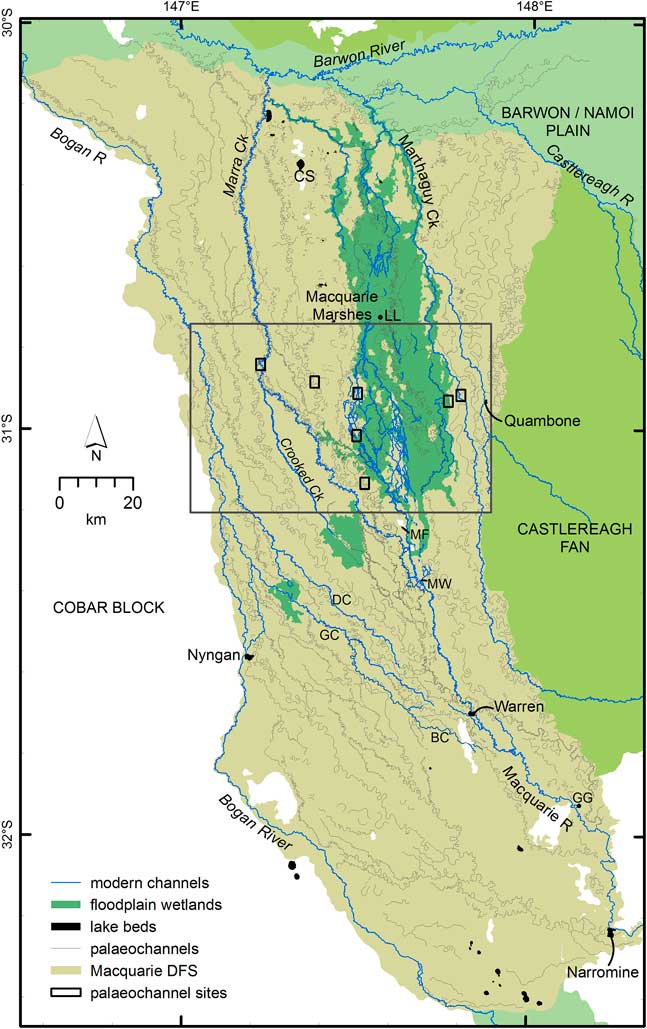
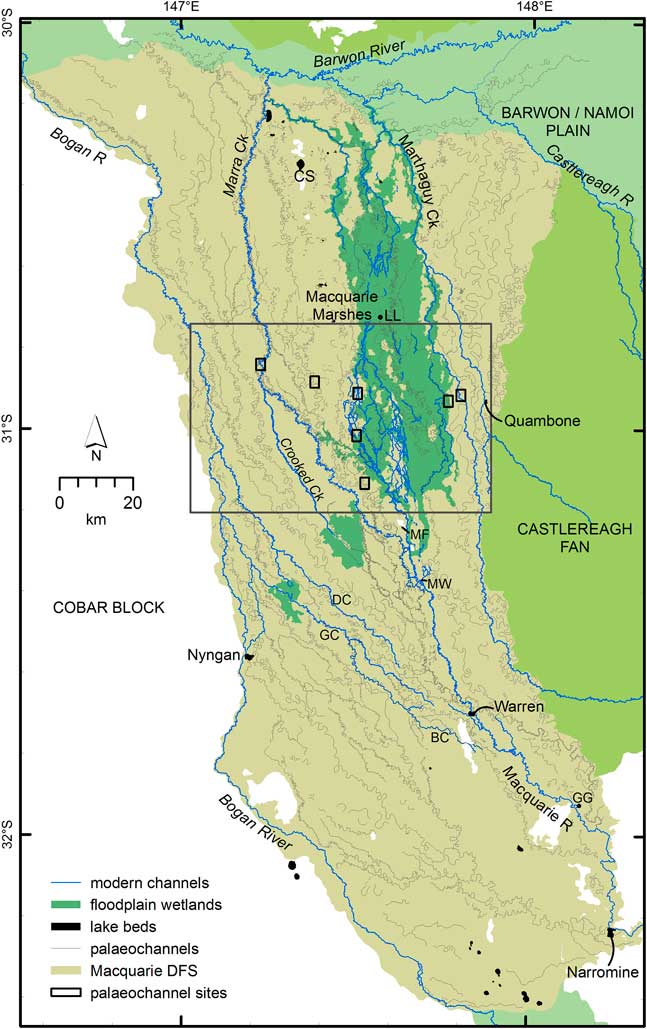
The alluvial plain of the lower Macquarie River in the northern Murray-Darling basin preserves about 80 palaeochannels of highly variable size and morphology (Figs. 2 and 3). The plain is an example of a DFS, a large alluvial feature characterised by a radial, distributive channel pattern (Weissmann et al., Reference Weissmann, Hartley, Nichols, Scuderi, Olson, Buehler and Banteah2010). The Macquarie DFS is notable for the breakdown of the modern river channel into complex floodouts (Tooth, Reference Tooth1999). These floodouts form the Macquarie Marshes (Yonge and Hesse, Reference Yonge and Hesse2009; Ralph and Hesse, Reference Ralph and Hesse2010), one of the largest inland wetlands in Australia and a wetland of international importance recognised under the Ramsar Convention for the protection of migratory waterbirds. Similar floodouts and wetlands are found in other Murray-Darling basin DFS rivers like the Gwydir, Lachlan, Loddon, and several others (Fig. 1). This channel breakdown leads to partial hydrologic disconnection from the receiving trunk streams, the Darling and Murray Rivers, and contrasts with the large, continuous palaeochannels that traversed the plain and connected directly to their trunk streams (Page et al., Reference Page, Kemp and Nanson2009; Pietsch et al., Reference Pietsch, Nanson and Olley2013).
Macquarie distributive fluvial system showing the modern drainage system (blue) and palaeochannels (grey). Flow is from south (Narromine) to north. The Macquarie Marshes and other floodplain wetlands are shown as dark green. The large box indicates the position of Fig. 3. Small rectangles indicate the location of the field sites (Fig. 4). BC, Belaringar Creek; CS, Cuddie Springs archaeological site; DC, Duck Creek; GC, Gunningbar Creek; GG, Gin Gin; LL, Louden’s Lagoon; MF, Mount Foster; MW, Marebone Weir. (For interpretation of the references to colour in this figure legend, the reader is referred to the web version of this article.)
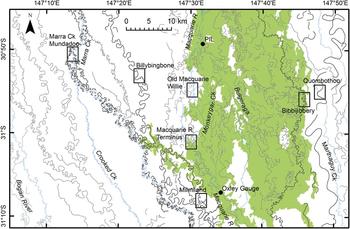
Part of the large array of palaeochannels (grey lines) preserved on the surface of the Macquarie distributive fluvial systems (DFS). Modern channels shown in blue; flow is from south to north. Mapping was based on interpretation of the light detection and ranging digital elevation model (LIDAR DEM). Rectangles indicate the location of the field sites (Fig. 4). The green shaded area represents the area of frequent inundation within the Macquarie Marshes (from Thomas et al., Reference Thomas, Kingsford, Lu and Hunter2011). PIL, Pillicawarrina. (For interpretation of the references to colour in this figure legend, the reader is referred to the web version of this article.)

The aim of this study is to establish the timing and magnitude of hydrologic and morphological adjustments of the lowland Macquarie River in the Late Quaternary. In doing so, we extend the alluvial palaeochannel chronology for the northern Murray-Darling basin, enabling comparison with nearby river systems. Six Macquarie palaeochannels were investigated using single-grain optically stimulated luminescence (SG-OSL) dating, focussing on those with the best preservation (clear features, longitudinal continuity) and encompassing a range of channel sizes and planforms. We combine these new analyses with two previously investigated sites on the late Holocene Macquarie River (Yonge and Hesse, Reference Yonge and Hesse2009; Larkin, Reference Larkin2012) to investigate river response to climate-driven hydrologic changes that collectively have led to the decline and fall of the lower Macquarie River.
REGIONAL SETTING
The Macquarie River rises in the Great Dividing Range up to 1400 m asl, flowing northwest through a partly confined valley, before turning north at Narromine onto an alluvial plain ~80 km wide and ~240 km long (Figs. 1 and 2). The catchment area at Narromine is 26,000 km2, and the river does not receive any further tributary input downstream.
The average annual precipitation (nearly all as rain) is 650–1000 mm, decreasing to 400 mm at the Macquarie Marshes. Snow falls several times each year at altitudes above 1000 m but does not persist. Mean annual flow at Baroona gauge (upstream of Narromine) is 1.009×10⁹ m3, and mean peak annual discharge is 3017 m3/s. Flow decreases downstream from Narromine, and at Oxley gauge (Fig. 2) the mean annual flow is only 0.301×10⁹ m3, and mean peak annual discharge only 277 m3/s (http://realtimedata.water.nsw.gov.au/water.stm?ppbm=SURFACE_WATER&rs&3&rskm_url, accessed 12 Dec 2016).
The modern Macquarie River continues as a single sinuous channel until Oxley, then anastomoses over a short reach before entering the Macquarie Marshes (Fig. 3). Downstream of the marshes, the river re-forms and joins the Barwon River. Within the marshes, channels avulse frequently (Ralph et al., Reference Ralph, Hesse and Kobayashi2016) and deposit sediment on the floodplains (Yonge and Hesse, Reference Yonge and Hesse2009) but do not migrate much laterally.
Early surveys (1880s) of the Macquarie River show the river terminating in a wetland at the site we now call the “Terminus” (Ralph et al., Reference Ralph, Hesse and Kobayashi2016; Fig. 3). The surveys agree well with the first European account of the marshes by the explorer John Oxley in 1817. The Terminus channel was later abandoned by an avulsion that formed Monkeygar Creek (Ralph et al., Reference Ralph, Kobayashi, García, Hesse, Yonge, Bleakley and Ingleton2011, Reference Ralph, Hesse and Kobayashi2016), but the old channel was preserved. The abandoned Terminus channel has an average width of 22 m and low sinuosity and is leveed and partly infilled with clays over the old bedload sand (Yonge and Hesse, Reference Yonge and Hesse2009).
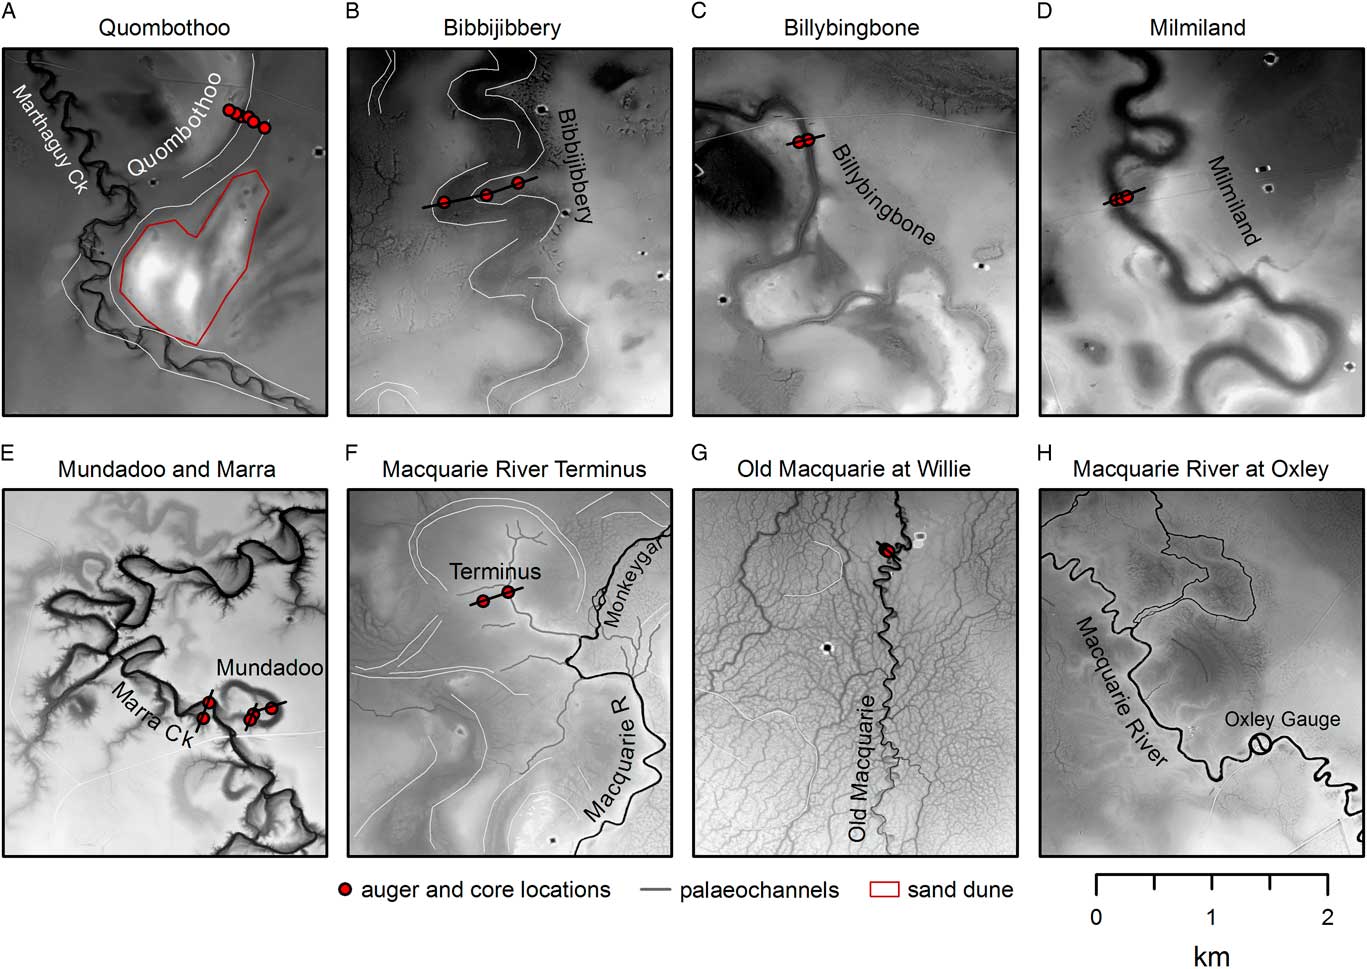
The so-called Old Macquarie is a reach of the river downstream of the abandoned Terminus that gathers outflowing water and forms a small, sinuous channel for 13 km before it again breaks down (Figs. 3 and 4G). This was the dominant channel of several in the southern Macquarie Marshes until avulsion at the Terminus redirected water eastward to Monkeygar Creek in the late nineteenth or early twentieth century, and construction of Marebone Weir upstream diverted flow to Bulgeraga Creek (Ralph et al., Reference Ralph, Hesse and Kobayashi2016; Figs. 2 and 3).
Extracts of the light detection and ranging digital elevation model (LIDAR DEM) showing the palaeochannel field sites (locations shown in Fig. 3). High elevations are white, and low elevations are black, but the grey scale is stretched in each extract to maximise the contrast and is not equivalent between extracts. Core and auger locations are indicated by circles, and palaeochannel traces (grey lines) are inferred from the LIDAR DEM (where not clear). Flow is from bottom to top. (For interpretation of the references to colour in this figure legend, the reader is referred to the web version of this article.)

PREVIOUS WORK ON MACQUARIE RIVER PALAEOCHANNELS
Early research on the Macquarie DFS identified and dated by thermoluminescence (TL) four alluvial formations (Watkins, Reference Watkins1992; Watkins and Meakin, Reference Watkins and Meakin1996) similar to the framework developed for the Murray and Murrumbidgee Riverine Plain (Page et al., Reference Page, Nanson and Price1996). All samples (except for the Trangie Formation) were taken from shallow (≈1 m) pits (Watkins, Reference Watkins1992), but details of the sedimentology were not reported. Sediment adjacent to Marra Creek (Fig. 2) (Marra Creek Formation) was dated to 6.4±1.7 ka (Watkins, Reference Watkins1992). Older Carrabear Formation sediment was dated to between 16 and 26 ka, and sediment of a yet older formation (Trangie) to the mid-Pleistocene (although these should be regarded as minimum ages; Price, D, personal communication, 2012). A fourth formation, the Bugwah, was inferred to date between the Marra and Carrabear Formations (Watkins and Meakin, Reference Watkins and Meakin1996).
A later study using single-aliquot regenerative (SAR) OSL dating (Yonge and Hesse, Reference Yonge and Hesse2009) found older ages inconsistent with the earlier chronology of Watkins (Reference Watkins1992) and Watkins and Meakin (Reference Watkins and Meakin1996). Point bar sands of the Milmiland palaeochannel, correlated to the Bugwah Formation of Watkins and Meakin (Reference Watkins and Meakin1996), were found to be about 30 ka, much older than the 16–6 ka suggested by Watkins and Meakin (Reference Watkins and Meakin1996).
Watkins (Reference Watkins1992) placed the onset of the modern fluvial regime at “about 10 ka,” based on TL ages of 13.4 ka for the older Bugwah Formation, 9.4 ka for a source-bordering sand dune associated with it, and 6.4 ka for the suspended-load Marra Formation. Watkins and Meakin (Reference Watkins and Meakin1996) revised this to a “maximum recorded age” of 6.4 ka for the modern fluvial system based on the same ages. The onset of sedimentation in the marshes was dated to between 8.5 ka (OSL) and 4.9 cal ka BP (14C) by Yonge and Hesse (Reference Yonge and Hesse2009), but the timing of the transition and the magnitude of the hydrologic changes leading to the Holocene system were not well constrained.
The floodplain in the now-abandoned Terminus marsh has characteristic floodplain wetland clays that overlie the silty and sandy clay deriving from an earlier, higher-energy, fluvial regime. The base of the wetland sediments is dated to 5.2 ka by SAR OSL and older than 4.9 cal ka BP by accelerator mass spectrometry 14C of bulk organic material (Yonge and Hesse, Reference Yonge and Hesse2009). This places initial marsh formation, and breakdown of the Macquarie, at about 5 ka. This transition is reflected in marsh sediment by loss of limnetic zooplankton and increasing diversity of terrestrial and aquatic vegetation before abandonment (Ralph et al., Reference Ralph, Kobayashi, García, Hesse, Yonge, Bleakley and Ingleton2011).
The Old Macquarie channel and a related meander cutoff at Willie are underlain by sandy clay but otherwise infilled by smectite-rich clay typical of the marshes today (Larkin, Reference Larkin2012; Fig. 3). The steep-sided channel has a reach-average width of 15 m. SG-OSL ages from sand sieved from the clay infill are 2.3±0.7 ka and 0.99±0.14 ka, postdating the cutoff and predating the age of 0.8±0.14 ka from the proximal floodplain of the adjacent modern channel (Larkin, Reference Larkin2012). The basal sandy clay layer in the cutoff gave an age of 4.8±1.2 ka, close to the age of initiation of marsh sedimentation at the Terminus.
METHODS AND APPROACH
Palaeochannel mapping and morphometrics
Detailed palaeochannel mapping supported selection of study sites, assessment of channel morphology assessment, and determination of crosscutting relations among palaeochannels.
A 1 m light detection and ranging digital elevation model (LIDAR DEM; NSW Office of Environment and Heritage) was used to measure palaeochannel dimensions at the field sites (Fig. 4). A 5 m LIDAR DEM (NSW Spatial Services: http://elevation.fsdf.org.au, accessed 1 Aug 2017) was used to map palaeochannels at the eastern, western, and southern margins of the DFS beyond the limits of the 1 m DEM. SPOT imagery was used to identify palaeochannels in a small area in the northwestern corner of the DFS not covered by the LIDAR DEM.
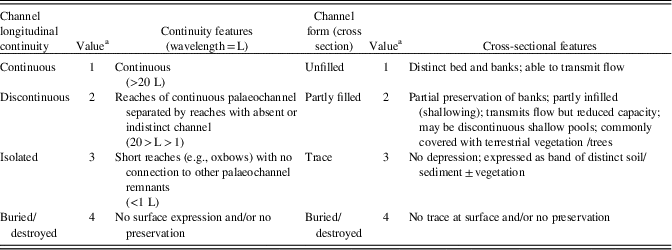
The detail provided by the LIDAR DEM allowed us to map many palaeochannels not observable on SPOT imagery or aerial photographs and in greater detail than for other DFS in the Murray-Darling basin, enabling precise mapping and measurement of 81 individual palaeochannels (Supplementary Table S1) and assessment of crosscutting relationships. In combination with SG-OSL dating, we have used crosscutting relationships to infer a relative sequence of palaeochannel formation. Rankings of surface continuity and cross-sectional form were combined to derive a numerical index of palaeochannel preservation (Table 1). This index value gives a ranking from 2 (best preserved) to 6 (isolated traces) for palaeochannels with surface expression. The preservation index was used to supplement the dating and crosscutting relationships to infer the relative age sequence of palaeochannels.
Palaeochannel preservation index scheme.

a The preservation index is derived by adding the value for continuity and the value for cross-sectional form.
Where possible for each mapped palaeochannel, we estimated bankfull width and meander wavelength. Bankfull width was measured at the inflection point between meander bends to reduce overestimation of width for formerly migrating palaeochannels. The reach-averaged bankfull width was calculated from eight individual measurements where possible. Rarely, a smaller number was used where palaeochannel preservation was poor. Meander wavelength was calculated by measuring the distance between inflection points along the reach over up to 10 wavelengths.
Palaeochannel sediment and OSL sampling locations
From the mapping, we identified four undated palaeochannels (Mundadoo, Billybingbone, Bibbijibbery, and Quombothoo) and two previously dated palaeochannels (Milmiland and Marra) (Figs. 2 and 3) for quartz SG-OSL dating. Each is generally well preserved (in terms of continuity and cross-sectional form) and can be related to the others by crosscutting relationships. Although all have a meandering planform, they range in width, wavelength, and meander characteristics. Suitable sampling locations were found at an approximately equal distance downstream from the point where the Macquarie River debouches onto the alluvial plain at Narromine. All locations are covered by the LIDAR DEM.
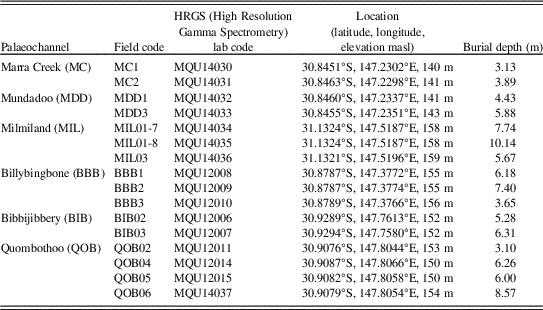
Sampling for OSL dating targeted a single cross section on each palaeochannel and the shallowest bedload sediment beneath infill (where the infilling sediment is distinct in character from the bedload sediment), or proximal point bar sediments adjacent to the palaeochannel. The age of these deposits correspond to the time of channel abandonment. At a minimum of three points across the width of each palaeochannel, sediments were extracted using a Dormer 50-mm-diameter sand auger. Samples for OSL analysis were taken using stainless-steel tubes attached to the auger and driven vertically into the sediment. At Milmiland and Quombothoo palaeochannels, cores were taken with a Mori S15 crawler-mounted drill rig fitted with a Tone Ecoprobe 06 medium-frequency sonic drilling head. All cores were retrieved without exposing the sediment to light and were later subsampled under subdued red-light conditions for OSL analysis. Additional sediment from above, below, and surrounding each OSL sample was collected for dose-rate calculations using high-resolution gamma spectrometry (Table 2).
Optically stimulated luminescence (OSL) sample locations and depths.

OSL sample processing
The OSL samples were prepared for analysis under subdued red light, with 180- to 212-µm-diameter quartz isolated using standard purification procedures, including 40% hydrofluoric acid for 45 min to etch the alpha-irradiated outer layers of the quartz grains (Aitken, Reference Aitken1998). Feldspar contamination was checked during analysis using an infrared wash (stimulation with IR diodes at 50°C for 100 s). For each sample, a preheat plateau test was conducted revealing a plateau of 260°C and the chosen preheat. A dose-recovery run (8 aliquots with signals removed at room temperature and bleached with blue diodes) at this preheat temperature tested the legitimacy of these measurement parameters, with all aliquots returning the surrogate dose within errors.
All OSL samples were analysed using an automated Risø TL/OSL-DA-20 reader (Bøtter-Jensen et al., Reference Bøtter-Jensen, Andersen, Duller and Murray2003) fitted with an EMI 9235QA photomultiplier tube and with Hoya U-340 detection filters (290–370 nm transmission) to prevent recording scattered stimulation light. Optical stimulations were performed using a green laser (532 nm). Equivalent dose (De) was determined using a modified SAR protocol after Murray and Wintle (Reference Murray and Wintle2000) and Wintle and Murray (Reference Wintle and Murray2006), with the first 0.2 s of luminescence decay used for signal integration and the last 0.3 s for background integration. Lithogenic radionuclide activity concentrations were determined using high-resolution gamma spectrometry, performed at the Environmental Research Institute of the Supervising Scientist, Darwin (Marten, Reference Marten1992; Esparon and Pfitzner, Reference Esparon and Pfitzner2010; Pfitzner, Reference Pfitzner2010). Dose rates were calculated using dose-correction factors from Adamiec and Aitken (Reference Adamiec and Aitken1998), with beta-dose attenuation factors taken from Mejdahl (Reference Mejdahl1979), and cosmic dose rates were calculated following the procedures of Prescott and Hutton (Reference Prescott and Hutton1994), factoring in latitude, altitude, and angle of zenith. Adjustments for moisture content (Aitken, Reference Aitken1985; Readhead, Reference Readhead1987) were calculated based on rounded in situ values measured from all samples in the absence of reliable information about long-term moisture content.
RESULTS
Palaeochannel mapping and crosscutting relationships
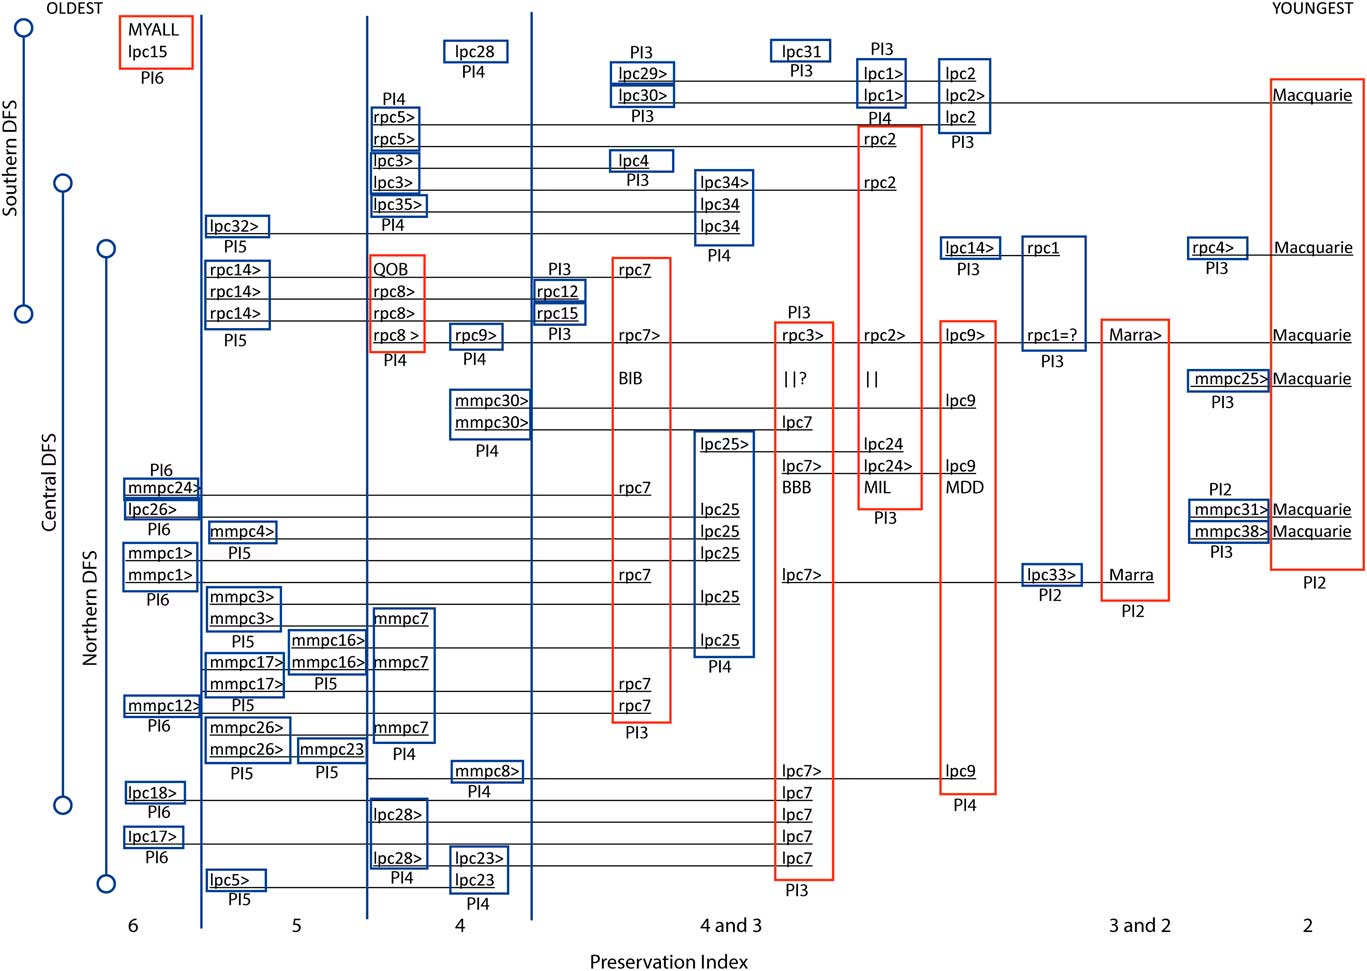
The mapping of palaeochannels and their crosscutting relationships and degree of preservation allowed the construction of a sequence of formation for 50 rivers and palaeochannels (Fig. 5). The dated palaeochannels can be fitted into this sequence to give a numerical time frame. The sequence is based primarily on the mapped crosscutting relationships. Secondarily, between palaeochannels constrained by clear crosscutting relationships or for palaeochannels not constrained by crosscutting relationships, we have considered the palaeochannel preservation to suggest possible relative ages. The remaining palaeochannels (not shown in Fig. 5) are mostly shorter and isolated reaches and are difficult to place in the sequence, because their continuity and crosscutting relationships cannot be inferred. Likewise, the southwestern portion of the DFS could not be interpreted easily, because the nearly parallel palaeochannels have few crosscutting relationships.
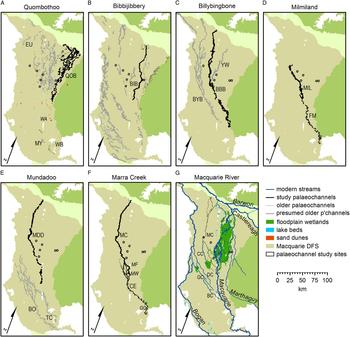
(colour online) Sequence of palaeochannel formation derived from luminescence ages, crosscutting relationships, and preservation index from oldest (left) to youngest (right). Individual palaeochannels are indicated by boxes (blue for undated channels or red where luminescence dating is available) and codes (rpc, lpc, or mmpc for left bank, right bank, and Macquarie Marshes palaeochannels, respectively). Crosscutting relationships (underlines) observed by mapping of the light detection and ranging digital elevation model (LIDAR DEM) are the primary criterion for arrangement of palaeochannels. Known relative age by crosscutting relationships is indicated by>or=symbols. Where not constrained (or between constraints) by crosscutting relationships or luminescence dating, the preservation index (PI above or below each box) has been used to suggest the relative age. As well as the modern Macquarie River, 49 palaeochannels are shown, including all 28 palaeochannels >50 km in length and all 15 palaeochannels 25–50 km in length (Supplementary Table S1). Dated palaeochannels are indicated by codes: BBB, Billybingbone; BIB, Bibbijibbery; MDD, Mundadoo; MIL, Milmiland; QOB, Quombothoo (Table 2). Sequential maps derived from the framework of Fig. 4 show the channel evolution (Fig. 6). For example, the older palaeochannels of the central northern area are conspicuous to the west of the large Quombothoo palaeochannel (Fig. 6a). Source-bordering sand dunes are associated (albeit not exclusively) with meander plains of the Quombothoo palaeochannel and suggest the buried course of the palaeochannel to near the latitude of Warren. The upper reach of the Quombothoo palaeochannel is single thread, large, and sinuous with a few straighter, short, splay channels. In the lower reaches, up to three parallel Quombothoo palaeochannels occur and are most likely channels abandoned by rapid avulsion. Only the undated Euligal palaeochannel (lpc32) in the northwest approaches the Quombothoo palaeochannel in size. The poorer preservation of this palaeochannel suggests it may be older than the Quombothoo palaeochannel.

The palaeochannels we selected for OSL dating, therefore, constrain much of the sequence in the north and centre of the Macquarie DFS. A single TL age (WR25, Trangie Formation, 127±16 ka) (Watkins, Reference Watkins1992) comes from an isolated trace palaeochannel in the south of the DFS that we have called “the Myall palaeochannel” to distinguish it from the broader alluvial surface with which it was identified by Watkins (Fig. 5). Other palaeochannels in the area, including Boggy Cowal (lpc1; Fig. 5, Supplementary Table S1) and Trangie Cowal (lpc2), are continuous and partly filled but of unknown age relative to our dated palaeochannels. A large number of palaeochannels in the central northern area in and around the Macquarie Marshes are older than the Bibbijibbery and Billybingbone palaeochannels and most likely older than the Quombothoo palaeochannel (Fig. 5).
The Bibbijibbery palaeochannel (Fig. 6B) is a continuous, partly filled palaeochannel that is very visible in the northeastern DFS. Its much smaller wavelength and amplitude and narrower channel contrast greatly with the nearby Quombothoo palaeochannel. A number of undated palaeochannels, especially in the south and west, may be older or of similar age to the Bibbijibbery palaeochannel. All of these palaeochannels are similar in size or smaller than the Bibbijibbery palaeochannel. The Billybingbone palaeochannel (Fig. 6C) has a similar morphology to the Bibbijibbery palaeochannel, but is slightly less infilled and continuous over a greater distance (total 160 km), and includes the Marebone palaeochannel (rpc 3) on the right bank of the modern Macquarie River. Short, straighter splays are evident in the lower reaches. The leveed Yarrawell palaeochannel, which forms an alluvial ridge bounding the western side of the Macquarie Marshes, is the only palaeochannel identified to have possibly formed in the period between the Bibbijibbery and Billybingbone palaeochannels. The Yarrawell palaeochannel is less well preserved than the Billybingbone palaeochannel but does not intersect it. However, the Yarrawell palaeochannel is clearly cut by the Milmiland palaeochannel at its upper end. The Milmiland palaeochannel (Fig. 6D) also crosscuts the Billybingbone palaeochannel and is of similar size and planform. While the Milmiland palaeochannel (including Five Mile Cowal, its upstream right-bank continuation) is a single-thread channel, the Bugwah Cowal/Yangunyah Cowal/Boomi Creek palaeochannel to the west is an older abandoned palaeochannel, with multiple (possibly successive) courses in its lower reaches (Fig. 6C).
Sequential development of drainage on the Macquarie distributive fluvial system. (A–F) Each panel shows one dated palaeochannel (thick black lines) and older palaeochannels (thin black lines) formed since the time of the previous panel, confirmed by crosscutting relationships or assumed because of preservation status (grey lines). (G) The modern Macquarie River and other contemporary streams (blue) with modern floodplain wetlands (green). BBB, Billybingbone; BC, Belaringar Creek; BO, Boggy Cowal; BIB, Bibbijibbery; BYB, Bugwah/Yangunyah/Boomi; CC, Crooked Creek; CE, Crooked/Ewenmar; DC, Duck Creek; EU, Euligal; FM, Five Mile Cowal; GC, Gunningbar Creek; GG, Gin Gin; MC, Marra Creek; MDD, Mundadoo; MF, Mount Foster; MIL, Milmiland; MW, Marebone Weir; MY, Myall palaeochannel; QOB, Quombothoo; TC, Trangie Cowal; WA, Warren; WB, Weemabah source-bordering sand dune; YW, Yarrawell. Small squares show the location of field sites (Figs. 3 and 4). (For interpretation of the references to colour in this figure legend, the reader is referred to the web version of this article.)

The Mundadoo palaeochannel (Fig. 6E) is closely associated with Marra Creek (Fig. 6F). Both channels follow the same broad course, but the Mundadoo palaeochannel is found as a set of clearly larger (both in width and wavelength) cutoff bends and reaches. Both palaeochannels are confined laterally by the alluvial ridges of the Billybingbone and Bugwah/Yangunyah/Boomi palaeochannels, which may account for the absence of distributary channels along the Mundadoo or intermediate-age palaeochannels in this area. We speculate that the Boggy Cowal and perhaps the Trangie Cowal (superficial expression) palaeochannels date from the interval between the Milmiland and Mundadoo palaeochannels, based on their relative preservation (Fig. 4). A sand dune bordering Trangie Cowal at Weemabah (Fig. 6A) yielded TL ages of 61.8±9.1 and 66.5±4.5 ka (Supplementary Table S2). The dune is partly buried by fine-grained sediment, and it is likely that the visible channel of Trangie Cowal does not reflect the palaeochannel from which the dune was formed, but these ages do constrain the maximum age of the surficial Trangie Cowal palaeochannel. Marra Creek is the lower course of a palaeochannel system that can be traced to Ewenmar and Crooked Creeks from near Gin Gin at the upper end of the DFS. The intermediate reach, around Marebone Weir and Mount Foster, is one of a complex network of palaeochannels of similar size, apparently the product of multiple avulsions rather than the channel breakdown characteristic of the current Macquarie Marshes. Marra Creek clearly crosscuts the Mundadoo palaeochannel and is much smaller.
Marra Creek is presently a regulated channel fed by a canal from Marebone Weir on the Macquarie River (Fig. 6G). However, the LIDAR DEM reveals only small marsh channels naturally connecting it to the Macquarie floodplain before excavation of the canal. Previously, Marra Creek probably only carried high-stage overbank floodwaters from the Macquarie River and was therefore partly abandoned. This is a similar configuration to several left-bank palaeochannels of the Macquarie (including Crooked Creek, Duck Creek, Gunningbar Creek, and Belaringar Creek), which are now all connected by canals to the Macquarie to facilitate transfer of water for stock and irrigation across the DFS. In a similar way, the natural floodplain wetlands of the Macquarie and Crooked Creek have been partly canalised to facilitate water transfer but naturally are areas of channel contraction, termination, and overbank flow. Such areas, with their characteristic surface pattern of reticulate marsh channels (Yonge and Hesse, Reference Yonge and Hesse2009) are only observed around the modern channel system and not the palaeochannels.
Palaeochannel morphology, stratigraphy, and sedimentology
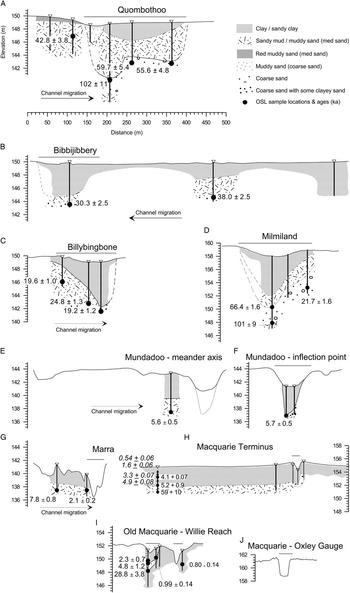
The Quombothoo palaeochannel (Fig. 7A) is a large, sinuous but discontinuous, broad, shallow, and partly infilled depression with elevated red sandy deposits on the inside of the meander bends. Sand dunes locally flank the channel downstream of Marebone Weir, probably derived from point bar deposits (Fig. 6A). Meander wavelengths are 6 to 8 times larger than either the Billybingbone or Bibbijibbery palaeochannels and 21 times larger than the modern river at Oxley (Table 3). The surface expression shows that this palaeochannel has migrated across a belt up to 6 km wide. The palaeochannel is partly infilled by clay mixed with fine to coarse sand (Fig. 7A). Coarse bedload was reached at approximately 6 m depth in the centre and concave bank of the palaeochannel and at 8.2 m depth on the convex bank. The deposits from the small inset palaeochannel on the convex bank of the broader palaeochannel are dominated by muddy coarse sand (Fig. 7A), but material below 2.4 m depth was not obtained due to hole collapse. We interpret this as a much later, small channel following the course of the palaeochannel, now infilled with sand derived from the surface sandy banks. The width of the palaeochannel estimated from the cross section is 250 m, although the concave bank is not well defined at the surface or from the lithostratigraphy. The average width of the Quombothoo palaeochannel from the LIDAR DEM in the sampled reach is 284 m (Table 3). The palaeochannel depth is at least 8.2 m and possibly as much as 10 m.
Macquarie palaeochannel cross sections showing lithostratigraphy, OSL sample location, and calculated ages (ka). All cross sections are shown at the same scale. Elevation is given in metres above sea level (Australian Height Datum). Inferred palaeochannel boundaries are shown by solid and dashed lines. Channels are arranged from oldest (A) to youngest (J). Oxley gauge (J) is located upstream of the anastomosing reach of the modern Macquarie River before the river breaks down into floodplain wetlands. The Terminus site (H) lies downstream of Oxley and was historically (nineteenth century) the terminal reach of the Macquarie River before it broke down and entered the reed beds (Yonge and Hesse, Reference Yonge and Hesse2009). Old Macquarie at Willie (I) is a recent meander cutoff of the river downstream of the Terminus marshes where the river re-forms before again breaking down into wetlands further downstream (Larkin, Reference Larkin2012).

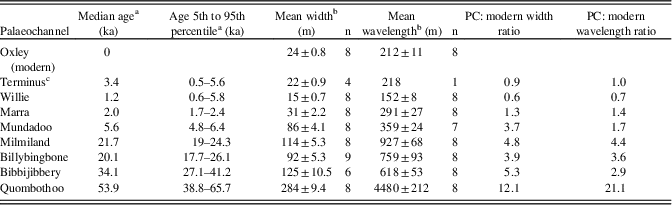
Channel ages and dimensions for sample sites.

a Median (50th percentile), 5th percentile, and 95th percentile ages from summed probability density functions (PDFs) of all accepted ages for each palaeochannel.
b Mean width and wavelength derived from light detection and ranging digital elevation model (LIDAR DEM) with standard error.
c The Terminus is the historically abandoned channel, downstream of Oxley, active until the early twentieth century. Its “median age” includes only numerical ages from sediment associated with the abandoned channel.
The Bibbijibbery palaeochannel (Fig. 7B) is a broad, shallow, continuous, and partly filled sinuous depression. There is little surficial evidence of channel migration other than being much wider at meander bends than at inflection points (Figs. 3 and 4). Coarse sandy loam bedload below around 6 m depth in the palaeochannel is overlain by smectite-rich clays containing some fine to medium sands, (Fig. 7B). A distinct sand layer below 5.3 m depth on the point bar is interpreted as bedload deposits from the migrating channel. The upper 3 m of the point bar core is dominated by clay, but the sand is finer and less abundant above 3 m depth. The average palaeochannel width in the sampled reach of Bibbijibbery is 125 m.
The Billybingbone palaeochannel is a shallow, partly filled, continuous, meandering (tortuously in places) depression with evidence of lateral migration and downstream translation (Figs. 3 and 4). Coarse sandy palaeo-bedload below 6–7.5 m depth is overlain by clay infill (Fig. 7C). The elevation of the bedload increases toward the inside of the meander bend, interpreted as bedload covered by point bar deposits and then fine-grained channel infill. At the channel margin, sand and muddy sand point bar, or ridge and swale, deposits (1.5 m depth) underlie fine-grained floodplain deposits. The average width in the sampled reach measured from the LIDAR DEM of Billybingbone palaeochannel is 92 m.
The Milmiland palaeochannel is a partly filled, meandering channel with well-defined banks. Clay was found in the base of the deepest core, overlain by alternating sand and gravel bedload layers from 10.4 to 7.7 m depth, in turn overlain by sandy clay to 5.9 m depth and clay infill above (Fig. 7D). Downstream, the palaeochannel is partly reoccupied by water escaping Buckiinguy marsh, and this water is contained within the palaeochannel until it meets Marra Creek. The average palaeochannel width is 114 m.
The Mundadoo palaeochannel is a series of large, partly filled, single cutoff meanders and reaches of meandering channel close to Marra Creek, but distinguished by its much larger dimensions (Fig. 3, Table 3). The palaeochannel is only partly filled with clay (Fig. 7E and F) above medium sands with some clay (sandy loam). The reach average palaeochannel width is 86 m.
Marra Creek, adjacent to the Mundadoo palaeochannel (Fig. 4), is a complex channel comprising reaches of reoccupied (and modified) Mundadoo palaeochannel and reaches of newer (Marra Creek–phase) palaeochannel. The Marra Creek–phase palaeochannel was in turn largely abandoned by the time of European occupation (thus meeting the definition of a palaeochannel) but has since been reoccupied by flows diverted by Marebone Weir. The Marra Creek–phase palaeochannel has distinctly smaller and less regular meanders than the Mundadoo palaeochannel. In these reoccupied reaches it is clearly underfit with evidence of oblique and vertical accretion within the channel margins. The Marra Creek–phase palaeochannel is narrow and steep-sided, with an average channel width of 31 m (Fig. 7G). Prominent ridges on the inside of the meander had sandy clay beneath a clay cover. Sand and gravel bars on the bed of Marra Creek are most likely derived from erosion of Milmiland-age (or older) palaeochannel deposits in the banks.
OSL dating results
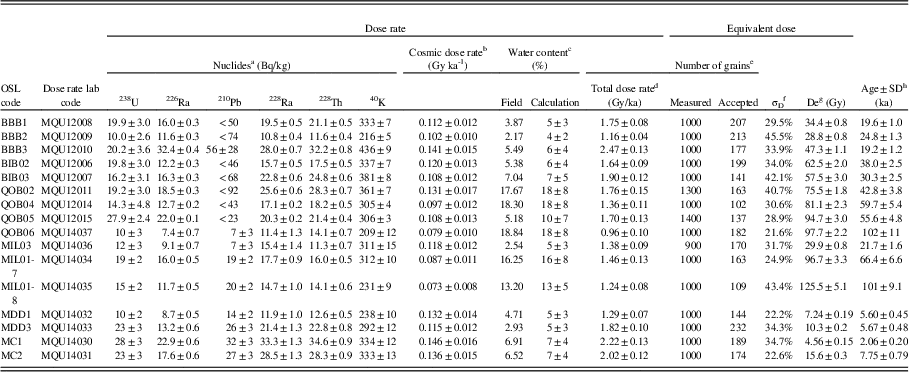
Lithogenic radionuclide concentrations (Table 4) show that the thorium decay chains are in secular equilibrium (Olley et al., Reference Olley, Murray and Roberts1996) for the 16 Macquarie palaeochannel samples, with all but one falling within 10% of equilibrium and MIL03 within 20%. While the U-series results suggest disequilibrium for some samples (two are within 30% and one is within 50%), Olley et al. (Reference Olley, Murray and Roberts1996) note that if the dose rates measured are assumed to have prevailed since burial, then the errors for this level of disequilibria are likely to be <3%.
Single-grain optically stimulated luminescence (SG-OSL) ages and analytical data of Macquarie palaeochannels.

a Concentrations determined from high-resolution gamma spectrometry measurements of dried and powdered sediment sample.
b Time-averaged cosmic-ray dose rates (for dry sample), each assigned an uncertainty of ±10%.
c Water contents, expressed as (mass of water/mass of dry sample)×100. The “calculation” values were used to calculate the total dose rates and OSL ages.
d Mean±total (1σ) uncertainty, calculated as the quadratic sum of the random and systematic uncertainties. An internal dose rate of 0.03 Gy/ka is also included.
e Total number of grains processed and total number accepted.
f Dispersion of single-grain equivalent doses.
g Due to the fluvial environment and overdispersion of many samples, the minimum age statistical model (MAM) was used to determine the equivalent dose.
h Uncertainties at 68% (1σ) confidence interval.
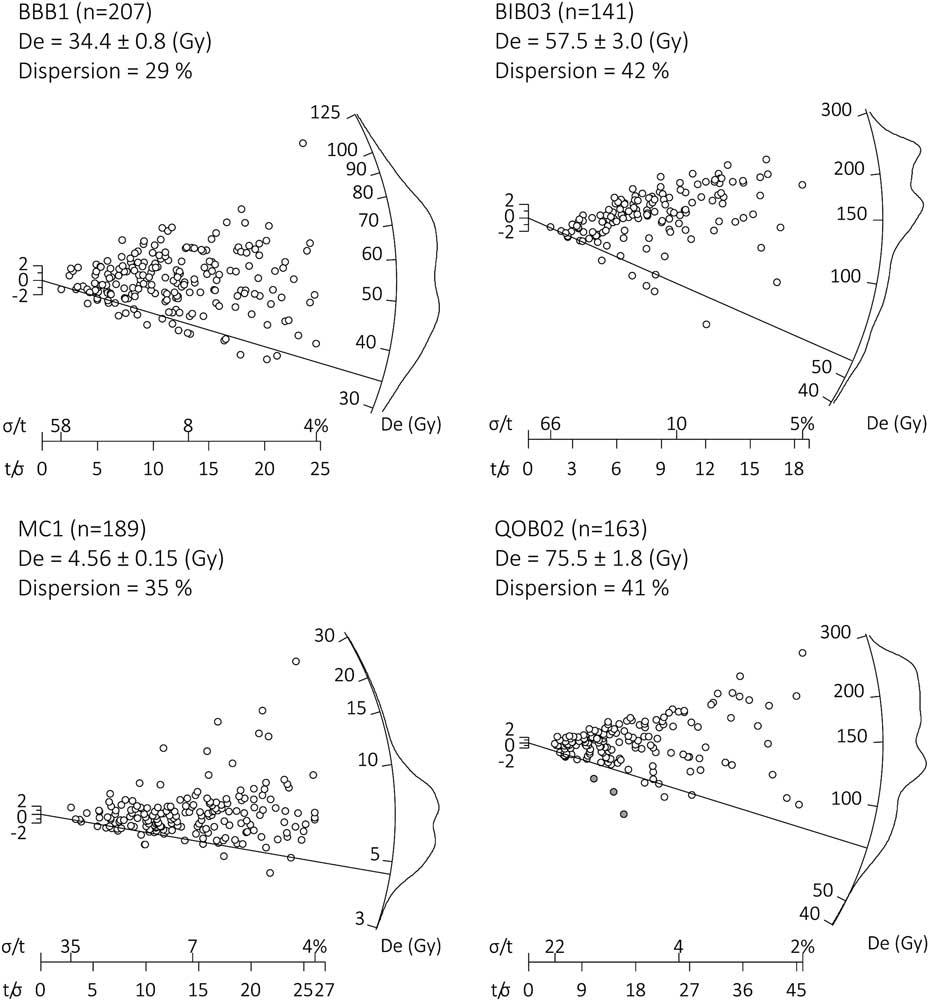
The minimum age model (MAM) was considered the most appropriate model for determining palaeochannel ages, as all samples display equivalent dose (De) distributions that indicate heterogeneous bleaching, typical of fluvial sediments (Fig. 8). We assumed an overdispersion of 10% based on the spread of De in a modern analog sample.
Selected radial plots (with KDE (kernel density estimate) on the radial scale or y-axis) for SG-OSL analyses showing the MAM De (Equivalent dose) result (solid line). All radial plots are shown in Supplementary Fig. S1.

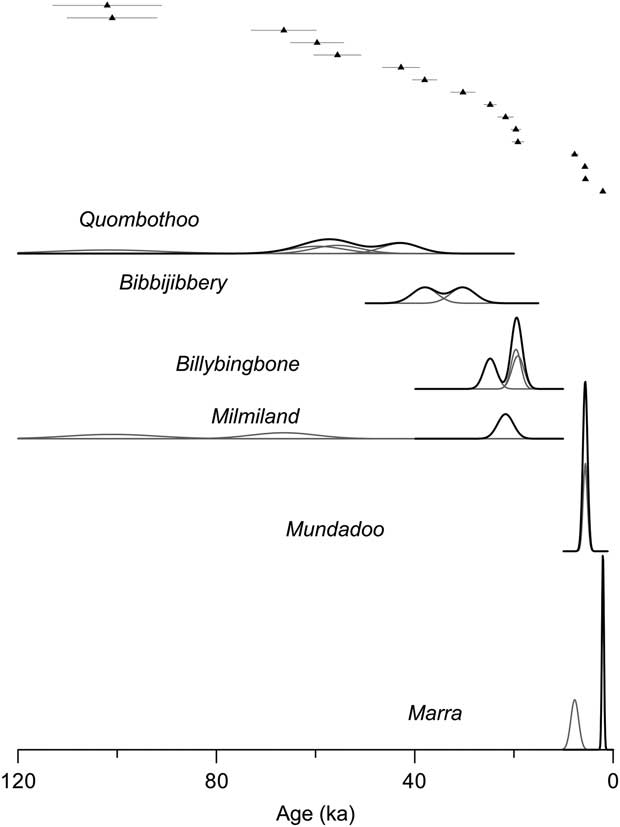
We infer that the age of the Quombothoo palaeochannel is represented by three younger SG-OSL ages (42.8±3.8 ka, 55.6±4.8 ka, and 59.7±5.4 ka) (Fig. 9). The deepest Quombothoo sample returned an age of 102±11 ka, which we interpret as being from an older underlying unit.
Probability density (PD) curves (all at the same vertical scale) and ranked age plot (top) for all OSL ages from the six palaeochannels. Individual age-determination PD curves are shown by grey lines, and the sum for each palaeochannel is shown by black lines. Several samples have been excluded from the sum, or accepted age, for Quombothoo, Milmiland, and Marra palaeochannels, where they appear to have reached older, underlying units (see text). Median (50th percentile) ages and 95% probability for each palaeochannel were calculated from these summed PD curves.

The Bibbijibbery palaeochannel samples are from the upper palaeochannel sediments at two points along the meander axis. The younger sample (30.3±2.5 ka) is near the apex of the meander bend, while the older sample (38.0±2.5 ka) is beneath the floodplain deposits on the inside of the formerly migrating meander (Fig. 7B). These dates are taken to represent the period of activity of this palaeochannel and hence provide a maximum age for abandonment. The SG-OSL ages for the Billybingbone palaeochannel (19.2±1.2 ka, 19.6±1.0 ka, and 24.8±1.3 ka) were taken at a depth immediately below fine-grained channel-filling muds (Fig. 7C) and, therefore, likely soon before abandonment.
Only one sample from the Milmiland palaeochannel (21.7±1.6 ka) appears to give an age representing the time of channel activity. Two deeper samples are much older (66.4±6.6 ka, 101±9.1 ka) and do not overlap with the younger age at 2σ (Fig. 9). We interpret these samples to belong to an older unit not clearly identifiable in the stratigraphy. Both SG-OSL ages from the Mundadoo palaeochannel yielded similar ages (5.6±0.5 ka and 5.7±0.5 ka), distinctly older than one of the two ages from Marra Creek palaeochannel (2.1±0.2 ka). The older age at Marra Creek (7.75±0.8 ka), from the distal floodplain, we interpret as Mundadoo-age sediment preserved beneath the margin of the inset Marra floodplain.
DISCUSSION
The chronological, sedimentological, and morphological data allow us to reconstruct the evolution of the Macquarie River over the last 54 ka. In combination with the results of earlier studies, we can infer the climate changes, and catchment hydrologic responses producing these changes.
Palaeochannel Chronology
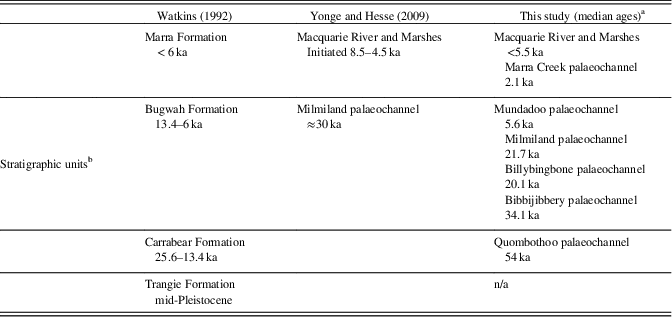
In addition to the OSL chronology detailed earlier, crosscutting relationships indicate the relative age of some dated palaeochannels. The median OSL ages (Table 4) of the Quombothoo and Bibbijibbery palaeochannels confirm the mapped relationship showing that Quombothoo is the older palaeochannel. There is a small overlap of the age distributions at 2σ, suggesting a rapid transition from the very large Quombothoo palaeochannel (284 m width, median age 54 ka) to the narrower Bibbijibbery palaeochannel (125 m width, median age 34 ka) (Fig. 9).
Our SG-OSL ages for these palaeochannels are mostly younger than previous single aliquot ages. These differences are mostly due to our recognition of the scatter of equivalent doses (Fig. 8) and application of the MAM. Yonge and Hesse (Reference Yonge and Hesse2009) previously dated Milmiland Creek palaeochannel to ~30 ka by SA-OSL, but crosscutting relationships indicate that it is younger than the Billybingbone palaeochannel (median age 20.1 ka by SG-OSL MAM) and older than the Marra Creek palaeochannel. Based on the single accepted SG-OSL MAM age (Table 4), the age of 21.7 ka for the Milmiland palaeochannel overlaps broadly with the age of the Billybingbone palaeochannel. Upstream of the sample sites, the LIDAR DEM reveals that the Milmiland palaeochannel derives from the same system as the Billybingbone palaeochannel (Fig. 3). We infer that the Milmiland palaeochannel formed by avulsion from the Billybingbone, leading to the abandonment of that palaeochannel downstream. The new Milmiland palaeochannel cuts across the Billybingbone palaeochannel and is incised below the level of the Billybingbone plain in the area between the two sample sites. The very similar ages reflect the rapid avulsion process.
Sediment adjacent to the Marra Creek palaeochannel has a TL age of 6.4±0.7 ka (Watkins, Reference Watkins1992), whereas our new SG-OSL age is 2.1±0.2 ka (single accepted age), consistent with the older (by crosscutting relationship) Mundadoo palaeochannel (median age 5.6 ka). It is possible that Watkins (Reference Watkins1992) dated underlying Mundadoo-age sediment (instead of the Marra Creek palaeochannel) as we suspect we did in the case of our older Marra sample.
Most palaeochannels are associated with thin sedimentary sequences representing lateral migration and point bar and/or oblique accretion rather than extensive vertical accretion. Deeper coring in the Milmiland and Quombothoo palaeochannels appears to have penetrated below the sediments associated with those palaeochannels (Fig. 7A and D). Yonge and Hesse (Reference Yonge and Hesse2009) also found older sediments (dated by single-aliquot OSL to 59±10 ka and 42±7 ka), not directly identifiable with a palaeochannel, beneath the Holocene Terminus and Buckiinguy marsh sediments. Using SG-OSL, Yu et al. (Reference Yu, Garcia, Chivas, Tibby, Kobayashi and Haynes2015) found sediment dating to 28 ka at 1.5 m depth, beneath late Holocene marsh sediments at Louden’s Lagoon (Fig. 2) in the northern Macquarie Marshes, and at Willie on the Old Macquarie (Larkin, Reference Larkin2012), a thin veneer of Late Holocene channel fill overlies older sandy clays dated to 28.8±3.8 ka (Fig. 7J).
We have found older ages for the Macquarie palaeochannels than the previous chronology based on TL ages (Table 5). Watkins (Reference Watkins1992) identified four phases of fluvial activity on the Macquarie plain on the basis of TL dating. The youngest, Marra Formation, including Marra Creek and the modern Macquarie River, was dated from 6 ka to the present. The Bugwah Formation (13.4–6 ka) as mapped includes both the Billybingbone (median age 20.1 ka) and Milmiland (21.7 ka) palaeochannels and, morphologically, would also likely include the Mundadoo (5.6 ka) and Bibbijibbery (34.1 ka) palaeochannels. The new SG-OSL ages suggest that the Bugwah Formation ages given by Watkins (Reference Watkins1992) are too young. The older Carrabear Formation described by Watkins (Reference Watkins1992) includes the Quombothoo palaeochannel, but the TL ages (13.4 ka and 25.6 ka; Watkins, Reference Watkins1992) are also far too young compared with the SG-OSL ages presented here for the Quombothoo palaeochannel (median age 53.9 ka). The even older Trangie Formation remains undated by OSL. It is possible that the systematically younger ages found by Watkins (Reference Watkins1992) are due to shallow sampling from pits around 1 m deep. This may have led to sampling of postabandonment sediment or sediment affected by bioturbation following abandonment.
Comparison of palaeochannel ages with previous temporal frameworks.

a Palaeochannels mapped to respective formations by Watkins and Meakin (Reference Watkins and Meakin1996).
b From Watkins and Meakin (Reference Watkins and Meakin1996).
From our age assessments, we conclude that the Marra Creek palaeochannel formed and was abandoned in the late Holocene, and the Mundadoo palaeochannel in the mid-Holocene, and that the Milmiland and Billybingbone palaeochannels were active in the last glacial maximum (LGM), the Bibbijibbery palaeochannel during late Marine Oxygen Isotope Stage 3 (MIS 3), and the Quombothoo palaeochannel during early MIS 3.
We propose that the development of the southern Macquarie Marshes in conjunction with the modern hydrologic regime began about 5.6–5.2 ka. The historical Terminus of the Macquarie River formed after around 5.2 ka (Yonge and Hesse, Reference Yonge and Hesse2009; Fig. 7I), shortly after the Mundadoo palaeochannel was active (5.6 ka). Although limited by few ages, we propose that abandonment of the Mundadoo palaeochannel resulted in the accumulation of sediment in the Terminus and nearby Buckiinguy marsh sediments (Yonge and Hesse, Reference Yonge and Hesse2009), deposition by the Old Macquarie at Willie (Larkin, Reference Larkin2012; Fig. 7J), and the reduction in size of Marra Creek. This hydrologic regime is characterised by small, contracting channels, extensive overbank flooding, large expanses of floodplain wetlands, and little water and sediment from the Macquarie River making its way through to the Barwon River.
Decline of the Macquarie River
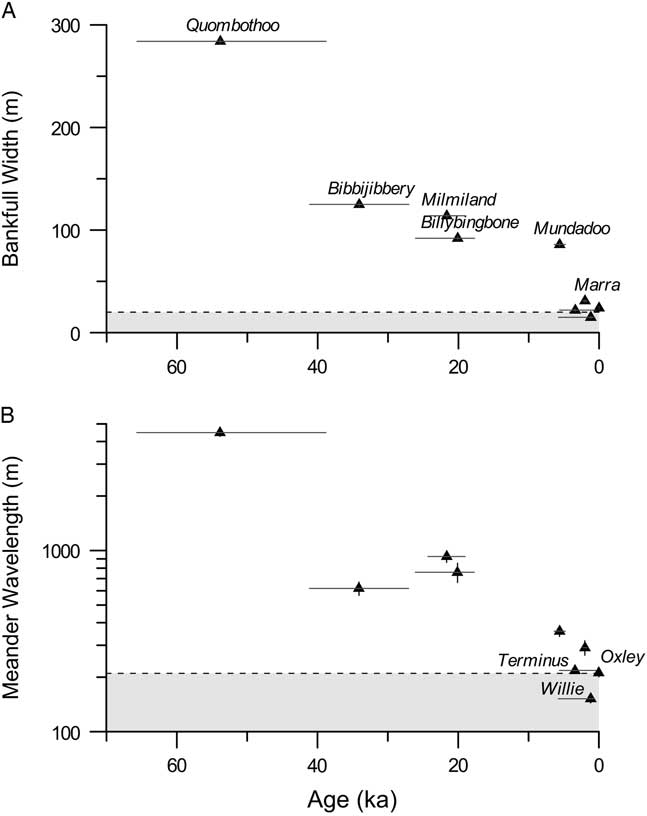
Combining the palaeochannel chronology with the palaeochannel dimensions (Fig. 10), it is possible to quantify the decline of palaeochannel width and infer a relative decline in bankfull discharge between the early MIS 3 Quombothoo palaeochannel and late MIS 3 Bibbijibbery palaeochannel, and the later further decrease of river discharge between the mid-Holocene Mundadoo and late Holocene Marra, Terminus and Willie (Old Macquarie) palaeochannels. The trend of decreasing river bankfull width (Fig. 10A) and meander size (wavelength) (Fig. 10B) between ≈54 ka and ≈2 ka is unequivocal, but quantifying palaeo-discharges is more problematic.
Palaeochannel age against palaeochannel bankfull width (A) and meander wavelength (B) for the Macquarie distributive fluvial systems (DFS). The 95% probability of combined optically stimulated luminescence (OSL) ages is shown. Standard error of width and wavelength measurements is shown but is mostly smaller than the symbol size. The dashed lines and shaded areas represent the proposed thresholds for channel stability and zones of channel breakdown and floodplain wetland formation.

A range of approaches has been used previously to quantify palaeochannel morphometrics and to calculate palaeo-discharge of Murray-Darling basin palaeochannels. Page and Nanson (Reference Page and Nanson1996) applied Manning’s equation to the Murrumbidgee palaeochannels; and Dury’s (Reference Dury1976) empirical relationship between meander wavelength and bankfull discharge has been applied to the Namoi (Young et al., Reference Young, Young, Price and Wray2002), Gwydir (Pietsch et al., Reference Pietsch, Nanson and Olley2013), and Lachlan (Kemp and Rhodes, Reference Kemp and Rhodes2010) palaeochannels. Dury (Reference Dury1976) also derived an empirical relationship between channel-bed width and bankfull discharge. Dury’s equations have the advantage that fewer variables are required, and these can be measured accurately. However, his equations may not be directly applicable for the Macquarie palaeochannels; for example, whereas Dury (Reference Dury1976) found an approximate ratio of 11:1 for channel wavelength to bed width (L/W), the Macquarie palaeochannels have a L/W ratio of at least 15:1 (from data in Table 3). Because bankfull width is larger than bed width (which we could not derive reliably for infilled palaeochannels), the ratio L/W must be higher than 15:1 for these palaeochannels. This discrepancy is due to the unusual hydraulic geometry of Murray-Darling basin channels, which undergo a downstream loss of discharge on a declining slope (Kemp and Rhodes, Reference Kemp and Rhodes2010; Pietsch and Nanson, Reference Pietsch and Nanson2011). For these reasons, we have chosen not to estimate palaeo-discharge; rather, we simply infer that both meander wavelength and channel width positively correlate with river discharge, governed by poorly constrained power relationships.
Although the Macquarie River in the early twentieth century was a single-thread channel all the way to Oxley, we cannot be certain that this was the case for the palaeochannels. Therefore, each palaeochannel must be regarded as having been formed by bankfull discharges that were minima for the system as a whole. Nevertheless, palaeochannel mapping (Fig. 5) suggests that most of the palaeochannels were indeed continuous, single-thread channels rather than anastomosing channels. Where branching was observed, it was in the form of short, straight distributary channels and splays escaping the leveed meandering channels, which terminated on the floodplain (Tooth, Reference Tooth2005).
There was a large decline in size of the Macquarie between the Quombothoo (median age 54 ka) and Bibbijibbery (median age 34 ka) palaeochannels. While the meander wavelength decreased sevenfold and the bankfull width by more than half (Fig. 10, Table 3), both palaeochannels maintained continuous, sinuous, laterally migrating channels across the Macquarie DFS to the floodplain of the Barwon River (trunk stream) downstream (Fig. 2). This decrease of bankfull discharge, while large, evidently was still within the range sufficient to maintain the same meandering fluvial style.
A second large decline in bankfull width and meander wavelength corresponded with abandonment of the Mundadoo palaeochannel and avulsion to the modern course of the lower Macquarie River about 5.5 ka. The diminished discharge associated with these reductions was probably integral to the breakdown of the formerly throughgoing river channel and formation of the Macquarie Marshes (Ralph and Hesse, Reference Ralph and Hesse2010).
Collectively, these data indicate ongoing decline in the size and discharge of the Macquarie River since mid-MIS 3 and, in the late Holocene, a threshold change in fluvial style. The 285-m-wide Quombothoo palaeochannel was larger than any extant river in the Murray-Darling basin, even the lower Murray River (160–220 m downstream of its confluence with the Darling River). By contrast, the Macquarie River at Oxley is now just 24 m wide. Below Oxley, the river declines in width (and discharge) to 22 m at the Terminus before breaking down into unchannelled marshes, re-forming at the Old Macquarie (15 m wide at Willie), and then breaking down again. These data suggest, in the Macquarie DFS at least, that there is a threshold of around 20 m width (Fig. 10A) or 210 m wavelength (Fig. 10B) below which channels can no longer maintain themselves against the opposing forces of vegetation encroachment, sediment accumulation, and enhanced overbank flow and avulsion (Yonge and Hesse, Reference Yonge and Hesse2009; Ralph and Hesse, Reference Ralph and Hesse2010). Gauging data (at Oxley and downstream at Pillicawarrina; New South Wales Office of Water data, http://realtimedata.water.nsw.gov.au, accessed 12 Dec 2016) suggest that the bankfull discharge threshold is around 20 m3/s. This equates to specific stream power of around 2–3 W/m on the lower Macquarie River (Ralph and Hesse, Reference Ralph and Hesse2010).
Late Quaternary river response to climate-driven hydrologic change
River discharge is a complex and indirect proxy of climate. While it is useful to know the magnitude of the channel-forming flood, its relationship to average annual discharge, catchment runoff, or, ultimately, precipitation is complicated by the many links within the hydrologic system. In Australia, the large size of late Pleistocene (dominantly within MIS 2 and 3) palaeochannels compared with modern channels has long been recognised (Butler, Reference Butler1950; Pels, Reference Pels1964a, Reference Pels1964b; Bowler, Reference Bowler1967; Schumm, Reference Schumm1968). However, these large palaeochannels have not typically been associated with greater precipitation, as the landmark study of Galloway (Reference Galloway1965) demonstrated the potential for temperature to influence runoff. Subsequently, several mechanisms have been proposed to account for large late Pleistocene (including LGM) palaeochannels. Many invoke lower temperatures in the upper catchment to both sustain larger snowpacks and enhance associated seasonal snowmelt and to reduce evapotranspiration and increase runoff efficiency (Page et al., Reference Page, Nanson and Price1996; Kemp and Rhodes, Reference Kemp and Rhodes2010; Reinfelds et al., Reference Reinfelds, Swanson, Cohen, Larsen and Nolan2014). This explanation has been commonly proposed for southern Murray-Darling basin rivers (Goulburn, Murray, Murrumbidgee, and Lachlan) that have small alpine areas within their catchments today (Langford-Smith, Reference Langford-Smith1959, Reference Langford-Smith1960; Bowler, Reference Bowler1978; Page et al., Reference Page, Nanson and Price1996, Reference Page, Kemp and Nanson2009; Kemp and Rhodes, Reference Kemp and Rhodes2010; Reinfelds et al., Reference Reinfelds, Swanson, Cohen, Larsen and Nolan2014). Alternatively, a northerly source of enhanced precipitation associated with a warm Coral Sea has been proposed to explain larger palaeochannels in the Gwydir catchment at times of lower sea level than today (Pietsch et al., Reference Pietsch, Nanson and Olley2013). Today, the Coral Sea is the largest moisture source for eastern and northern Australia (Gimeno et al., Reference Gimeno, Drumond, Nieto, Trigo and Stohl2010), especially in summer.
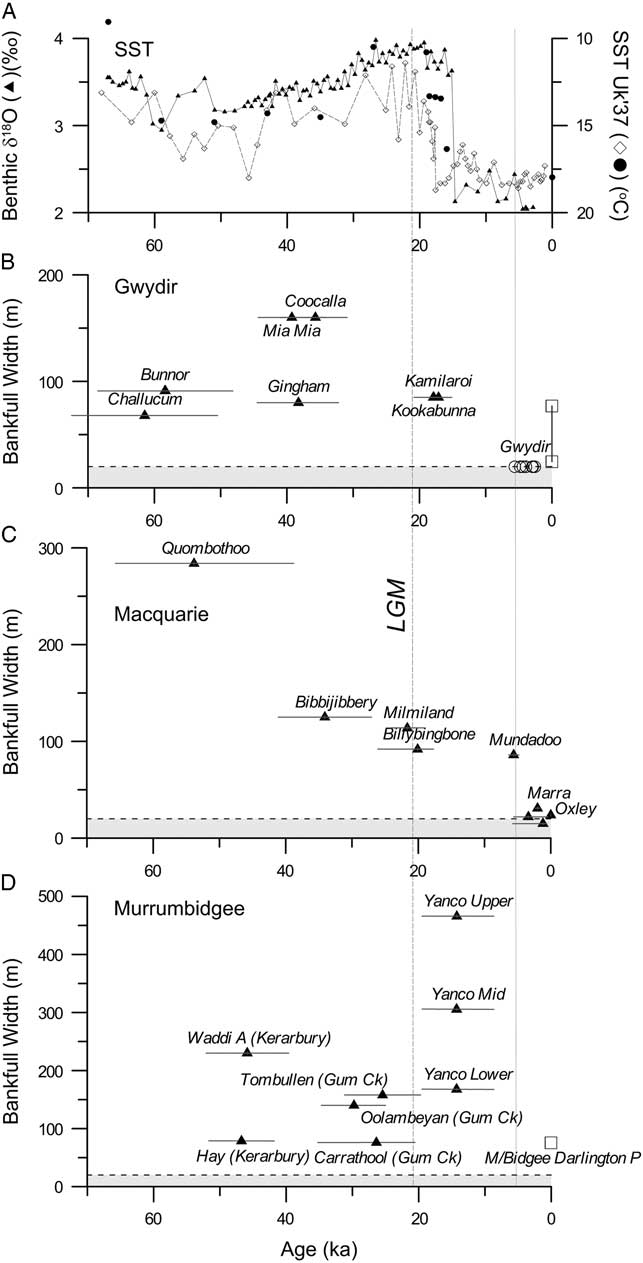
We can begin to evaluate the ability of either of these mechanisms to explain the scale of the Macquarie palaeochannels by considering the catchment characteristics and timing of events. Modern Snowy Mountains hydrologic patterns (Reinfelds et al., Reference Reinfelds, Swanson, Cohen, Larsen and Nolan2014) translated to known LGM cooling would allow for a threefold increase in catchment runoff at lower altitudes. The LGM Billybingbone and Milmiland palaeochannels were four to five times larger (bankfull width and meander wavelength) than the equivalent modern Macquarie channel (Table 3). The log-linear relationship between these channel dimensions and bankfull discharge (Dury, Reference Dury1976) predicts a bankfull discharge more than three times greater and therefore larger than that predicted by temperature change alone. Nevertheless, temperature could, and probably did, form part of the mix of factors operating to produce these systems. However, the observed pattern of palaeochannel size declining over time (Figs. 10 and 11) does not track the global temperature record and, therefore, temperature is not the only driver of the changes seen in the Macquarie or Gwydir catchments.
Sea-surface temperature and marine oxygen isotope record (A) compared with palaeochannel widths of the Gwydir (B), Macquarie (C), and Murrumbidgee (D) Rivers. Uk'37 sea-surface temperature (SST) records are from the Great Australian Bight core MD03-2607 (diamonds) (Lopes dos Santos et al., Reference Lopes dos Santos, Spooner, Barrows, de Deckker, Sinninghe Damste and Schouten2013) and eastern Tasman Sea core DSDP593 (circles) (McClymont et al., Reference McClymont, Elmore, Kender, Leng, Greaves and Elderfield2016), and the benthic foraminiferal oxygen isotope record is from the east Tasman Sea core SO136-003GC (triangles) (Ronge et al., Reference Ronge, Steph, Tiedemann, Prange, Merkel, Nurnberg and Kuhn2015). Gwydir palaeochannel ages are from Pietsch et al. (Reference Pietsch, Nanson and Olley2013), expressed as the median and 95th percentile range of summed ages for each identifiable palaeochannel with average width measurements (this study). Holocene Gwydir-phase ages are not identified with extant channels and are shown at a nominal width. Modern Gwydir river widths at Yarraman Bridge and downstream of Tyreel (squares) show the decrease in channel width just above the point of river breakdown. Murrumbidgee palaeochannel ages are from Page et al. (Reference Page, Nanson and Price1996), expressed as the median and 95th percentile range of summed ages for each identifiable palaeochannel with average width measurements (this study). Three reaches of the Yanco palaeochannel are shown with the same pooled age. The modern Murrumbidgee River width at Darlington Point is shown for comparison. The vertical line at 5.5 ka marks the transition to the modern flow regime found in the Macquarie.

By contrast, the broad pattern of palaeochannel discharges described for the Murrumbidgee (Page and Nanson, Reference Page and Nanson1996; Fig. 11D) shows large MIS 3 to early MIS 2 palaeochannels, but it is the late MIS 2 Yanco palaeochannel that is the largest on the DFS surface in its upper reach but declines markedly in width downstream. This is at least suggestive of a relationship between river discharge and temperatures in the southern Murray-Darling basin. On the basis of the available ages, there is no convincing case for synchronous palaeochannel development in the Murrumbidgee, Macquarie, and Gwydir systems (most palaeochannels dated by between one and three ages, but with four ages for the Yanco palaeochannel), and this is especially true for the window around and following the LGM (Fig. 11).
A northern moisture source should have affected northern Murray-Darling basin catchments more than southern catchments. A northern moisture source in the Coral Sea may have been enhanced by warmer sea-surface temperatures (SSTs). There are some substantial similarities between the Macquarie record and the palaeohydrologic record from the Gwydir catchment (Pietsch et al., Reference Pietsch, Nanson and Olley2013) to its north (Fig. 11B): both preserve very large early to mid-MIS 3 palaeochannels, reduced but still substantial MIS 2 palaeochannels, and much smaller late Holocene channels that underwent breakdown and development of substantial floodplain wetlands. Within the limitations of the still relatively small number of OSL ages available for both systems, the ages of the Gwydir and Macquarie palaeochannels overlap at the 95% probability level (Fig. 11B and C). However, the largest palaeochannels preserved on the surface of the Gwydir DFS (Coocalla, Mia Mia) formed around 40–35 ka compared with the Quombothoo palaeochannel (Macquarie) at 54 ka. It is possible that moisture from the Coral Sea source was enhanced by warmer SSTs in MIS 3 compared with MIS 2. However, an SST record from the western margin of the Coral Sea shows a very muted temperature range over the last glacial cycle (<1.5°C) and early MIS 3 SST intermediate between interglacial and LGM values (Lawrence and Herbert, Reference Lawrence and Herbert2005). This suggests either very high sensitivity of precipitation to small SST changes within the MIS 3 window, but not in interglacials, or that additional factors remain to be identified. A possibility is that atmospheric circulation changes, independent of or in addition to SST, associated with the shoreline configuration and global climate at the time were responsible for enhanced tropical moisture reaching higher latitudes in eastern Australia.
The assembled palaeochannel and alluvial unit ages from several Murray-Darling basin and coastal New South Wales rivers have been used to suggest a history of punctuated but overall declining river discharge throughout the last glacial cycle and into the Holocene (Nanson et al., Reference Nanson, Cohen, Doyle and Price2003). This includes an early Holocene interval (10–4.5 ka), identified as the Nambucca Phase, in which fluvial records are absent, interpreted as a phase of enhanced flow causing widespread erosion (Cohen and Nanson, Reference Cohen and Nanson2007). An OSL-dated lakeshore record from Lake George in the Southern Tablelands of NSW (Fig. 1) confirms a period of high lake level (15–18 m depth) between 10 and 4.5 ka (Fitzsimmons and Barrows, Reference Fitzsimmons and Barrows2010) and a record of water level and salinity from Lake Keilambete, Victoria (Fig. 1), confirms a period of high, fresh water between 8.8 and 7 ka, with prolonged contraction until around 4.5 ka, followed by low, fluctuating conditions (Wilkins et al., Reference Wilkins, Gouramanis, De Deckker, Fifield and Olley2013). The large Mundadoo palaeochannel described here from the lower Macquarie DFS falls within the very last part of this interval, and a newly dated palaeochannel of the Lachlan River at Hunthawang also falls within this gap (8.3–5.2 ka) but was the same width as the modern river (Kemp et al., Reference Kemp, Pietsch, Gontz and Olley2017).
The Macquarie palaeochannels, as well as the other Murray-Darling basin palaeochannel records, show that the most profound change in river hydrology in the last 60 ka was within the Holocene. The general pattern of palaeochannel size reduction from the LGM or postglacial period to the Holocene has long been recognised (e.g., Ogden et al., Reference Ogden, Spooner, Reid and Head2001; Nanson et al., Reference Nanson, Cohen, Doyle and Price2003), although Ogden et al. (Reference Ogden, Spooner, Reid and Head2001) found poor agreement but also poor delineation of this transition in several Murray-Darling basin catchments. Our record from the Macquarie places the transition at around 5.5 ka. While the transition is not so clearly defined on the Gwydir, modern sediments were dated to the last 5.6 ka (Pietsch et al., Reference Pietsch, Nanson and Olley2013), consistent with the Macquarie. This transition, the transformation of each river at the end of a long decline, marks the onset of the modern hydrologic regime.
CONCLUSIONS
This study bolsters the fluvial chronology of the Macquarie DFS in the northern Murray-Darling basin by providing 16 SG-OSL ages from six morphologically distinct palaeochannels. Based on OSL dating, crosscutting relationships, and preservation index, 50 rivers and palaeochannels have been placed in a sequence for the Macquarie DFS, documenting the decline and fall of the Macquarie River in the late Quaternary. The new OSL ages have confirmed the high likelihood of heterogeneous bleaching in these fluvial samples, thereby improving upon the previously reported single-aliquot ages (Watkins, Reference Watkins1992; Yonge and Hesse, Reference Yonge and Hesse2009) for Macquarie palaeochannels, which has wider relevance for palaeochannel studies and interpretations of DFS chronologies not only on DFS in Australia, but also elsewhere.
Our results substantially revise the chronology of morphological adjustment for the Macquarie River, in turn aiding comparisons with other Murray-Darling basin palaeochannel systems. The oldest dated Macquarie River palaeochannel (the Quombothoo, median age 54 ka) was 12 times wider and had 21 times greater meander amplitude than the modern river. Late MIS 3 and LGM (MIS 2) palaeochannels were five to seven times larger than the modern river. The transition to the modern river form (and by inference the modern hydrologic regime) followed abandonment of the smaller, but still substantial Mundadoo palaeochannel at 5.5 ka, marking the beginning of sediment accumulation at the historical terminus of the Macquarie River in the Macquarie Marshes.
There are similarities in timing and direction of change between this record and that of the Gwydir River in the northern Murray-Darling basin and, to some degree, with the Murrumbidgee River in the southern Murray-Darling basin. Together, these data support enhanced northern moisture sources, particularly during early and mid-MIS 3 in the northern Murray-Darling basin, in addition to suppressed temperatures in controlling catchment runoff. Against this background of long-term decline, the most significant transition is the transformation of the previously continuous Macquarie River in the late Holocene to a discontinuous system forming the Macquarie Marshes. This threshold change appears to have occurred when the channel decreased to around 20 m bankfull width and 200 m meander wavelength. The historical trend described here for the Macquarie is common to many other lowland rivers in Australia, although the timing may differ. This work also shows that threshold responses to small changes around the critical flow levels required to sustain throughgoing channels can have profound impacts on fluvial geomorphology, tributary–trunk stream connectivity, and ecological status of rivers and wetlands.
ACKNOWLEDGMENTS
This research was supported by: ARC LIEF Grants (LE110100220, LE100100094); MU New Staff Grant (T. J. Ralph); MU Safety Net Grant (2010); and MU RIBG (2010). We thank Paul Harvey, Nathan Nagle, Samantha Oyston, Simon Mould, Brent Peterson, Georgia Carthey, Adam Wethered, and Lani Barnes for assistance in the field and in the lab. We would also like to acknowledge the landholders (Adam and Leonie Coleman, David Thornton and family, Myra Tolhurst, Greg Murie) and NSW Office of Environment and Heritage for permission to access field sites. Stephen Tooth, Tim Pietsch, Jim O’Connor, and Nick Lancaster all provided valuable reviews of the paper for which we are very grateful.