



Introduction
The greatest disease burden of Old World cutaneous leishmaniasis (CL) is in the Middle East, where the war in Syria has produced significant outbreaks among refugee populations in Turkey, Lebanon and Jordan (Saroufim et al., Reference Saroufim, Charafeddine, Issa, Khalifeh, Habib, Berry, Ghosn, Rady and Khalifeh2014; Al-Salem et al., Reference Al-Salem, Subramaniam, Haines, Kelly-Hope, Molyneux, Hay and Acosta-Serrano2016; Bailey et al., Reference Bailey, Mondragon-Shem, Hotez, Ruiz-Postigo, Al-Salem, Acosta-Serrano and Molyneux2017). Disease management is greatly aided by an accurate diagnosis (Aronson et al., Reference Aronson, Herwaldt, Libman, Pearson, Lopez-Velez, Weina, Carvalho, Ephros, Jeronimo and Magill2017), which is initially based on a clinical patient assessment (supported by epidemiological data) and is then followed by laboratory testing (de Vries et al., Reference de Vries, Reedijk and Schallig2015). The most conventional laboratory methods used for diagnosis are either by direct microscopy or culturing parasites from infected tissue (Saab et al., Reference Saab, Fedda, Khattab, Yahya, Loya, Satti, Kibbi, Houreih, Raslan, El-Sabban and Khalifeh2012). However, these methods can be limited by poor sensitivities and misdiagnosis, which can lead to unnecessary treatment with toxic drugs, like antimonials (Pourmohammadi et al., Reference Pourmohammadi, Motazedian, Hatam, Kalantari, Habibi and Sarkari2010). Moreover, diagnosis can be further confounded by other inflammatory and neoplastic skin diseases that possess similar clinical features as CL (Saab et al., Reference Saab, Fedda, Khattab, Yahya, Loya, Satti, Kibbi, Houreih, Raslan, El-Sabban and Khalifeh2012). In lieu of these observations, our group sought to devise more effective diagnostic tools that together with a patient's clinical assessment can facilitate CL identification.
In this work, we have identified a set of glycan-based proteins that are differentially recognized by sera from patients infected with Leishmania major as opposed to sera from heterologous controls (individuals with non-CL dermatological pathologies). These proteins have the potential to be suitable diagnostic candidates. In Saudi Arabia, CL is caused by L. major and Leishmania tropica (Abuzaid et al., Reference Abuzaid, Abdoon, Aldahan, Alzahrani, Alhakeem, Asiri, Alzahrani and Memish2017). It is well-known that the cell surface of Leishmania spp. is abundantly covered with diverse glycoconjugates including glycoinositolphospholipids (GIPLs) (McConville and Bacic, Reference McConville and Bacic1989). In L. major, GIPL-2 and -3 contain non-reducing, terminal α-galactopyranosyl (α-Gal) residues, which are strongly recognized by human sera (McConville et al., Reference McConville, Homans, Thomas-Oates, Dell and Bacic1990), because these epitopes are absent in humans (Galili, Reference Galili1993). Furthermore, antibodies against a canonical α-Gal structure, Galα1-3Galβ1-(3)4GlcNAc-R, represents ~1% of circulating human IgG and are believed to be derived from cross-reactive epitopes on commensal gut microflora (Galili et al., Reference Galili, Mandrell, Hamadeh, Shohet and Griffiss1988; Galili, Reference Galili1993). Pathogen-specific anti-α-Gal antibodies are believed to facilitate host protective immunity in Chagas disease and malaria (Almeida et al., Reference Almeida, Milani, Gorin and Travassos1991; Yilmaz et al., Reference Yilmaz, Portugal, Tran, Gozzelino, Ramos, Gomes, Regalado, Cowan, d'Apice, Chong, Doumbo, Traore, Crompton, Silveira and Soares2014). Recently, a neoglycoprotein (NGP) containing a synthetic terminal α-Gal glycotope has been found to induce significant protection against L. major in α1,3-galactosyltransferase knockout mice, which mimics the human humoral response to α-Gal (Iniguez et al., Reference Iniguez, Schocker, Subramaniam, Portillo, Montoya, Al-Salem, Torres, Rodriguez, Moreira, Acosta-Serrano, Michael, Almeida and Maldonado2017).
Previously, we demonstrated that CL patients from Saudi Arabia show high anti-α-Gal antibody titres against the commercially available Galα1,3Galβ1,4GlcNAc glycotope (Al-Salem et al., Reference Al-Salem, Ferreira, Dyer, Alyamani, Balghonaim, Al-Mehna, Al-Zubiany, Ibrahim el, Al Shahrani, Alkhuailed, Aldahan, Al Jarallh, Abdelhady, Al-Zahrani, Almeida and Acosta-Serrano2014). Building on this work, we test a set of non-commercial synthetic NGPs containing glycans with non-reducing terminal α-Gal residues conjugated to the carrier protein, bovine serum albumin (BSA) (Ashmus et al., Reference Ashmus, Schocker, Cordero-Mendoza, Marques, Monroy, Pardo, Izquierdo, Gallego, Gascon, Almeida and Michael2013; Schocker et al., Reference Schocker, Portillo, Brito, Marques, Almeida and Michael2016) in three groups: patients with an active L. major infection, those who were cured and heterologous controls to identify potential diagnostic candidates. The utility of glycoconjugates for diagnosis and screening has already shown promise for other kinetoplastid parasites (Anish et al., Reference Anish, Martin, Wahlbrink, Bogdan, Ntais, Antoniou and Seeberger2013; Ashmus et al., Reference Ashmus, Schocker, Cordero-Mendoza, Marques, Monroy, Pardo, Izquierdo, Gallego, Gascon, Almeida and Michael2013; Schocker et al., Reference Schocker, Portillo, Brito, Marques, Almeida and Michael2016). Our data find that patients with active L. major infection mount a higher IgG response to the α-Gal containing NGPs compared with the cured and control groups; with NGP3B having the best diagnostic potential. This study enhances our knowledge of the anti-α-Gal response in the context of a cutaneous disease and identifies an NGP that can potentially be incorporated into a laboratory assay to supplement the clinical assessment of CL.
Materials and methods
Sample collection
Archived samples collected in 2013 from individuals residing in CL endemic regions throughout KSA were used for this study (Al-Salem et al., Reference Al-Salem, Ferreira, Dyer, Alyamani, Balghonaim, Al-Mehna, Al-Zubiany, Ibrahim el, Al Shahrani, Alkhuailed, Aldahan, Al Jarallh, Abdelhady, Al-Zahrani, Almeida and Acosta-Serrano2014). The samples were separated into three distinct groups based on clinical diagnosis: individuals actively infected with L. major (L. major group, n = 17), individuals diagnosed as clinically cured (cured group, n = 29) and individuals with lesions that appear CL-like but were confirmed to be negative by internal transcribed spacer 1 genes-polymerase chain reaction and restriction fragment length polymorphism (ITS1-PCR RFLP) (heterologous group, n = 25) (Odiwuor et al., Reference Odiwuor, Saad, De Doncker, Maes, Laurent, El Safi, Mbuchi, Buscher, Dujardin and Van der Auwera2011). Leishmania active cases were diagnosed by a clinical assessment of the patient by a trained dermatologist and confirmed by microscopy. Study subjects were defined as cured based on a reduction in their lesion size or the appearance of lesion induration or crusting. All confirmed L. major diagnosed patients were treated per the KSA Ministry of Health guidelines, which recommend the application of topical azole creams followed by 1–2 courses of sodium stibogluconate (Pentostam™), depending on the patient's response to treatment. All patient samples were obtained at either national leishmaniasis reference clinics or at field sites (construction sites) with the assistance of the Ministry of Health Leishmaniasis Control Team. Each study subject provided a serum sample and lesion aspirate for parasite identification.
Chemiluminscent ELISA
A chemiluminescence-based enzyme-linked immunosorbent assay (CL-ELISA) described previously (Al-Salem et al., Reference Al-Salem, Ferreira, Dyer, Alyamani, Balghonaim, Al-Mehna, Al-Zubiany, Ibrahim el, Al Shahrani, Alkhuailed, Aldahan, Al Jarallh, Abdelhady, Al-Zahrani, Almeida and Acosta-Serrano2014) was used to determine the IgG response to various Galα NGPs. Briefly, white 96-well Immuno Nunc polystyrene microplates (Thermo Scientific) were coated overnight at 4 °C with 250 ng per well of each NGP in carbonate-bicarbonate buffer (pH 9.6). The NGPs were synthesized in the laboratory of Professor Katja Michael at the University of Texas at El Paso, USA. Except for NGP17B, the syntheses of these NGPs have been previously described (Ashmus et al., Reference Ashmus, Schocker, Cordero-Mendoza, Marques, Monroy, Pardo, Izquierdo, Gallego, Gascon, Almeida and Michael2013). Plates were blocked with 100 µL of 1% BSA in PBS (BSA, Sigma) for 1 hour at 37 °C before they washed three times with 0.05% Tween 20-PBS (Sigma). Human serum samples were diluted 1 : 100 in PBS and 100 µL added to each well. Plates were incubated for 1 hour at 37 °C followed by washing as before. 100 µL of 1 : 1000 unlabelled goat anti-human IgG antibody (Sigma) was added and incubated at 37 °C for 1 hour. Plates were washed and 100 µL of 1 : 1000 donkey anti-goat IgG biotin conjugate (Thermo Scientific) was added. The biotin complex was recognized by adding HRP-Streptavidin (Invitrogen) diluted 1 : 2000. Plates were incubated for 30 min at 37 °C. The reaction was developed with 100 µL Super-Signal Developer (Thermo Scientific) diluted 1 : 8 in carbonate-bicarbonate (pH 9.6) and read using a FLUOstar Omega plate reader (BMG LabTech) to give a luminescence value for each patient. ELISA plates contained a positive control (L. major infected pool), a negative control (a pool of normal healthy serum from uninfected Saudi volunteers) and a no-serum control to address any issues of cross-reactivity. Biological replicates were run for each patient. IgG titers for each group were calculated and normalized with the following formula:
 $$\displaystyle{{({\rm average\; of}\,{\rm unknown}\,{\rm replicates} - {\rm average}\,{\rm of}\,{\rm no}\,{\rm serum}\,{\rm control})} \over {{\rm pool}\,{\rm of}\,{\rm uninfected}\,{\rm Saudi}\,{\rm subjects}}}.$$
Neoglycoproteins
The NGPs (Fig. 1): Galα (Houseman et al., Reference Houseman, Gawalt and Mrksich2003), Galα(1,3)Galα (Schocker et al., Reference Schocker, Portillo, Ashmus, Brito, Silva, Cordero-Mendoza, Marques, Monroy, Pardo, Izquierdo, Gallego, Gascon, Almeida, Michael and Witczak2017), Galα(1,3)Galβ, Galα(1,6)[Galα(1,2)]Galβ and Galα(1,3)Galβ(1,4)Glcβ (Ashmus et al., Reference Ashmus, Schocker, Cordero-Mendoza, Marques, Monroy, Pardo, Izquierdo, Gallego, Gascon, Almeida and Michael2013) were chemically synthesized as their mercaptopropyl glycosides. The purpose of installing a thiol functionality in each glycan was to allow for the selective addition to maleimide groups of commercially available maleimide activated BSA in an aqueous medium. Since the mercaptopropyl glycosides oxidize easily to disulfides, they were treated with tris(2-carboxyethyl)phosphine hydrochloride, a water-soluble reducing agent, prior to their conjugation. The conjugation of the mercaptopropyl saccharides to maleimide-activated BSA (Imject™ Maleimide-Activated BSA Spin Kit, Thermo Fisher Scientific) was carried out following the manufacturer's protocol exactly, using the provided conjugation buffer at pH 7.2 to afford NGP3B, NGP17B, NGP9B, NGP11B, and NGP1B, respectively. The nomenclature of these NGPs is consistent with previously published work (Iniguez et al., Reference Iniguez, Schocker, Subramaniam, Portillo, Montoya, Al-Salem, Torres, Rodriguez, Moreira, Acosta-Serrano, Michael, Almeida and Maldonado2017).
Chemical structures of the neoglycoproteins used in this study. The number of glycans per BSA molecule (n) varies slightly depending on the conjugation efficiency. Typically, n = 20–25.

The synthesis of the mercaptopropyl glycoside of Galα(1,3) Galα (7), which had not been published before, and its conjugation to BSA are shown in Scheme 1. Synthetic details and spectroscopic characterizations are provided for compounds 3–7.
(a) TMSOTf, molecular sieves 4 Å, CH2Cl2 (89%); (b) HF-pyridine, THF (78%); (c) 80% HOAc/H2O (80%); (d) HSAc, AIBN, THF, UV light (49%); (e) NaOMe/MeOH (quant.); (f) TCEP, maleimide activated BSA, pH 7.2.

Allyl 4,6-O-di-tert-butylsilylidene-2,3-di-O-benzoyl-α-D-galactopyranosyl-(1→3)-2-O-benzoyl-4,6-O-benzylidene-α-D-galactopyranoside (3)
A solution of the known donor 1 (Imamura et al., Reference Imamura, Kimura, Ando, Ishida and Kiso2006) (0.086 g, 0.208 mmol) and the known acceptor 2 (Peng et al., Reference Peng, Linseis, Winter and Schmidt2016) (0.180 g, 0.270 mmol) in anhydrous CH2Cl2 (6 mL) was added to a 10 mL round bottomed flask with freshly activated, crushed 4 Å molecular sieves and stirred under argon for 15 min at 0 °C. Trimethylsilyl trifluoromethanesulfonate (TMSOTf) (0.004 mL, 0.021 mmol) was added, and gradually brought to room temperature (RT) and stirred for 2 h. The reaction was quenched with Et3N under stirring. The solution was diluted with CH2Cl2 (50 mL) and extracted with H2O (2 × 25 mL) and brine (25 mL), dried over MgSO4, filtered, concentrated, and purified by column chromatography on silica gel (hexanes/EtOAc 3 : 1) to give disaccharide 3 as a white powder (0.170 g, 89%). 1H NMR (600 MHz, CDCl3, 300 K) δ 8.05; 7.95; 7.79; 7.61; 7.45–7.51; 7.34; 7.29; 7.18–7.24; 7.15; 6.99 (20H, arom.); 5.80 (m, 1H, OCH2CH═CH2); 5.69 (d, 1H, 3J H1/H2 = 4.1 Hz, GalH-1); 5.65 (dd, 1H, 3J H2/H3 = 10.3 Hz, Gal'H-2); 5.57 (dd, 1H, 3J H2/H3 = 10.3 Hz, GalH-2); 5.48 (dd, 1H, 3J H3/H4 = 3.4 Hz, GalH-3); 5.29 (d, 1H, 3J H1/H2 = 3.4 Hz, Gal'H-1); 5.25 (m, 1H, OCH 2CH═CH2); 5.10–5.14 (m, 2H, OCH 2′CH═CH2, CHPh); 4.63 (d, 1H, GalH-4); 4.49 (dd, 1H, 3J H3/H4 = 3.4 Hz, Gal'H-3); 4.23 (d, 1H, Gal'H-4); 4.15–4.21 (m, 2H, OCH2CH═CH 2, Gal'H-6); 4.06 (dd, 1H, 3J H5/H6 = 2.1 Hz, 2J H6/H6′ = 12.4 Hz, GalH-6); 4.00 (m, 1H, Gal'H-6′); 3.95 (m, 1H, OCH2CH═CH 2′); 3.91 (s, 1H, GalH-5); 3.83 (dd, 1H, 3J H5/H6 = 2.1 Hz, GalH-6′); 3.71 (s, 1H, Gal'H-5); 1.08 (s, 9H, tBu); 0.88 (s, 9H, tBu) ppm. 13C NMR (150 MHz, CDCl3, 300 K): δ 166.7; 165.9; 165.8; 137.5; 133.7; 133.4; 133.2; 133.0; 127.9–130.2; 126.0; 117.6; 100.2; 96.2; 95.1; 73.3; 72.6; 71.0; 70.9; 69.5; 69.3; 69.0; 68.9; 67.2; 66.9; 62.9; 27.5; 27.3; 23.2; 20.7 ppm. Electrospray ionization time-of-flight high resolution mass spectrometry (ESI-TOF HRMS) [C51H58O14Si + NH4]+ calc. m/z = 940.3940, found 940.3251.
Allyl 2,3-di-O-benzoyl-α-D-galactopyranosyl-(1→3)-2-O-benzoyl-4,6-O-benzylidene-α-D-galactopyranoside (4)
A solution of the fully protected disaccharide 3 (0.170 g, 0.184 mmol) in anhydrous tetrahydrofuran (3 mL) was added to a 50 mL plastic conical tube and stirred under argon at RT. A solution of HF-pyridine (70% HF, 30% pyridine) (0.092 mL, 3.68 mmol) was added to the reaction mixture and stirred for 3 h, then quenched with 0.5 mL saturated NaHCO3. The solution was diluted with EtOAc and extracted with H2O and brine, dried over MgSO4, concentrated, and purified by column chromatography on silica gel (CHCl3/MeOH 15 : 1) to give 4 as a white powder (0.112 g, 78%). 1H NMR (600 MHz, CDCl3, 300 K) δ 8.12; 7.92; 7.77; 7.61; 7.41–7.52; 7.28–7.33; 7.24; 7.19; 7.12; 7.00 (20H, arom.); 6.64 (bs, 1H, OH); 6.13 (bs, 1H, OH); 5.81 (m, 1H, OCH2CH═CH2); 5.66–5.72 (m, 2H, Gal'H-2, GalH-1); 5.53–5.60 (m, 2H, GalH-2, GalH-3); 5.25–5.31 (m, 2H, OCH 2CH═CH2, Gal'H-1); 5.18 (s, 1H, CHPh); 5.13 (d, 1H, OCH 2′CH═CH2); 4.49 (dd, 1H, 3J H2/H3 = 10.3 Hz, 3J H3/H4 = 3.4 Hz, Gal'H-3); 4.26 (m, 2H, GalH-4, Gal'H-4); 4.15–4.22 (m, 2H, OCH2CH═CH 2); 3.99–4.06 (m, 2H, OCH2CH═CH 2′); 3.96 (m, 1H); 3.71–3.77 (m, 2H, H-5); 3.68 (m, 1H, H-6) ppm. 13C NMR (150 MHz, CDCl3, 300 K): δ 166.4; 166.0; 165.6; 137.4; 133.2–133.7; 127.9–130.0; 126.0; 117.6; 100.3; 96.2; 94.7; 73.1; 72.3; 70.8; 69.9; 69.5; 69.3; 69.0; 68.9; 63.2 62.9; 29.7 ppm. ESI-TOF HRMS [C43H42O14 + NH4]+ calc. m/z = 800.2918, found 800.2493.
Allyl 2,3-di-O-benzoyl-α-D-galactopyranosyl-(1→3)-2-O-benzoyl-α-D-galactopyranoside (5)
To the partially protected disaccharide 4 (0.104 g, 0.133 mmol) acetic acid (AcOH) (8 mL) and H2O (2 mL) were added. The mixture was stirred at 80 °C for 5 h, and was then allowed to cool to RT, co-evaporated with EtOH, and purified by column chromatography on silica gel (CHCl3/MeOH 9 : 1) to afford product 5 as a white powder (0.065 g, 80%). 1H NMR (600 MHz, CDCl3, 300 K) δ 8.13; 7.92–7.96; 7.60; 7.46–7.56; 7.31–7.40 (15H, arom.); 6.70 (bs, 1H, OH); 6.37 (bs, 1H, OH); 5.81 (m, 1H, OCH2CH═CH2); 5.74 (dd, 1H, 3J H2/H3 = 11.0 Hz, GalH-2); 5.58 (dd, 1H, 3J H3/H4 = 3.4 Hz, GalH-3); 5.52 (dd, 1H, 3J H2/H3 = 10.3 Hz, Gal'H-2); 5.49 (d, 1H, 3J H1/H2 = 4.1 Hz, GalH-1); 5.26 (dd, 1H, OCH 2CH═CH2); 5.20 (d, 1H, 3J H1/H2 = 3.4 Hz, Gal'H-1); 5.12 (dd, 1H, OCH 2′CH═CH2); 4.34 (dd, 1H, 3J H3/H4 = 3.4 Hz, Gal'H-3); 4.30 (m, 1H, GalH-4); 4.16 (m, 1H, OCH2CH═CH 2); 3.95–4.04 (m, 3H, OCH2CH═CH 2′, Gal'H-4, GalH-5); 3.86 (m, 1H, Gal'H-5); 3.80 (dd, 1H, 3J H5/H6 = 6.2 Hz, 2J H6/H6′ = 11.7 Hz, Gal'H-6); 3.68 (dd, 1H, 3J H5/H6 = 4.8 Hz Gal'H-6′); 3.62 (dd, 1H, 3J H5/H6 = 4.8 Hz, 2J H6/H6′ = 12.4 Hz, GalH-6); 3.56 (dd, 1H, 3J H5/H6 = 4.1 Hz, GalH-6′); 3.30–3.55 (bs, 2H, OH) ppm. 13C NMR (150 MHz, CDCl3, 300 K): δ 166.2; 166.0; 165.8; 133.8; 133.6; 133.4; 128.4–129.9; 117.6; 95.8; 95.7; 75.1; 70.8; 69.7; 69.6; 69.3; 69.0; 68.7; 68.0; 62.9; 62.7 ppm. ESI-TOF HRMS [C36H38O14 + NH4]+ calc. m/z = 712.2605, found 712.2448.
S-Acetyl-3-mercaptopropyl 2,3-di-O-benzoyl-α-D-galactopyranosyl-(1→3)-2-O-benzoyl-α-D-galactopyranoside (6)
To a solution of the tribenzoylated disaccharide 5 (0.041 g, 0.058 mmol) and azobisisobutyronitrile (AIBN) (0.010 g, 0.058 mmol) in anhydrous tetrahydrofuran (THF) (2 mL), AcSH (0.042 mL, 0.583 mmol) was added. The solution was stirred under argon for 5 min and then placed in a Rayonet UV reactor (350 nm) stirred for 12 h at RT under water cooling. The solution was concentrated by two co-evaporations with toluene, and purified by column chromatography on silica gel (CHCl3/MeOH 20 : 1) to furnish the thioester 6 as a white powder (0.023 g, 49%). 1H NMR (600 MHz, CDCl3, 300 K) δ 8.13; 7.95; 7.61; 7.52; 7.37; (15H, arom.); 5.75 (dd, 1H, 3J H1/H2 = 4.1 Hz, 3J H2/H3 = 11.0 Hz, GalH-2); 5.57 (dd, 1H, 3J H3/H4 = 2.8 Hz GalH-3); 5.50 (m, 2H, GalH-1, Gal'H-2); 5.15 (m, 1H, 3J H1/H2 = 4.1 Hz, Gal'H-1); 4.35 (dd, 1H, 3J H2/H3 = 9.6 Hz, Gal'H-3); 4.27 (m, 1H, GalH-4); 4.03 (m, 1H, Gal'H-4); 3.98 (dd, 1H, GalH-5); 3.79–3.85 (m, 2H, Gal'H-5, Gal'H-6); 3.75 (m, 1H, OCH 2); 3.59–3.70 (m, 3H, Gal'H-6′, GalH-6, GalH-6′); 3.42 (m, 1H, OCH 2′); 2.98 (m, 1H, SCH 2); 2.86 (m, 1H, SCH 2); 2.27 (s, 3H, SAc); 1.83 (m, 2H, OCH2CH 2) ppm. 13C NMR (150 MHz, CDCl3, 300 K): δ 166.2; 166.0; 165.8; 133.8; 133.6; 133.4; 129.7–129.9; 128.7; 128.5; 96.6; 95.3; 74.7; 70.8; 69.7; 69.6;69.4; 69.0; 67.8; 66.7; 62.9; 62.7; 30.6; 29.4; 25.9 ppm.
3-Mercaptopropyl α-D-galactopyranosyl-(1→3)-α-D-galactopyranoside (7)
To a flask containing thioester 6 (0.022 g, 0.028 mmol), 3 mL of a 0.5 M NaOMe solution in methanol was added under argon, and the solution was stirred at RT. The transesterification was monitored by HRMS. After 30 min all acyl protecting groups were completely removed, and the fully deprotected disaccharide 7 was partially oxidized to its disulfide. Amberlyst-15 ion-exchange resin was added, and the heterogeneous mixture was stirred until neutrality was reached followed by filtration through celite. The filtrate was concentrated, dissolved in H2O and then lyophilized to afford a mixture of disaccharide 7 and its oxidation product, the disulfide, as a white powder (0.012 g, quant.). ESI-TOF HRMS [M + Na]+ calc. m/z = 439.1250, found 439.0992.
The glycan load for each NGP was measured using matrix-assisted laser desorption/ionization time-of-flight mass spectrometry (MALDI-TOF-MS) (Axima, Shimadzu), as described (Schocker et al., Reference Schocker, Portillo, Brito, Marques, Almeida and Michael2016). Lyophilized underivatized BSA (control) or NGP was first diluted in sterile deionized water to a 1.0–1.5 mg μL−1 solution. Pre-loading mix was prepared by adding 5 µL of diluted NGP or BSA, 2.5 µL of sinapinic acid (Sigma), and 1.5 µL acetonitrile : water (2 : 1, v/v) with 0.1% trifluoroacetic acid (Thermo Fisher Scientific). 0.5 µL of pre-loading mix was applied to MALDI-plate spot and allowed to air dry. Once dried, 100 shots were fired per spot and 20 spectra were acquired. The average glycan load per NGP molecule was calculated by subtracting the BSA average molecular mass from the NGP average molecular mass, and dividing it by the molecular mass of the glycan-linker unit.
Statistical analysis
The normalized antibody titres to each NGP were found to have very positively skewed log-Normal distributions so the data were log transformed for all analyses. One-way ANOVA (GraphPad® Prism 5.0) was used to determine the statistical significance of the differences between the means of the three groups. Statistical significance was set at the conventional 5% level (i.e. at P ⩽ 0.05). Multiple logistic regression models followed by receiver-operating characteristic (ROC) curve analyses were performed on the log2-transformed titre values (IBM SPSS Statistics 23®) to evaluate the extent to which both individual and combinations of NGPs could discriminate between the three study groups – and hence potentially be used as a diagnostic tool for the disease states.
Results and discussion
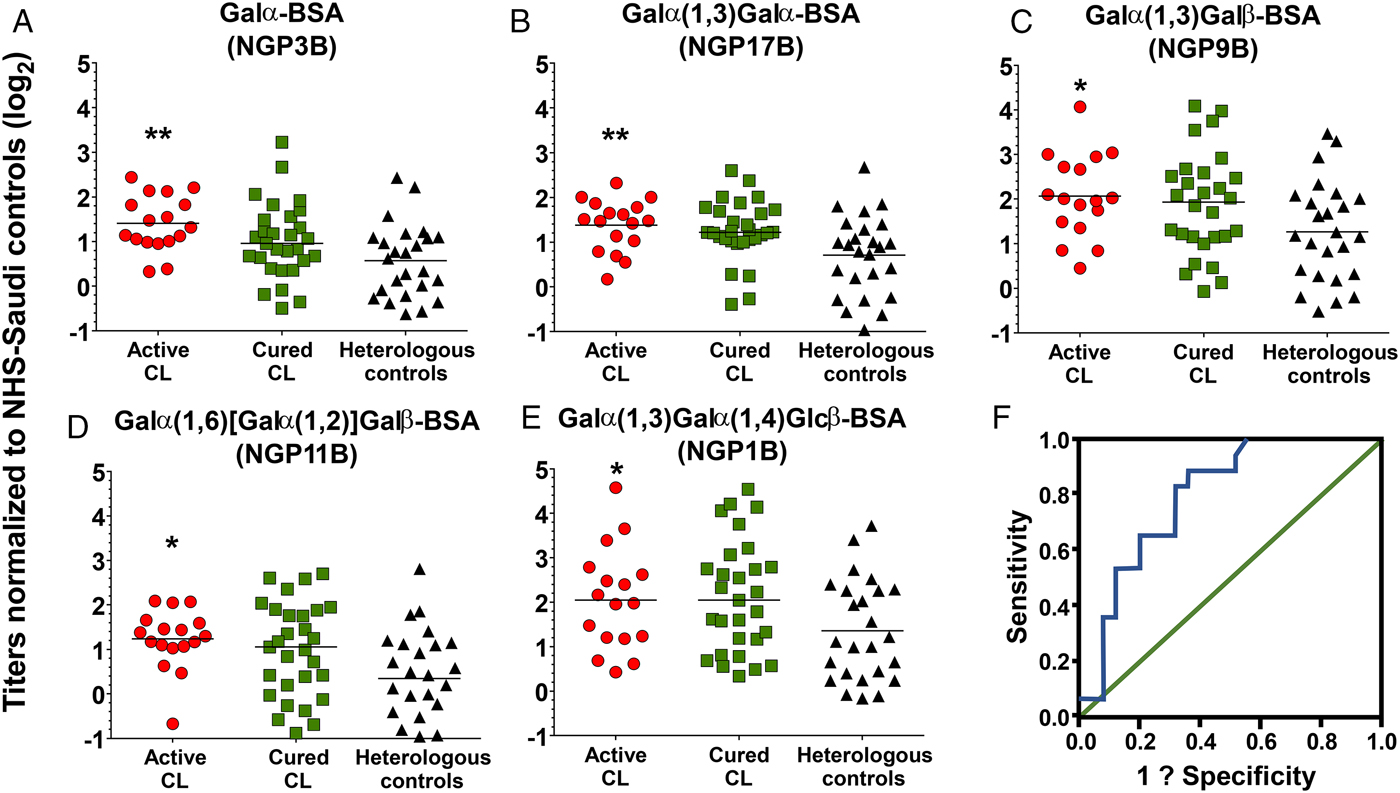
The 17 individuals in the active L. major infection group were primarily migrant workers from either the Indian subcontinent or Egypt. They suffered from CL lesions ranging in number from 1 to 23 with most lesions located on the head, neck and hands. The lesions ranged in presentation from papular, nodular and ulcerated/nodular (Table 1). A diagnosis of cure was defined as a reduction in lesion size or the appearance of induration or crusting. Curative rates varied from 1 month to 2 years, with 65% displaying lesion epithelialization within a month of sample collection. The heterologous controls retained skin abnormalities that upon visual inspection appeared to look like CL however, all patients tested negative on the ITS1 PCR, confirming the absence of any Leishmania spp. Sixty-eight percent of the individuals in the control group had eczema whose lesions can appear similar to certain disease variants of CL, which can further complicate diagnosis (Ayatollahi et al., Reference Ayatollahi, Fattahi Bafghi and Shahcheraghi2014). Comparison of the IgG levels to each NGP across the different patient groups found that the L. major group had significantly higher IgG titers in comparison with the heterologous control and cured groups (Fig. 2A–E). The five glycotopes (NGP3B, NGP17B, NGP9B, NGP11B and NGP1B) showed statistically significant differences across the groups (P values were calculated using one-way ANOVA test). We observed considerable overlap in the antibody responses to these NGPs across the study groups. We found a high degree of correlation in the antibody response between NGP17B and NGP9B between the L. major and heterologous controls (Pearson's correlation ρ = 0.83, P = 0.01), suggesting that the anomeric configuration (α or β) of the second sugar residues did not affect the way the target epitope was being displayed for antibody recognition. Moreover, between these two study groups, NGP9B and NGP1B also demonstrated a strong correlation (Pearson's correlation ρ = 0.93, P = 0.01), yet the correlation between NGP17B and NGP1B was much smaller (Pearson's correlation ρ = 0.67, P = 0.01). The anti-α-Gal response in the control group was surprising given that eczema is not associated with IgG antibodies to α-galactosylated NGPs. One possibility could be that the anti-α-Gal IgG response observed in the control group stems from their existing gut microflora. It is known that healthy individuals can mount an endogenous anti-α-Gal IgG response, with dysregulation, thus causing an increase in antibody titres (Mangold et al., Reference Mangold, Lebherz, Papay, Liepert, Hlavin, Lichtenberger, Adami, Zimmermann, Klaus, Reinisch and Ankersmit2011). Our data show that most of the control patients raise an anti-α-Gal antibody response well below the median value (Fig. 2). Moreover, the low-responders among the L. major cohort may represent patients that are clinically different in relation to disease onset, parasite load and exposure, and length of post-treatment follow-up, which can affect antibody titres. Prospective studies with a better-matched cohort are planned to address how these factors influence the antibody response to the α-Gal-terminating NGPs.
Normalized IgG response to the respective neoglycoprotein. (A–E): IgG antibody response against the various α-Gal NGPs in the L. major-infected (n = 17), heterologous (n = 25), and cured (n = 29) groups. Y-axis represents log 2 transformed data of relative luminescence units normalized to normal healthy serum from Saudi controls. Asterisks reflect P values calculated by comparing across all three study groups using one-way ANOVA. The line represents the median. (A) P = 0.005, (B) P = 0.007, (C) P = 0.042, (D) P = 0.012, and (E) P = 0.049. (F): The ROC curve displaying sensitivity and specificity for α-Gal. The AUC value is 0.80, with the y-axis displaying sensitivity and x-axis displaying 1-specificity.
Clinical characteristics of the study groups

a Data missing from four subjects.
b Data for two subjects are missing.
c Median age is displayed with the min and max ages in parentheses.
N/A, not available.
The cured group did not manifest a drastic change in IgG levels to the NGPs and had comparable levels with the L. major group (Fig. 2). This finding could be attributed to the fact that many of the patients in the cured group healed relatively early with lesion epithelialization occurring only one month within sample collection (Table 1). It is known that IgG antibodies are the most stable immunoglobulins with a half-life of more than 20 days (Brekke and Sandlie, Reference Brekke and Sandlie2003), therefore the observed high IgG response to the NGPs within the cured group could be attributed to circulating residual antibodies from the initial Leishmania infection. Another possibility could be that CL-specific anti-α-Gal B-cell clones remain in circulation for longer periods of time. Galili found the presence of quiescent anti-Gal B-cells in secondary lymphoid organs, which when stimulated by α-Gal epitopes produced persistently high titres (Galili, Reference Galili2005). Moreover, studies in adult patients with chronic Chagas disease who have undergone chemotherapy, demonstrate that levels of lytic T rypanosoma cruzi-specific anti-α-Gal antibodies significantly decrease only after 12 months post-treatment (Pinazo et al., Reference Pinazo, Posada Ede, Izquierdo, Tassies, Marques, de Lazzari, Aldasoro, Munoz, Abras, Tebar, Gallego, de Almeida, Reverter and Gascon2016). Therefore, the window of healing in our cured group may not have been sufficiently long to observe a decrease in the anti-α-Gal response.
To assess the diagnostic ability of these NGPs, logistic regression analysis was performed with the log2-transformed antibody data to determine the extent to which both individual and/or combinations of NGPs could discriminate between the disease groups (i.e., could predict disease state). Receiver operating characteristic (ROC) curve analysis was used to estimate the AUC (area under the curve) scores for the logistic regression. ROC curves provide a powerful visual representation of the ability of a logistic regression model to classify ‘cases of disease/infected’ from ‘cases of no disease/not infected’ (Grund and Sabin, Reference Grund and Sabin2010). Moreover, they are an effective method of comparing the predictive power of different models (diagnostic tests) based on their respective specificity and sensitivity values. The analysis found that a diagnostic model using NGP3B alone had an AUC value of 0.80 (Fig. 2F). A diagnostic test, which retains an AUC curve equaling 1, has perfect discriminatory power between diseased and non-diseased states (Grund and Sabin, Reference Grund and Sabin2010). Currently, we are examining other NGPs with L. major-specific glycan structures to determine their utility as a CL disease marker and to measure whether a diagnostic that combines multiple NGPs can have greater predictive power.
We acknowledge that our study has several caveats including the demographic inconsistencies between the study groups. This discrepancy is important since the level of hemato-immunological markers can depend on complex interactions between genetic and environmental factors, such as early exposure to pathogens and nutrition. Therefore, the possibility that the differences in antibody levels are simply an artefact of selection bias should not be ignored. Studies incorporating more patients and better-matched cohorts needs to be done. Secondly, these study samples were obtained at a single collection point and only provide a snapshot of the disease at a given time. Thus, a longitudinal study that monitors the antibody response to non-reducing, terminal α-Gal glycotopes in the same CL-infected patients from the time of initial infection through to the cure phase is being planned. Furthermore, studies in patients infected with other parasitic diseases need to be conducted to exclude issues of cross-reactive antibodies since previous reports show that infections with Plasmodium falciparum (Yilmaz et al., Reference Yilmaz, Portugal, Tran, Gozzelino, Ramos, Gomes, Regalado, Cowan, d'Apice, Chong, Doumbo, Traore, Crompton, Silveira and Soares2014) and other Leishmania such as L. infantum (Moura et al., Reference Moura, Santos, Brito, Valencia, Junqueira, Filho, Sant'Anna, Gontijo, Bartholomeu, Fujiwara, Gazzinelli, McKay, Sanhueza, Finn and Marques2017) can elicit an anti-α-Gal response, although in the case of malaria patients the response is an IgM type. This concern does not directly apply to this study as all the patients tested negative for malaria; however, cross-reactive α-Gal antibodies must be considered going forward. Despite these limitations, our study has provided more knowledge into the anti-α-Gal response in L. major infection and identified potential candidates that may be used as a diagnostic tool to complement the clinical assessment of Old World CL.
Acknowledgement
Thanks to Dr Ian Hastings (LSTM) for statistical advice.
Financial support
KSS, VA and MM were partially supported by a grant awarded to AAS by the Shefa Fund. WAS received a PhD studentship from the Ministry of Health of the Kingdom of Saudi Arabia. NSS was supported with a National Science Foundation – Louis Stokes Alliances for Minority Participation Bridge to the Doctorate Fellowship (HRD-1139929, BD 2011–2013). MSA was supported with a National Science Foundation – Louis Stokes Alliances for Minority Participation Summer Research Academy scholarship (HRD-1202008). KM was partially supported by the National Institutes of Health – National Institute of Allergies and Infectious Diseases (R21AI07961801A1 to KM and ICA). ICA was partially supported by grant No. 2G12MD007592 (to Robert A. Kirken) from the National Institute of General Medical Sciences (NIGMS). We are grateful to the Biomolecule Analysis Core Facility (BACF) at UTEP/BBRC, funded by NIGMS grant No. 2G12MD007592.
Ethical standards
All study participants provided informed consent prior to participation and ethical support was obtained from both the Liverpool School of Tropical Medicine (LSTM ethics application 12.06R) and the Saudi Ministry of Health. All study subjects who were non-Saudi tested negative for malaria, tuberculosis and AIDS, which is the standard practice to secure a work visa in KSA. Among the native Saudi patients, no comorbidities were reported.
Conflicts of interest
None.



