




No CrossRef data available.
The Measure of Man and Older Age Mortality: Evidence from the Gould Sample
Published online by Cambridge University Press: 29 March 2004
Abstract
This article documents differences in body size between white, black, and Indian mid-nineteenth-century American men and investigates the socioeconomic and demographic determinants of frame size using a unique data set of Civil War soldiers. It finds that over time men have grown taller and heavier and have relatively less abdominal fat, implying that “modern” chronic diseases such as ischemic heart disease were common in the past. Changes in frame size explain almost half of the mortality decline among white men between 1914 and 1988 and predict even sharper declines in older age mortality between 1988 and 2022.
Information
- Type
- ARTICLES
- Information
- Copyright
- © 2004 The Economic History Association
Past populations were shorter-lived, smaller, lighter, and faced a heavier disease burden in old age. Among Union Army veterans age 60 to 74 in 1910, more than one-third had difficulty walking, almost one-third had valvular heart disease, over half of them had arthritis, and more than one-third of them had adventitious sounds and decreased breath.1
Costa, “Understanding the Twentieth Century Decline” and “Changing Chronic Disease Rates.”
Costa and Steckel, “Long-Term Trends.”
Costa and Steckel, “Long-Term Trends”; and Fogel, “Nutrition.”
Painting an accurate picture of the health of past populations can help us assess trends in living standards, forecast future mortality rates, and understand theories of the epidemiological transition and the etiology of disease. The study of the epidemiological transition is still dominated by Abdel Omran's classic essay in which he postulated that there are three successive stages to the epidemiological transition: the age of pestilence and famine, the age of receding pandemics, and the age of degenerative and man-made diseases.4
Omran, “Epidemiological Transition.”
Omran, “Epidemiological Transition”; and Olshansky and Ault, “Fourth Stage.”
Were “modern” chronic diseases really uncommon in the past? Dora Costa finds that whereas heart disease accounts for 38 percent of all deaths among Union Army veterans observed at ages 50 to 64 and followed over a 17 year period, 18 out of those 38 percentage points are impossible to classify by type of heart disease.6
Costa, “Understanding Mid-Life.”
Costa, “Changing Chronic Disease Rates.”
Anthropometric measures can provide some clues on disease prevalence in past populations. For example, in modern populations waist-hip ratio predicts hypertension and cerebrovascular and ischemic heart disease. Provided that the relationship has remained the same, measurements of waist-hip ratio could provide some clues on the prevalence of hypertension and ischemic heart disease.
This article uses detailed anthropometric measurements to describe the body size of American men, white, black, and Indian, who fought in the Civil War. These anthropometric records can confirm or contradict prior findings on the health status of past populations. Richard Steckel discovered that the slave population of the United States experienced an unusual pattern of growth; by four and a half years of age they were only at the 0.2 height centile, below the level of the poorest populations of developing countries but later experienced such remarkable catch-up growth that by adulthood they were only slightly shorter than northern, white men and were taller than most European populations.8
Steckel, “Peculiar Population.”
Fogel, “Body Mass Index.”
Prince and Steckel, “Tallest in the World.”
The article also examines the socioeconomic predictors of body size to help us assess health status across different groups within society and to help us understand the etiology of chronic disease. The past literature has mainly focused on height, finding that white men living in the major cities and in other high mortality areas were shorter than those from remote rural areas. Although there were differences in height by occupation, these were small compared to the several centimeter occupational differences in stature among Europeans and to urban-rural differentials that were up to 3 cm in the United States.11
Costa and Steckel, “Long-Term Trends”; Floud, Wachter, and Gregory, Height; and Haines, Craig, and Weiss, “Development.”
Finally, the article investigates the relationship between body size and mortality from heart disease at older ages to determine whether there have been any changes in the relationship over time. Costa found that the relationship between height and subsequent mortality was similar among a sample of Union Army veterans and among modern, Norwegian males.12
Costa, “Height.”
For example, see Costa, “Understanding Mid-Life.”
THE HUMAN FRAME
The health indicators that this article studies are height, BMI, measures of central body fat (waist-hip ratio, chest-shoulder ratio, and chest-height ratio), lifting capacity, and lung capacity. The environment shapes these measures of the human frame. Poor net nutritional status during the growing years (including the fetal stage) leads to a shorter population and poor current net nutritional status to a lighter population. Low birth weight for gestational age babies (an indicator of maternal or fetal malnutrition) not only grow up to be shorter, but they may also grow up to have greater abdominal fat deposits, controlling for body mass.14
Paz, et al., “Are Children”; Lagerström, et al., “Long-Term Development”; Loos et al., “Birth Weight”; and Barker, Fetal and Infant Origins.
Birth weight and early life infections predict adult lung capacity.15
Barker, Fetal and Infant Origins.
Martorell, Ramakrishnan, Schroeder, Melgar, and Neufeld, “Intrauterine Growth Retardation.”
Height, weight, fat patterning, and lung capacity are predictors of subsequent morbidity and mortality. Among Norwegian males all-cause mortality first declines with height to reach a minimum at heights close to 185cm and then starts to rise. Height appears to be inversely related to heart and respiratory diseases and positively related to the hormonal cancers.17
Barker, Fetal and Infant Origins.
Martinez, Taussig, and Morgan, “Infant”; Eisen et al., “Association”; Strachan, “Ventilatory Function”; and Loomis, Collman, and Kogan, “Relationship.”
Studies of recent population suggest that measures of central or abdominal body fat are better markers than height or BMI of risk of death, especially risk of fatal coronary heart disease.19
For example, see Folsom, Prineas, Kaye, and Soler, “Body Fat Distribution.”
Ohlson et al., “Influence”; Blair et al., “Evidence”; Folsom et al., “Body Fat Distribution.” Atherogenic lipids such as chylomicrons, very low density lipoproteins, and low density lipoproteins accelerate the deposition of lipids in the intima of the arteries. This deposition of lipids is associated with atherosclerosis. High levels of high density lipoproteins may protect against risk of atherosclerosis, perhaps because these lipoproteins may be scavengers for excess cholesterol present in arterial walls.
Yao et al., “Anthropometric Predictors.”
Terry, Page, and Haskell, “Waist/Hip Ratio.”
Yao et al., “Anthropometric Predictors.”
Schreiner et al., “Sex-Specific Associations.”
In the United States today, blacks have smaller waist circumferences than whites at the same levels of BMI.25
Okosun et al., “Influence.”
Freedman, et al., “Relation.”
Whether anthropometric measures have direct pathogenic effects or are simply markers of other processes remains unclear. Consider the case of a high waist-hip ratio. Sustained adrenal overactivity, initiated by early growth restraint, may increase abdominal fat depositions and separately lead to hypertension and impaired glucose tolerance. Alternatively, the distinctive biochemical characteristics of intra-abdominal fat may perturb lipid and carbohydrate metabolism thus leading to cardiovascular disease and diabetes.27
Barker, Fetal and Infant Origins.
DATA
In the early part of 1863 the United States Sanitary Commission began its inquiry into the physical and social condition of soldiers. By the end of the war it had collected data on 23,785 men, consisting of 16,900 white Union soldiers, 1,146 white Union sailors, 68 white Union marines, 2,883 black Union soldiers (recruited both in the North and in the South), 1,980 Confederate prisoners of war, 517 Indians (mainly Iroquois from upstate New York), and 291 students. Trained examiners armed with andrometers, spirometers, dynamometers, facial angle instruments, platform balances, calipers, and measuring tapes measured men's body dimensions, weight, lifting strength, and vital capacity, and obtained basic demographic and socio-economic information. The data were first analyzed by Benjamin Gould and the original forms filled in by the examiners are available in the New York Public Library.28
Gould, Investigations.
Costa, “Understanding the Twentieth Century Decline.”
The Sanitary Commission collected the sample (henceforth referred to as the Gould sample) by sending 16 examiners to specific locations, including Washington, where the armies of the Potomac and the West were concentrated. Examiners were instructed to measure as many men as possible. When necessary, additional examiners were sent to a location and sometimes accompanied an army corps to obtain further measurements. Compared to the Union Army as a whole, the location of the examiners increases the proportion of recruits who were born in the Middle Atlantic (especially New York City) relative to the Union Army. Therefore, the average recruit was shorter and the proportion of recruits who were farmers was smaller than in the Union Army (see the Appendix for details). The average recruit in the Gould sample was also more likely to be native-born. Because the Union Army was representative of the northern population in terms of geographic distribution, foreign birth, and household wealth, the men in the Gould sample are therefore more urban, native-born, and shorter than the population as a whole.30
Fogel, “New Sources.”
Fogel, “New Sources.”
The article focuses on seven anthropometric indicators: height (an indicator of frame size), BMI (a measure of total body fat), waist-hip ratio, the ratio of chest circumference to shoulder breadth, the ratio of chest circumference to height (all indicators of central body fat), lifting strength (an indicator of muscle strength), and vital capacity (a measure of lung capacity). The quality of these measurements is discussed in the Appendix, which also provides details about the other anthropometric variables available in the sample. Vital capacity is not comparable to modern measures, but can still be compared across different groups within the Gould sample. Socio-economic and demographic controls are race, birth place (classified as the United States, Ireland, Germany, Great Britain, Canada, and other foreign), a dummy indicating if the native-born were born in a city with a population of 50,000 or more in 1860, occupation (classified as agricultural, professional or proprietor, artisan, and laborer), whether the recruits' parents were native-born, education (classified as none, limited common school, good common school, high school, collegiate, and professional), whether the recruit was a seaman, and year of enlistment.
Linkage to the pension records provides information on year and cause of death. The pension sample is further restricted to the 51 percent of men whose pension records provide information on cause of death. For the most part, these were men with a surviving spouse and men who lived longer. How serious is this restriction? As discussed later, treating men without cause of death information as censored yields similar findings in terms of magnitude as excluding these men from the analysis. Causes of death are coded as death from ischemic or cerebrovascular heart disease and death from other causes.32
Ischemic includes all mentions of atherosclerosis, arteriosclerosis, coronary occlusion, coronary thrombosis, and angina and also undefined heart disease. This heart disease category excludes valvular heart disease and myocarditis. See Fleming, Short History; and Finlayson, “Ischaemic Heart Disease,” for a history of diagnosis of ischemic heart disease.
How accurate are causes of death? Even today causes of death determined without autopsies cannot be considered accurate—they are at best guesses based upon existing medical conditions. Nonetheless, the causes of death noted on death certificates are consistent with the reports of the examining surgeons. These exams were given to anyone asking a pension increase and their receipt did not depend upon socioeconomic factors. For a large sample of Union Army veterans, Costa finds that conditions reported by the examining surgeons in 1900 predicted mortality by cause.33
Costa, “Understanding Mid-Life.”
Height and body fat measures in the Gould sample are compared with those of the post–World War II military from two anthropometric surveys used for designing uniforms and equipment for military personnel. These are the 1950 Survey of Flying Personnel conducted by the Air Force and the 1988 Anthropometric Survey of the U.S. Army. The latter survey includes blacks. The two surveys provide data on height, BMI, waist-hip ratio, the ratio of chest circumference to shoulder breadth, and of chest circumference to height. The measurements in these surveys are comparable to those in the Gould sample (see the Appendix for further details).
TRENDS
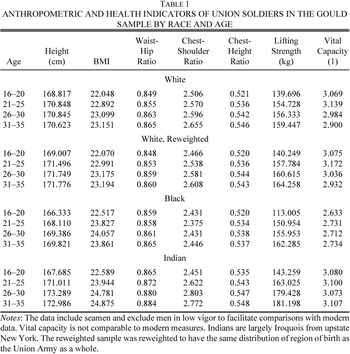
Table 1 shows that, with the exception of height and lifting capacity, re-weighting the white Gould sample so that it is geographically representative of the white Union Army has very little effect on the means of anthropometric measures. The analysis will therefore focus on the unweighted sample.

Table 1 shows that there were substantial differences in anthropometric characteristics across races. Indians were the tallest, the heaviest, had the highest waist-hip and chest-shoulder ratios, and had the greatest lifting strength and vital capacity. At ages 31–35 they were two cm taller than all whites and one cm taller than native-born whites in the unweighted Gould sample. However, differences between whites and Indians in height and vital capacity in the youngest age groups were small, suggesting that by the 1840s, Indians in New York State had experienced a relative deterioration in health. Note also that vital capacity does not decline after age 25, as would be expected, suggesting that older cohorts of Indians were in better health than younger cohorts. At younger ages (when they were still growing), blacks were the shortest, but by older ages almost achieved the heights of whites. Blacks' vital capacity was lower at all ages (and does not decline with age), but their other anthropometric measures were comparable.
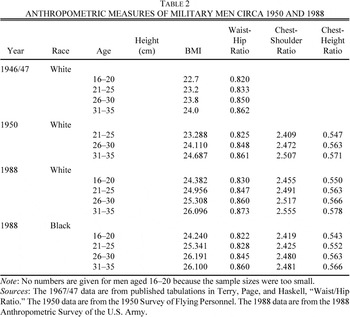
Over a span of 100 years, men in the military have become taller and heavier, but their waist-hip ratios and chest-shoulder ratios have not increased (see Table 2). The heights of white Americans age 26–30 rose from 171 cm to 177 cm in 1988. The BMIs of white soldiers in the oldest age group rose from 23 to 26. Note that the increase in BMI is more pronounced at older ages, a phenomenon previously noted by Costa and Steckel and attributable to the accumulated effects of work intensity and of working conditions, high rates of chronic disease at older ages, and the accumulated effects of differences in nutritional intakes and physical activity.34
Costa and Steckel, “Long-Term Trends.”


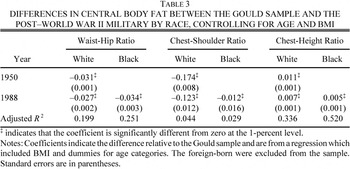
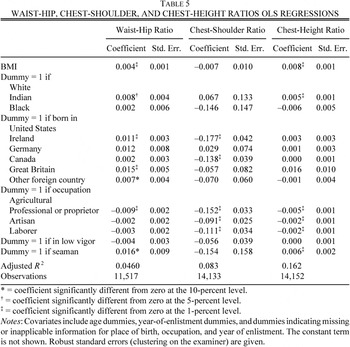
Tables 1 and 2 also show that whereas in the Gould sample blacks and whites are similar in terms of central body fat, in 1988 measures of central body fat were lower in blacks even when their BMIs were greater. Controlling for BMI and age with ordinary least squares regressions shows that all measures of central body fat are statistically significantly smaller in blacks than in whites. The difference in ratios was 0.02 for waist-hip, 0.07 for chest-shoulder, and 0.01 for chest-height. The absence of a difference between blacks and whites in measures of central body fat in the Gould sample may therefore be an indicator of the greater environmental stress faced by blacks in the mid-nineteenth century.
Anthropometric measures in the Gould sample are not highly correlated. The measure of abdominal fat that is most strongly correlated with BMI is chest-height ratio (ρ=0.313). The correlation between BMI and waist-hip ratio is low (ρ=0.184). Correlations, particularly those between BMI and abdominal fat measures, are much stronger in the modern army (e.g., ρ=0.849 between BMI and chest-height ratio and ρ=0.390 between BMI and waist-hip ratio).35
For complete tables, see Costa, “Measure.”
ANTHROPOMETRIC MEASURES: CORRELATES
Examining the correlates of anthropometric measures in the Gould sample, particularly race, foreign birth, size of city of birth, parents' foreign birth, occupation, and education provides information on how different groups fared controlling for observable demographic and socioeconomic factors and on the links between adverse conditions and outcomes.
The results that are shown are from an ordinary least squares regressions of the form

where the dependent variable yi is either height, BMI, waist-hip ratio, chest-shoulder ratio, chest-height ratio, lifting strength, or vital capacity. The independent variables include a vector of anthropometric controls (A). These are BMI in the case of the abdominal fat measures, height and BMI in the case of lifting strength, and height in the case of vital capacity. Additional controls include dummies for race (R), nativity (N), and occupation (O), a dummy variable equal to one if the man was in low vigor (V), a dummy variable equal to one if the man was a seaman (S), and a set of miscellaneous controls (M) comprising age dummies, year of enlistment dummies, and dummies indicating missing or inapplicable information for place of birth, occupation, education, and year of enlistment. Robust standard errors, clustering on the 16 examiners, are given.
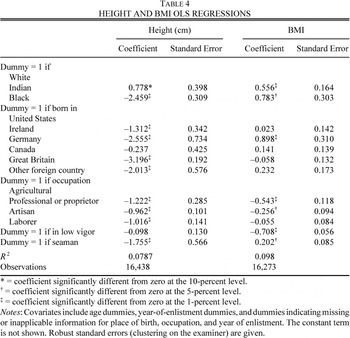
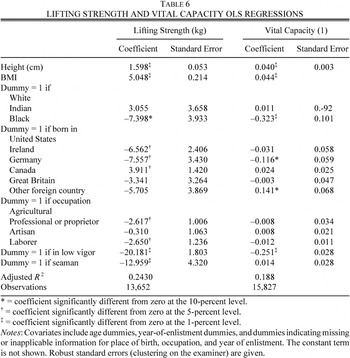
Tables 4, 5, and 6 confirm that differences in anthropometric characteristics across races were substantial. Indians were the tallest and had a greater BMI than whites. Blacks were the shortest and had the highest BMI. Note that because of their relatively small stature a higher BMI would lower their mortality risk and therefore may explain why the mortality rates of blacks and whites were not significantly different from each other above age 15.36
Fogel, “Body Mass Index.” Among Norwegian men age 50–64 in the late 1950s, mortality risk is minimized at higher weights for the short than for the tall. For a tables of values see Fogel, “New Sources.” Although we do not know whether this held true for the nineteenth century, the relationship between height and subsequent mortality and BMI and subsequent mortality is similar for Union Army Veterans and for Norwegians in the late 1950s (Costa and Steckel, “Long-Term Trends”; Costa, “Height”).


Tables 4, 5, and 6 show that there were also substantial differences by nativity and occupation. The foreign-born (with the exception of Canadians) were shorter than the native-born. Only Germans made up for their short heights with a greater BMI. The waist-hip ratios of the foreign-born were greater than those of the native-born and their lifting strength was smaller. Men working in agriculture were taller, heavier, had less abdominal fat, and had more lifting strength than men in nonagricultural occupations. Seamen were shorter, heavier, had more abdominal fat, and less lifting strength. Gould argued that the short heights of seamen were not due to the navy selecting shorter men, but to enduring the hardships of a seafaring life while still in the growing years (age 25 in the nineteenth century).37
Gould, Investigations.
Goldin and Margo, “Poor.”
ANTHROPOMETRIC MEASURES: OLDER AGE MORTALITY
Were anthropometric measures good predictors of subsequent mortality among Union Army veterans? To test this, I examined whether height, BMI, abdominal fat, muscle strength, and vital capacity predicted mortality from ischemic heart disease and stroke conditional on survival to 1900. The discussion in this section is restricted to height, BMI, and abdominal fat because muscle strength and vital capacity were not good predictors and the sample size was too small to examine deaths from respiratory disease. Recall that sample size is small because a full pension record was input only for the first randomly chosen 521 men whose pension records indicated that they survived to 1900. A further 49 percent of men are lost because of missing information on cause of death. Other men are missing anthropometric information, particularly waist-hip ratio which was not recorded on all forms. The sample was also restricted to men measured at ages 21–35.39
Including younger ages made the results very sensitive to sample choice.
I model Union Army veterans' waiting time until death from ischemic or cerebrovascular heart disease by means of a Cox proportional hazard model. The hazard, λ(t), or the rate at which spells are completed after duration t given that they last until at least t, is

where λ0 is the baseline hazard and exp(x′β) is the relative hazard. The covariates of primary interest are health measures and these consist of dummy variables for BMI below 20 and above 24, a dummy equal to one if the veterans' height was one standard deviation above the mean and dummies equal to one if the veterans' abdominal fat measures were one standard deviation above the mean and one standard deviation below the mean. Additional controls include age in 1900, occupation from the Gould sample (agricultural, professional or proprietor, artisan, or laborer), and a dummy equal to one if the recruit was in low vigor when measured.
40BMI performed better in terms of statistical significance when used as a linear variable rather than as an indicator variable.
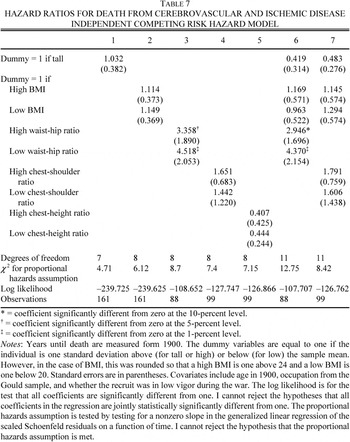
Table 7 shows that waist-hip ratio is a good predictor of subsequent mortality. Both high and low waist-hip ratios predict ischemic and stroke mortality. A waist-hip ratio that was more than one standard deviation above the mean increases mortality risk by 2.9 times relative to the mean controlling for BMI. A low waist-hip ratio increases mortality risk by 4.4 times. Neither a height dummy nor dummy variables indicating high and low BMI levels were statistically significant. Because persistence of BMI over the life-cycle was low (as noted by Costa and Steckel) and because BMI was affected by wartime stress, BMI may be a poor predictor of older age mortality.41
Costa and Steckel, “Long-Term Trends.”

Several robustness tests suggest that waist-hip ratio predicts subsequent mortality. When I examined death from all types of heart disease, a low waist-hip ratio remained a statistically significant predictor, though a high waist-hip ratio no longer was. The hazard ratio for a high waist-hip ratio was 2.025 (

=1.021), the hazard ratio for a low waist-hip ratio was 3.303 (

=1.370), the hazard ratio for a high BMI was 1.046 (

=0.463), the hazard ratio for a low BMI was 1.112 (

=0.447), and the hazard ratio for tall was 0.664 (

=0.328). When I examined all cause mortality, censoring on violent deaths, I found that a low waist-hip ratio was a statistically significant predictor, but not a high waist-hip ratio, though the magnitude of the hazard ratio was in the right direction. The hazard ratio for a high waist-hip ratio was 1.782 (

=0.676), the hazard ratio for low waist-hip ratio was 2.212 (

=0.713), the hazard ratio for a high BMI was 1.110 (

=0.353), the hazard ratio for a low BMI was 1.245 (

=0.361), and the hazard ratio for tall was 0.759 (

=0.253). When I treated men without cause of death information as censored (admittedly an assumption that violates independence), I found that both high and low waist-hip ratio were statistically significant predictors of death from cerebrovascular or ischemic heart disease. The respective hazard ratios for high waist-hip ratio, low waist-hip ratio, high BMI, low BMI, and tall were 2.302 (

=1.160), 4.026 (

=1.778), 0.993 (

=0.430), 1.009 (

=0.445), and 0.397 (

=0.295), respectively.
How did the predicted mortality experience of whites, African-Americans, and Indians differ? Using regression 6 in Table 7 and anthropometric means for white men from the Gould sample yields a predicted mortality rate from ischemic heart disease or stroke of 23.7 percent by 1914. Blacks' predicted 14-year mortality rate from ischemic heart disease and stroke was 22.7 percent (using the black sample means and the white mortality regression), similar to that for whites. The predicted 14-year mortality rate of Indians was 19.5 percent, lower than that of whites or blacks.
How would Union Army veterans have fared if in their youth they had the characteristics of men in the 1950 military? Answering this question will help us understand the magnitude of the hazard estimates and also provide some clues about the importance of anthropometric changes to the decline in mortality. Assuming that the baseline hazard had remained unchanged, Union Army veterans' 14-year all-cause mortality rate would have been lower by up to 15 percent, implying that changes in frame size explain up to 47 percent of the total decline in all-cause mortality at older ages from 1914 to 1988. As previously noted, the predicted mortality rate from ischemic heart disease or stroke was 23.7 percent by 1914 using the anthropometric means for white men from the Gould sample. Substituting the anthropometric means for whites in the 1950 military into the regression equation decreased the heart disease mortality rate to 20.0 percent. Thus, rather having 45 percent of the sample dying from ischemic heart disease or stroke, only 37 percent would have died.42
The means for whites for high waist-hip ratio (above 0.91), low waist-hip ratio (less than or equal to 0.81), tall (above 176.8 cm), high BMI (above 24), and low BMI (below 20) were 0.110, 0.144, 0.135, 0.278, and 0.318 in the Gould sample. The same means for whites in the 1950 military were 0.076, 0.217, 0.419, 24.0, 0.473, and 0.243. Among men in the Gould sample linked to the pension records, 55 percent of the sample had died by 1914 and 45 percent of all deaths were from ischemic heart disease or stroke. Twenty-five percent of the sample was therefore dead from ischemic heart or stroke by 1914. The regression results suggest that mortality from stroke or ischemic heart disease would have fallen by 19 percent if men had had a modern frame size. Therefore only 20 percent of the sample would have died from ischemic heart or stroke and only 47 percent of the sample would have died. (Note that this is an upper bound because men who died of heart disease may have died of other causes.) Life tables for the death registration states show in 1900 a 61 year-old (the mean age in the Gould sample) had a 54 percent chance of dying before age 75. By 1988 a 61 year old's 14-year mortality rate had fallen to 38 percent.
Changes in body size predict that older age mortality rates will have declined at a much more rapid rate by 2022. Substituting in the anthropometric means for whites in the 1988 military into the regression equation decreased the heart mortality to 17.6 percent and implies a reduction in the all-cause 1900 14-year mortality rate of 11 percent.43
The sample means for high waist-hip ratio, low waist-hip ratio, tall, high BMI, and low BMI in the 1988 data were 0.071, 0.149, 0.430, 0.663, and 0.124, respectively. The regression results imply that mortality from ischemic heart disease or stroke would have fallen by 26 percent or that only 33 percent of the sample would have died from ischemic heart disease or stroke. Only 48 percent of the sample would then have died from all causes.
Changes in body size also predict that the expected mortality decline among black men will be smaller than that of white men. Today, blacks' greater BMI puts them at higher risk. Using the sample means for black men in the 1988 army lowers the predicted 14-year ischemic disease and stroke mortality rate to only 22.1 percent from 22.7 using the means in the Gould sample.44
The means for blacks for in the Gould sample were 0.103, 0.106, 0.087, 0.489, and 0.176, for high waist-hip ratio, low waist-hip ratio, tall, high BMI, and low BMI, respectively. In the 1988 army the respective means were 0.018, 0.199, 0.716, and 0.091.
CONCLUSION
This article has shown that there have been substantial changes in the human frame over the last hundred years. Not only have men become taller and heavier, but, controlling for total body fat, they now have less abdominal fat as well. This type of fat patterning predicts hypertension and ischemic and cerebrovascular disease in modern populations and predicted death from ischemic and cerebrovascular disease in a past population where cause of death information is relatively rare. The findings suggest that hypertension and ischemic and cerebrovascular heart disease were present in this past population and may even have been as prevalent as they are today. The findings are consistent with reports of high arteriosclerosis rates in past populations and suggest that our view of the epidemiological theory needs to be more nuanced.45
Costa, “Changing Chronic Disease Rates.”
Changes in frame size (height, BMI, and waist-hip ratio) have lowered risk of death from ischemic heart disease or stroke (though other factors may have raised it) and explain almost half of the mortality decline among white men between 1914 and 1988. Low birth weights and exposure to infectious disease, poor nutritional intake, and the demands of work both during the growing years and in adulthood have been pointed to as factors that contribute to a high risk frame. The observed relationships between ethnicity and race (better predictors of environmental stress than such variables as occupation) suggest that humans' ability to control the environment has made changes in health in mortality possible. Rising wealth and advances in agriculture and in industry have improved nutritional status and lowered our need for manual labor. Knowledge of the germ theory of disease spurred sanitary reforms that reduced infectious disease rates.
Changes in frame size are still on-going. Men in the 1988 military were heavier and taller than men in the military of the 1950s but had the same abdominal fat patterning controlling for BMI. When these men reach late middle age in 2022, their mortality rates will be even lower than those faced by men in the late 1980s. Changes in frame size imply that, cetribus paribus, mortality rates will decline at a much more rapid rate than they have in the past. Because not all improvements in early life conditions are manifested as changes in frame size and because medical interventions at older ages are likely to continue to lower mortality rates, future declines in mortality rates may be sizable.
Data Appendix
The Gould sample was collected from the Statistical Bureau Archives of the United States Sanitary Commission in the New York Public Library. The data are available from the National Bureau of Economic Research, http://www.nber.org, and also from the Center for Population Economics at the University of Chicago, http://www.cpe.uchicago.edu. A randomly chosen subsample was then linked to the pension records in the National Archives. Only men who survived to 1900 were linked and collection stopped once the sample exceeded 500 people. The 1950 Survey of Flying Personnel and the 1988 Anthropometric Survey U.S. Army were obtained from the Human Systems Information Analysis Center (HSIAC) of the United States Military.
THE GOULD SAMPLE
Every effort was made by the United States Sanitary Commission to ensure accuracy in measurement. Examiners were trained, furnished with printed instructions, and provided with measuring instruments. Reports from Examiners were sent in weekly and returns were tabulated as soon as possible to check for errors. When a discrepancy did arise, the examiner was consulted for further information.46
Gould, Investigations, pp. 225–28.
Gould, Investigations, p. 256.
Gould, Investigations, p. 239.
Two different basic forms were used by the examiners. The exact questions are available from my working paper version of this article.49
Costa, “Measure.”
As previously noted, relative to the Union Army the Gould sample over-represents recruits born in the Middle Atlantic, yielding a shorter sample and one with fewer farmers.50
For a complete table see Costa, “Measure.”
ANTHROPOMETRIC VARIABLES USED IN THE ANALYSIS
All variables in the Gould sample were originally measured in inches and pounds and were converted to metric units. In general men removed their shoes, coats, and waistcoats for the examination but retained their trousers and under-clothing. However, examiners were specifically instructed to measure chest circumference under the shirt.
Height: In the Gould sample heights were measured with an andrometer.
Weight: In the Gould sample weight was measured with platform scales graduated to quarters of a pound.
Waist circumference: In the Gould sample waist circumference is measured as circumference of the waist above the hips and below the ribs. The midpoint is the natural waist circumference and this is what is measured in the 1950 and 1988 military surveys.
Hip circumference: In the Gould sample circumference around the hips is measured on the level of the trochanters. This is generally, but not always, equivalent to measuring maximal buttock circumference. The 1950 and 1988 military samples use the latter measure.
Chest circumference: Chest circumference was measured over the nipples and under clothing. For Form EE measurements, examiners were told to measure both while the lungs were fully inflated and after exhalation. No instructions were given for Form E. I used the mean value of circumference at maximal inspiration and circumference at full exhalation. The mean value calculated from Form EE was similar to that calculated from Form E. Restricting the sample to Form EE did not affect the mortality regressions.
Shoulder breadth: In Form E how breadth of shoulders was to be measured was unspecified but in Form E it was measured as breadth of shoulders between the acromion processes. Means across the two forms, however, were similar.
Lifting Strength: Lifting strength was strength in pulling upward, as measured by a dynamometer. Because lifting strength depends upon how the dynamometer was constructed, measures in the Gould sample may not be comparable to recent measures.
Vital Capacity: Vital capacity is measured by having the subject inspire maximally and then expire as rapidly and as completely as possible into a spirometer. Total lung capacity is reached at the point of maximal inspiration and residual volume is the amount of air left in the patient's lungs after maximal expiration. The difference between total lung capacity and residual volume is forced vital capacity, simply referred to as vital capacity in the paper. Measurements of vital capacity in the Gould sample understate true vital capacity and are not even comparable with measurements performed in the nineteenth century because of widespread differences in measurement by instrument.51
Hutchinson, Spirometer.
I gratefully acknowledge the support of NIH grants AG12658 and AG10120 and the comments of three anonymous referees.
References
Barker D. J. P.
1992
Fetal and Infant Origins of Adult Disease.
London:
British Medical Journal Publishing Group
Blair D.,
J. P. Habicht,
E. A. H. Sims,
D. Sylwester, and
S. Abraham.
1984
“Evidence for an Increased Risk of Hypertension with Centrally Located Body Fat and the Effect of Race and Sex on this Risk.”
American Journal of Epidemiology
119,
no. 4
526–40.Google Scholar
Costa Dora L.
1993
“Height, Weight, Wartime Stress, and Older Age Mortality: Evidence from the Union Army Records.”
Explorations in Economic History
30,
no. 4
424–49.Google Scholar
Costa Dora L..
1996
“Health and Labor Force Participation of Older Men, 1900–1991.”
This JOURNAL
56,
no. 1
62–
89.Google Scholar
Costa Dora L..
2000
“Understanding the Twentieth Century Decline in Chronic Conditions Among Older Men.”
Demography.
37,
no. 1
53–
72.Google Scholar
Costa Dora L..
2002
“Changing Chronic Disease Rates and Long-Term Declines in Functional Limitation Among Older Men.”
Demography.
39,
no. 1
119–38.Google Scholar
Costa Dora L..
March 2002
“The Measure of Man and Older Age Mortality: Evidence from the Gould Sample.”
National Bureau of Economic Research Working Paper No. 8843Google Scholar
Costa Dora L..
2003
“Understanding Mid-Life and Older Age Mortality Declines: Evidence from Union Army Veterans.”
Journal of Econometrics
112,
no. 1
175–92.Google Scholar
Costa Dora L. and
Richard H. Steckel.
1997
“Long-Term trends in Health, Welfare, and Economics Growth in the United States.”
In Health and Welfare During Industrialization,
edited by Richard H. Steckel and
Roderick Floud,
47–
89.
Chicago:
University of Chicago Press for NBER
Eisen E. A.,
D. W. Dockery,
F. E. Speizer,
M. E. Fay, and
B. G. Ferris Jr.
1987
“The Association Between Health Status and the Performance of Excessively Variable Spirometry Tests in a Population-Based Study in Six U.S. Cities.”
American Review of Respiratory Disease
136,
no. 6
1371–6.Google Scholar
Finlayson Rodney.
1985
“Ischaemic Heart Disease, Aortic Aneurysms, and Atherosclerosis in the City of London, 1868–1982.”
In The Emergence of Modern Cardiology,
edited by W. F. Bynum,
C. Lawrence, and
V. Nutton.
1985, Part of series, Medical History. Supplement No. 5:
151–68.
Fleming P. R.
1997
a Short History of Cardiology.
Amsterdam-Atlanta, GA:
Rodopi
Floud Roderick,
Kenneth W. Wachter, and
Anabel S. Gregory.
1990
Height, Health, and History: Nutritional Status in the United Kingdom, 1750–1980.
Cambridge:
Cambridge University Press
Fogel Robert W.
1986
“Nutrition and the Decline in Mortality since 1700: Some Preliminary Findings.”
In Long-Term Factors in American Economic Growth,
edited by Stanley L. Engerman and
Robert E. Gallman,
439–
553.
Chicago:
University of Chicago Press
Fogel Robert W..
1992
“The Body Mass Index of Adult Male Slaves in the U.S. c. 1863 and Its Bearing on Mortality Rates.”
In Without Consent or Contract: Evidence and Methods,
edited by Robert W. Fogel,
Ralph A. Galantine, and
Richard L. Manning,
311–18.
New York:
W.W. Norton and Company
Fogel Robert W..
1993
“New Sources and New Techniques for the Study of Secular Trends in Nutritional Status, Health, Mortality, and the Process of Aging.”
Historical Methods
28,
no. 1
5–
44.Google Scholar
Fogel Robert W., and
Dora L. Costa.
1997
“A Theory of Technophysio Evolution, With Some Implications for Forecasting Population, Health Care Costs, and Pension Costs.”
Demography
34,
no. 1
49–
66.Google Scholar
Fogel Robert W.,
Stanley E. Engerman,
Clayne Pope, and
Larry Wimmer.
1990
Union Army Recruits in White Regiments in the United States, 1861–1865.
[Computer file].
Ann Arbor, MI:
Inter-university Consortium for Political and Social Research [distributor]
Folsom A. R.,
R. J. Prineas,
S. A. Kaye, and
J. T. Soler.
1989
“Body Fat Distribution and Self-Reported Prevalence of Hypertension, Heart Attack, and Heart Disease in Older Women.”
International Journal of Epidemiology
18,
no. 2
361–67.Google Scholar
Folsom A. R.,
S. A. Kaye,
T. A. Sellers,
C. P. Hong,
J. R. Cerhan,
J. D. Potter,
R. J. Prineas.
1993
“Body Fat Distribution and 5-Year Risk of Death in Older Women.”
Journal of the American Medical Association
269,
no. 4
483–87.Google Scholar
Freedman D. S.,
D. F. Williamson.
J. B. Croft,
C. Ballew, and
T. Byers.
1995
“Relation of Body Fat Distribution to Ischemic Heart Disease. The National Health and Nutrition Examination Survey I (NHANES I) Epidemiologic Follow-up Study.”
American Journal of Epidemiology
142,
no. 1
53–
63.Google Scholar
Goldin Claudia, and
Robert A. Margo.
1989
“The Poor at Birth: Birth Weights and Infant Mortality at Philadelphia's Almshouse Hospital, 1848–1873.”
Explorations in Economic History
26,
no. 3
360–79.Google Scholar
Gould Benjamin Apthorp.
1869
Investigations in the Military and Anthropological Statistics of American Soldiers.
New York: Published for the United States Sanitary Commission, by Hurd and Houghton.
Cambridge:
Riverside Press
Haines Michael R.,
Lee A. Craig, and
Thomas Weiss.
2000
“Development, Health, Nutrition, and Mortality: The Case of the ‘Antebellum Puzzle’ in the United States.”
National Bureau of Economic Research Historical Paper 130Google Scholar
Hutchinson J.
1852
The Spirometer, the Stethoscope, and Scale-Balance; Their Use in Discriminating Diseases of the Chest, and Their Value in Life Offices; with Remarks on the Selection of Lives for Life Assurance Companies.
London:
John Churchill, Prince Street, Soho
Lagerström M.,
K. Bremme,
P. Eneroth, and
C-G Janson.
1994
“Long-Term Development for Boys and Girls at Age 16–18 as Related to Birth Weight and Gestational Age.”
International Journal of Psychophysiology
17,
no. 2
175–80.Google Scholar
Loomis D. P.,
G. W. Collman,
W. J. Rogan.
1989
“Relationship of Mortality, Occupation, and Pulmonary Diffusing Capacity to Pleural Thickening in the First National Health and Nutrition Examination Survey.”
American Journal of Industrial Medicine
16,
no. 5
477–84.Google Scholar
Loos R. J.,
G. Beunen.,
R. Fagard,
C. Derom, and
R. Vlietinck.
2001
“Birth Weight and Body Composition in Young Adult Men: A Prospective Twin Study.”
International Journal of Obesity and Related Metabolic Disorders
25,
no. 10
1537–45.Google Scholar
Martinez F. D.,
L. M. Taussig, and
W. J. Morgan.
1990
“Infants with Upper Respiratory Tract Illnesses Have Significant Reductions in Maximal Respiratory Flow.”
Pediatric Pulmonology
9,
no 2
91–
95.Google Scholar
Martorell R.,
U. Ramakrishnan,
D. G. Schroeder,
P. Melgar, and
L. Neufeld.
“Intrauterine Growth Retardation, Body Size, Body Composition, and Physical Performance in Adolescence.”
In Causes and Consequences of Intrauterine Growth Retardation.
Proceedings of an I/D/E/C/G/Workshop held in Baton Rouge, LA, 11–15 November 1996,
edited by Nevin S. Scrimshaw and
Beat Schürch.
http://www.unu.edu/unupress/food2/UIDO3E//uid03e00.htm
Ohlson L. O.,
B. Larsson,
K. Svardsudd,
L. Welin,
H. Eriksson,
L. Wilhelmsen,
P. Björntorp, and
G. Tibblin.
1985
“The Influence of Body Fat Distribution on the Incidence of Diabetes Mellitus. 13.5 Years of Follow-Up of the Participants in the Study of Men Born in 1913.”
Diabetes
34,
no. 10
1055–58.Google Scholar
Okosun I. S.,
S. H. Tedders,
S. Choi, and
G. E. Dever.
2000
“Abdominal Adiposity Values Associated with Established Body Mass Indexes in White, Black, and Hispanic Americans: A Study from the Third National Health and Nutrition Examination Survey.”
International Journal of Obesity and Related Metabolic Disorders
24,
no. 10
1279–85.Google Scholar
Olshansky S. J., and
A. B. Ault.
1986
“The Fourth Stage of the Epidemiological Transition: the Age of Delayed Degenerative Disease.”
Milbank Memorial Fund Quarterly
64,
no. 3
355–91.Google Scholar
Omran Abdel R.
1971
“The Epidemiological Transition: A Theory of the Epidemiology of Population Change.”
Milbank Memorial Fund Quarterly
49,
no. 4
509–38.Google Scholar
Omran Abdel R.
1982
“Epidemiological Transition.”
In International Encyclopedia of Population,
edited by J. A. Ross,
172–83.
New York:
The Free Press
Paz I.,
D. S. Seidman,
Y. L. Dnon,
A. Laor,
D. K. Stevenson, and
R. Gale.
1993
“Are Children Born Small for Gestational Age at Increased Risk of Short Stature.”
American Journal of Diseases of Children
147,
no. 3
337–39.Google Scholar
Prince Joseph M., and
Richard H. Steckel.
2001
“Tallest in the World: Native Americans of the Great Plains in the Nineteenth Century.”
American Economic Review
91,
no. 1
287–94.Google Scholar
Schreiner P. J.,
J. G. Terry,
G. W. Evans,
W. H. Hinson,
Crouse Jr 3rd,
G. Heiss.
1996
“Sex-Specific Associations of Magnetic Resonance Imaging-Derived Intra-Abdominal and Subcutaneous Fat Areas with Conventional Anthropometric Indices: The Atherosclerosis Risk in Communities Study.”
American Journal of Epidemiology
144,
no. 4
335–45.Google Scholar
Steckel Richard H.
1986
“A Peculiar Population: The Nutrition, Health, and Mortality of American Slaves from Childhood to Maturity.”
This JOURNAL
46,
no. 3
721–41.Google Scholar
Strachan D. P.
1991
“Ventilatory Function as a Predictor of Fatal Stroke.”
British Medical Journal
302,
no. 6768
84–
87.Google Scholar
Terry Richard B.,
William F. Page, and
William L. Haskell.
1992
“Waist/Hip Ratio, Body Mass Index and Premature Cardiovascular Disease Mortality in U.S. Army Veterans During a Twenty-Three Year Follow-Up Study.”
International Journal of Obesity
16,
no. 6
417–23.Google Scholar
Yao Chong-Hua,
Martha L. Slattery,
David R. Jacobs Jr,
Aaron R. Folsom, and
Eileen T. Nelson.
1991
“Anthropometric Predictors of Coronary Heart Disease and Total Mortality: Findings from the U.S. Railroad Study.”
American Journal of Epidemiology
134,
no. 11
1278–89.Google Scholar
ANTHROPOMETRIC AND HEALTH INDICATORS OF UNION SOLDIERS IN THE GOULD SAMPLE BY RACE AND AGE
ANTHROPOMETRIC MEASURES OF MILITARY MEN CIRCA 1950 AND 1988
DIFFERENCES IN CENTRAL BODY FAT BETWEEN THE GOULD SAMPLE AND THE POST–WORLD WAR II MILITARY BY RACE, CONTROLLING FOR AGE AND BMI
HEIGHT AND BMI OLS REGRESSIONS
WAIST-HIP, CHEST-SHOULDER, AND CHEST-HEIGHT RATIOS OLS REGRESSIONS
LIFTING STRENGTH AND VITAL CAPACITY OLS REGRESSIONS
HAZARD RATIOS FOR DEATH FROM CEREBROVASCULAR AND ISCHEMIC DISEASE INDEPENDENT COMPETING RISK HAZARD MODEL
 You have
Access
- 53
- Cited by