


Introduction
The distribution and dynamics of sea ice and associated habitats supporting the growth and succession of sea-ice biota is fundamental to understanding the temporal variations and the structure of the Southern Ocean’s ecosystems (e.g. Reference LawsLaws, 1985; Reference Garrison, Sullivan and AckleyGarrison and others, 1986, Reference GarrisonGarrison, 1991; Reference Ackley and SullivanAckley and Sullivan, 1994; Reference SmithSmith and others, 1995; Reference Garrison, Mathot, Ross, Hofmann and QuentinGarrison and Mathot, 1996).
Different microhabitats (discriminated based upon their location or geophysical features (Reference HornerHorner and others, 1992)) in sea ice support microbial communities varying in regard to their productivities, dynamics and community compositions (e.g. Reference Garrison, Sullivan and AckleyGarrison and others, 1986; Reference Kottmeier and SullivanKottmeier and Sullivan, 1990; Reference GarrisonGarrison, 1991; Reference LegendreLegendre and others, 1992; Reference Stoecker, Gustafson, Black and BaierStoecker and others, 1998; Reference Günther and DieckmannGunther and Dieckmann, 1999). Surface and freeboard habitats (sensu Reference HornerHorner and others, 1992; Reference Ackley and SullivanAckley and Sullivan, 1994) are among the most productive habitats in Antarctic pack ice relative to those habitats deeper within the interior of ice floes or those located at the base of the ice (e.g. Reference Garrison, Sullivan and AckleyGarrison and others, 1986; Reference LegendreLegendre and others, 1992; Reference Fritsen, Lytle, Ackley and SullivanFritsen and others, 1994). Despite the high levels of productivity and potential role of these habitats in determining the structure of the ecosystem, their dynamics and spatial and temporal distributions are relatively unknown. Furthermore, the attributes distinguishing freeboard and other surface habitats from interior habitats are not always clear and have been confused in the past literature. Hence, estimates and models of ice-associated productivities that rely on estimates of these habitats’ distributions, dynamics and productivities (e.g. Reference LegendreLegendre and others, 1992; Reference Arrigo, Worthen, Schnell and LizotteArrigo and others, 1998; Reference Fritsen, Ackley, Kremer, Sullivan, Lizotte and ArrigoFritsen and others, 1998) are currently based upon assumptions that are not easily defined or well constrained.
The objectives of the current paper are to (1) describe the environmental conditions present in the surface and freeboard habitats that were present in the Ross Sea during summer, (2) document the range of biomass and geochemical characteristics of these habitats in the austral summer and (3) discuss the processes leading to the formation of the freeboard habitat and how these affect the associated biological populations.
Methods and Study-Area Description
Ice floes were sampled along three primary longitudinal transects (165° W, 150° Wand 135° W) in the eastern Ross Sea during the time period 31 December 1998 through 6 February 1999 (Fig. 1). In general, ice floes sampled near the northern extent of the pack ice were relatively small (5−50 m in diameter), presumably due the wavefield present near the outer marginal-ice edge. Vast (>100m diameter) ice floes were present farther south along all three transects. Snow cover throughout the region exhibited grain morphologies indicative of melt-freeze processes, and densities typically averaged 200−475 kg m−3 with "wetted" covers exhibiting densities of > 500 kg m−3 (Reference Morris and JeffriesMorris and Jeffries, 2001).
Cruise track and stations sampled during the NBP-99-01 cruise in the ross sea.

The study was predominantly located in deep water (>1000 m) except for the stations visited on 13 January and 6 February 2000 that were on the continental shelf. However, near-surface habitats were not observed at these stations, which had characteristics typical of land-fast ice, i.e. floes were attached to permanent ice and consisted primarily of congelation ice.
Routine sampling of surface and freeboard habitats in the pack ice consisted of removing the snow from an area measuring approximately 50 cm × 50 cm from above the layers of wetted snow and/or consolidated ice at 2−6 locations on an ice floe. When a layer of consolidated ice was present in a snow/slush pit (normally found at or near freeboard/sea level; Fig. 2), a section (about 20 cm × 20 cm) of the ice was carefully removed, exposing the underlying slush (ice crystals plus sea water) (Fig. 2). Thus, a sampling hole was created that had a vertical wall whereby the vertical dimensions of the dry snow, wetted snow (if present), consolidated layers of ice, and underlying slush (Fig. 2) could be measured and samples of the slush could be drawn. One vertical wall in the pit was intentionally oriented toward the solar disk in order to minimize shading during subsequent irradiance measurements (described below).
Schematic diagram illustrating an idealized snow/slush pit on sea ice exhibiting layering consisting of snow, a consolidated layer of ice overlying a layer of slush as well as the underlying consolidated sea ice. illustration of the par sensor is included to demonstrate how and where the biospherical sensors were oriented in the snow pits during measurements.

Vertical temperature profiles in the snow were determined using a thermistor probe inserted 5−6 cm horizontally into the snow wall (accuracy of thermistor ±0.1 °C). Vertical profiles of scalar irradiances (e0) of photosynthetically active radiation (PAR) were also measured by inserting a Biospherical corporation QSL-100 4π sensor 25−35 cm horizontally into the vertical wall of the snow pit (Fig. 2). The e0 measurements were started at the base of the snow pit, and consecutive measurements were made at approximately 5−10 cm intervals moving upward while alternating the horizontal position from left to right approximately 10 cm. This strategy allowed measurements to be made without having the ice/ snow disturbed above the location of each individual measurement. Surface irradiances also were routinely measured above the snow with the 4π sensor.
Samples of bulk slush (SLB: slush ice crystals plus sea water), interstitial water (SLW: slush water) and ice (SI: slush ice) were obtained from these snow/slush pits following the determination of the t and e0 profiles. Interstitial water was routinely collected by placing acid-washed 60 cm3 syringes into the slush layers and drawing the water gently into the syringe. Careful collection precluded sampling the ice crystals as determined via visual inspection. Later comparisons of temperature-salinity determinations (described below) support the contention that ice crystals were precluded by this technique. Bulk samples (ice crystals plus interstitial water) were collected using acid-washed high-density polyethylene (HDPE) buckets (2 L) with relatively large-diameter (∼10 cm) openings inserted directly into the slush layer and poured into larger (4−20 L) HDPE acid-washed Nalgene containers.
Samples were temporarily stored in coolers and returned to the ship within 1−2 h of collection. Samples containing ice were routinely melted in a walk-in refrigerator at 0−4° C. Irradiances of PAR during melting were typically 20−60 μmol photons m −2 s −1 . Bulk slush samples usually melted within 8−20 h of collection. Processing samples for chlorophyll a (chla) analysis, nutrient determinations and microscopic identifications were routinely accomplished within 1 - 2 h of melting. Interstitial water (SLW) samples were typically processed back on the ship within minutes to an hour. All samples were stored at 0−4°C until processing. Water-column samples were collected from 10 L Niskin bottles deployed on a rosette. These samples were processed immediately after collection or stored on ice and in the dark and processed within 1−3 h.
Samples for chla determinations were filtered through GF/F filters, extracted in 90% acetone for 24 h and read on aTurner 10−AU fluorometer (e.g. Reference Parsons, Malta and LalliParsons and others, 1984).
Samples for determination of N03- (nitrate plus nitrite), P 0 4 + and Si(OH)4 concentrations were filtered through 0.2 μm polycarbonate filters and stored frozen at −80°C until analysis at University of California Santa Cruz’s Institute of Marine Science’s Marine Analytical Lab using standard autoanalyzer techniques. Samples for determination of ammonium ions were preserved to the phenol stage of the colorometeric protocol (Reference Parsons, Malta and LalliParsons and others, 1984) on board the ship. Subsequent colorometric determinations for the ammonium ion were accomplished within 24 h using a 10 cm path-length cuvette.
Samples for the identification, sizing and enumeration of the ice biota were fixed with gluteraldehyde or Lugols solution. Samples for small protist enumeration were filtered and stained with DNA-specific fluorescent stain (DAPI) and Acradine Orange and viewed using epifluorescence microscopy. Larger organisms were settled from the Lugols preservatives and enumerated via inverted bright-field and phase-contrast microscopy (see Reference Garrison, Gowing and HughesGarrison and others, 1998, for details of microscopy methods).
Results
During the study we excavated a range of snow/slush pits with vertical dimensions ranging from 3 cm to > 1m. On average, however, the snow/slush pits had 19.9 cm of snow overlying a 4.2 cm layer of consolidated ice that was overlying 12.4 cm of slush (Table 1).
Summary statistics describing the physical characteristics of snow and slush pits examined during the NBP-99-01 cruise in the eastern ross sea
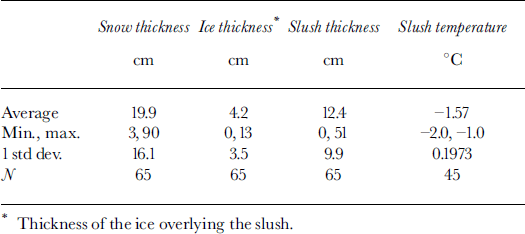
Temperature decreased from the air/snow interface through the snow and into the underlying slush (Fig. 3a). The average temperature gradient was 1°C m−1 when depths are normalized to the total distance from the slush-ice or snow interface (Fig. 3b). The average difference between surface temperatures and the slush temperatures was 1 °C, as the snow temperatures near the surface were often near the freshwater melting temperature of 0°C.
Temperature profiles in the snow pits excavated during the NBP-99−01 cruise, (a) temperature vs depth, and (b) temperature vs depth profile where depths (z) are normalized to the depth of the upper surface of the slush layer (zsl).

The mean surface of a slush layer (i.e. the interface between the snow or ice and the underlying sea water) was located at ∼ 2 5 cm from the air/snow interface (Table 1) where scalar irradiances were on average 15−25% of those measured at the surface of the snow (Fig. 4). The average attenuation coefficient from the snow and into the slush layer was 6.4 m−1 which is consistent with a mixture of ice and melting snow (Reference PerovichPerovich, 1990). Wet snow typically has albedos for PAR of 0.7−0.8 (e.g. Reference PerovichPerovich, 1990), and recalling that e0 above the snow/air interface is the summation of upwelling and downwelling scalar irradiances then scalar irradiances at 25 cm would have been more on the order of 30−40% of downwelling scalar irradiances of PAR.
Ratio of scalar irradiances of par measured at depths (e0(z)) to surface par (e0(q+)) in snow pits (all snowpit data combined). attenuation coefficient of par for combined data is 0.064 cm−1 or 6.4 m−1.

Salinity of the interstitial water within the slush averaged 29.2 psu (practical salinity units), whereas surface sea-water samples had salinities of 33.4 psu (Table 2). This difference of 4.2 psu is relatively small, yet consistent with that predicted for freezing point of water at temperatures of −1.57°C (Table 1). The low salinities and the relatively high temperatures (relative to the sea water at −1.8°C) are both indicative of mixing small volumes of ice meltwater with surface sea water. Brine volumes within the slush, calculated from an average bulk salinity of 21.5 psu (Table 2), indicate an average ice volume of ∼35% in the slush layers sampled.
Summary statistics (average, ±1 std dev., n)) describing the biogeochemical and physico-chemical properties of surface waters ( wc), slush interstitial waters (slw) and bulk slush (slb) samples examined during the NBP-99-01 cruise in the eastern ross sea
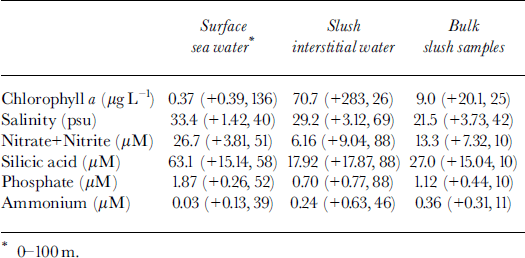
Chla concentrations in the slush water and bulk slush samples ranged from 0.09 to 1456 μg l −1 and averaged two orders of magnitude higher than the average chla concentrations in the upper 100 m of the water column (Table 2). The large variability of the chla concentrations in the slush is illustrated by the log-normal distribution of chla concentrations measured in these samples (Fig. 5).
Histogram of chla concentrations measured in slush samples during NBP-99-01 cruise.

Average nitrate, phosphate and silicic acid concentrations in the slush interstitial water and bulk meltwater samples were depleted relative to concentrations in the water column (range, 2.6- to 4.7−fold higher in the water column) even when allowances were made for dilution by ice melt (Fig. 6; Table 2). Ammonium concentrations, in contrast, were 8- to 10−fold higher in the slush relative to the surrounding sea water (Fig. 6; Table 2). The relative change in nutrient concentrations in the ice after corrections for reduced salinity indicate net removal (NO3, P04, Si(OH)4) and production (NH4+) of macronutrients within the surface/freeboard habitat.
Nutrient salinity relationships for samples collected from surface habitats and the water column in the eastern ross sea, during summer. lines represent dilution lines between pure crystalline ice (with no nutrients) and average sea water (closed symbolds) in the region. values falling above the dilution line are considered enriched while those below are depleted relative to the mean upper ocean sea water in the region.

Microscopic examinations of slush collected from the outer marginal ice edge to the inner ice edge showed a range of autotrophic algae and heterotrophic protists present within the surface habitats (Table 3). Several species were present in all the samples examined (fragilariopsis spp., chaetoceros neogracilis, amphiprora spp., nitzschia longissima, mantoniella spp., phaeocystis spp., cryothecomonas sp., gymnodinium spp., strombidium spp., holosticha spp., euplotes spp., lacrymaria spp.). Algae species from the genera fragilariopsis, chaetoceros, phaeocystis and mantoniella were usually the numerical or biomass dominants. Autotrophic cell concentrations and biomass varied > 100−fold in slush samples, ranging from 5.6 × 10⁵ to 1.1 × 10⁸ cells L−1 and 30 to 3500 μg C L−1, respectively, (averages, 1.47 × 10⁷ cells L−1 and 468 μg C L−1; n=20).
List of species observed in slush samples
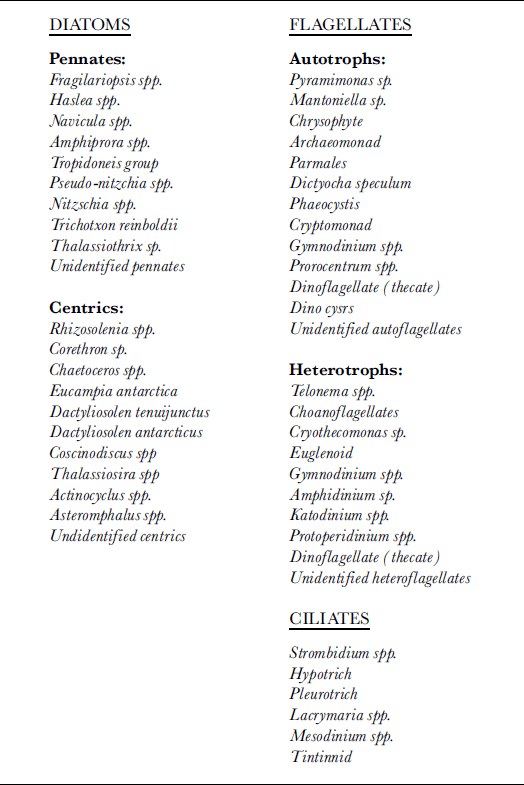
Heterotrophic protists rarely dominated the biovolume or cell numbers (averaging 27% and 17%, respectively), although cryothecomonas spp. and choanofagellates were present at relatively high concentrations (exceeding 105 cells L−1) in several samples near the outer ice-edge zone. Concentrations of heterotrophic protists and their biomass varied up to 200−fold, ranging from 5.4 × 10⁴ to 1.3 × 10⁷ cells L−1 and 4.2 to 384 μgC L−1, respectively (averages, 1.5 × 10⁶ cells L−1 and 9 7 μg C L −1 ; n = 20) .
Discussion
The choice of sites for the excavation of slush and snow pits during the present study was not a random process. Rather, the locations of the 2−6 sampling pits per station were chosen in an attempt to sample the range of conditions present in association with the range of geophysical features of the ice that were discernible from the upper surface of the ice. For instance, on vast ice floes with hummocks and/or ridges, sites were chosen to correspond with level ice and ridges, whereas on small ice floes, samples were chosen near to and away from the edge of the floes and in association with any predominant surface features when present. Selective sampling has the potential for biasing the overall summary statistics describing the geophysical, geochemical and biological parameters of the surface and freeboard habitats present. However, Reference Morris and JeffriesMorris and Jeffries (2001) report snow depths averaging ∼ 2 0 cm and standing-water depths of ∼ 1 0 cm in approximately 55% of their extensive snow-pit program during the same cruise. Hence, the dimensions of the snow and surface habitats that we sampled are consistent with the measurements from their sampling program. If the biogeochemical parameters exhibit a distribution or variation similar to that of the geophysical parameters, then our biota and geochemical statistics have utility for describing the general status of the surface habitats and associated communities within the Ross Sea sea ice during the austral summer.
Habitat formation and dynamics
Several combinations of processes have the potential for creating surface and near-surface habitats near the piezometric level of sea ice that would resemble the characteristics of the ice encountered throughout our study area (e.g. Reference Ackley and SullivanAckley and Sullivan 1994; Reference Fritsen, Ackley, Kremer, Sullivan, Lizotte and ArrigoFritsen and others, 1998). The processes responsible for the formation of a true surface habitat (synonymous with snow-infiltration habitat) in the snow are perhaps the least difficult to reconcile. When the surface of the sea ice is depressed below sea level, due to either widespread snow loading or local loading of the ice in association with deformation features (rafting and ridging), the surface of the ice can become flooded. The resultant surface habitat is easily recognized because sea water infiltrates the snow, yet a consolidated barrier of ice does not immediately exist between the sea water and the overlying snow.
When consolidated ice is present near the base of the snow (near sea level) and overlies a slush layer (Fig. 2), the processes leading to the formation of these freeboard habitats become increasingly hard to identify. One combination of processes with the potential for forming the freeboard habitat involves subsurface melting of an ice floe as brine movement in the upper part of an ice sheet stimulates algal growth near sea level (Reference Ackley and SullivanAckley and Sullivan, 1994). The enhanced growth of the pigmented algae then augments localized radiation absorption which leads to enhanced internal melting. Another potential model for forming the habitat first invokes surface flooding of the sea ice which is followed by freezing of the flooded layer from the top downward during periods of cold temperatures (Reference Fritsen, Lytle, Ackley and SullivanFritsen and others, 1994,Reference Fritsen, Ackley, Kremer, Sullivan, Lizotte and Arrigo1998).
Localized radiation absorption at the freeboard level is not likely to have been solely responsible for the formation of the habitats encountered during the current study. If localized internal melting were to melt the slush layer to brine volumes on the order of 65% (inferred from SLB salinities) then the salinities of the interstitial water and bulk slush samples would have been closer to the salinities of ice-core meltwater (typically 10−15 psu near the surface of first-year ice) than to the measured salinities of > 25 psu.
Freezing of infiltration layers from the surface downward would have required flooding events to be followed by cold temperatures. The average air temperature was −1.9°C throughout January 1999 (data not shown) and was not sufficient to create temperature gradients in the snow that would lead to freezing of infiltrating sea water. Rather, the temperature gradients (Fig. 2) would have favored warming of the sea water. However, we cannot rule out the possibility that the ice layers formed earlier in the spring when temperatures were colder.
An inverse temperature gradient in the snow cover (i.e. colder at depth; Fig. 2) poses the additional probability that liquid water within the snow could have been migrating downward and freezing at or near the transition zone from snow to slush as the low-salinity liquid water encountered sub-zero temperatures. Such a dynamic process could favor the growth of a consolidated layer of superimposed ice from the bottom upward which would provide an additional source of latent heat that could be conducted into the freeboard habitat. This method of pumping additional heat into a freeboard habitat would have augmented any internal melting being induced by localized radiation absorption. If this process was operating within the snow on the pack ice, it would be consistent with the rounded snow crystals and the large granular-ice crystals (often referred to as superimposed ice) (Reference KoernerKoerner, 1970) that were often observed at the base of the snow during the cruise (Reference Morris and JeffriesMorris and Jeffries, 2001).
Discerning whether or not the freeboard habitat forms primarily from flooding, freezing, radiation-induced internal melting, freezing in association with snowmelt migration or a combination of all of the above is necessary for determining the driving forces for the geophysical formation of a relatively productive habitat. Recognizing the differences in processes leading to the occurrence of the surface and freeboard habitats may also be key to understanding production of biomass once the habitats have formed. For instance, if internal melting leads to the formation of the near-surface habitat, one would expect that the potential for exchanging nutrients and materials throughout the ice profile would be diminished due to the formation of a stabilizing salinity gradient (like that observed during the present study). However, freezing a layer of sea water in the snow would promote the rejection and concentration of salts near the surface of the ice and the subsequent formation of a non-stable salinity gradient that could lead to the exchange of both dissolved and particulate materials (e.g. Reference ReeburghReeburgh, 1984; Reference Fritsen, Lytle, Ackley and SullivanFritsen and others, 1994; Reference Ackley, Fritsen, Lytle and SullivanAckley and others, 1996).
Biomass and production
Chla concentrations averaging over 50 times that in the water column suggest net growth rates of the assemblages on the order of 0.1−0.2 d−1 if the habitats were colonized in late spring to early summer (e.g. November) and were seeded by populations at concentrations similar to those in the water column. Such rates are well within the range expected for sea-ice algal populations, as has been documented during time-series studies (e.g. Reference Grossi, Kottmeier, Moe, Taylor and SullivanGrossi and others, 1987; Reference Fritsen, Sullivan, Battaglia, Valencia and WaltonFritsen and Sullivan, 1999; Reference Günther and DieckmannGünther and Dieckmann, 1999) and by 14C incorporation methods (e.g. Reference Garrison and BuckGarrison and Buck, 1991; Reference Fritsen, Sullivan, Battaglia, Valencia and WaltonFritsen and Sullivan, 1999). Therefore, assemblage growth rates inferred from the biomass measurements alone do not require a dynamic environment that physically concentrates biomass within these habitats. However, the net production and accumulation of particulate matter, assuming redfield matter and C : chla ratios of 50−100 (w/w), is limited by nutrients in sea water (∼34 μMN at maximum concentrations) to approximately 25−50 μg chla L−1. Therefore, the higher biomass concentrations measured during this study and in similar habitats during different studies (e.g. Reference MeguroMeguro, 1962; Reference Burkholder and MandelliBurkholder and Mandelli, 1965; Reference Thomas, Lizotte and ArrigoThomas and others, 1998; Reference Fritsen, Sullivan, Battaglia, Valencia and WaltonFritsen and Sullivan, 1999) must invoke physical-chemical dynamics for either scavenging biota from the water column or transferring nutrients to and from the growing populations in order to achieve the concentrations of biomass documented.
Transport of dissolved material into and out of ice habitats has been documented on several occasions in sea ice. For instance, lateral nutrient gradients and inferred lateral nutrient transport (Reference Syvertsen and KristiansenSyversten and Kristiansen, 1993) as well as vertical nutrient exchanges (Reference Fritsen, Lytle, Ackley and SullivanFritsen and others, 1994; Reference Ackley, Fritsen, Lytle and SullivanAckley and others, 1996) have been documented in snow-infiltration and near-surface communities in the Weddell Sea. Scavenging of cells from the water column has also been documented (Reference Garrison, Ackley and BuckGarrison and others, 1983), yet these concentrating processes have been identified primarily for the formation stages of sea ice. We cannot unequivocally determine rates of exchanges of either dissolved or particulate material in the surface and freeboard habitats at this time. However, we can determine with certainty that the summer ice was not a closed system. Rather, the ice ecosystem was open to exchanges of materials that most likely occurred throughout large 1−3 cm diameter brine-tubes observed during the cruise as well as in association with cracks, ridges and edges of floes.
Nutrient concentrations in the water column beneath the ice were not severely depleted relative to those concentrations reported for surface waters of the Ross Sea during early-season non-bloom conditions (Reference ArrigoArrigo and others, 1999). Such water-column concentrations indicate that the overall sea-ice biota, although productive, did not bloom to the extent that they were drawing down the regional supply of nutrients to the extent that they would become limited by the nutrients in the surrounding sea water. Rather, it is likely that the magnitude of the rates of exchange of ice interstitial water and brine with the upper-water-column nutrients limited production on focal scales (centimeters to meters). It is especially likely that the supply of nutrients was limiting new production (sensu Reference Dugdale and GoeringDugdale and Goering, 1967) and growth in those specific surface and freeboard habitats where nitrate concentrations were depleted to levels below detection (Fig. 3).
The enhanced presence of NH4 (Fig. 3; Table 2) suggests that the surface and freeboard communities were actively regenerating nutrients, which is further indicative of advanced stages of a microbial-community succession supporting more active heterotrophic populations. Indeed micro-scopic examinations revealed a relatively diverse assortment of heterotrophic and mixotrophic cihates and flagellates (Table 3) and large bacteria (C. H. Fritsen and H.J. Marchant, personal observations). The range, absolute magnitudes and relative magnitudes of autotrophic biomass and heterotrophic biomass as determined by microscopy are similar to those observed in similar environments with well-developed heterotrophic members of the community in the Weddell Sea (Reference Garrison and BuckGarrison and Buck, 1991). The preponderance of heterotrophic biomass greater than 1 0 0 μg c L−1 in 40% of the samples in surface and near-surface habitats further demonstrates that these habitats develop to mature stages in a sequence where heterotrophic processes are likely to predominate. The importance of these heterotrophic processes in the summer-ice habitats for grazing, nutrient regeneration and trophodynamics of the sea-ice ecosystem is probably underestimated at present. We further contend that the notion that losses of autotrophic biomass due to either physical processes or grazing in sea ice are minimal (e.g. Reference LegendreLegendre and others, 1992) should be reconsidered, especially in respect of summer sea-ice communities (see also Reference Garrison and BuckGarrison and Buck, 1991). It is likely that the succession of these communities and their habitats will not be fully understood until time-series studies have been conducted in a similar manner to those that have been conducted at land-fast ice stations.
Conclusions
The geochemical characteristics, the biomass determinations and the microscopy all suggest that the surface and freeboard habitats were productive throughout sea ice in the Ross Sea during the austral summer. Similar conclusions have been reached for summer sea ice in proximity to Palmer Peninsula (Reference Burkholder and MandelliBurkholder and Mandelli, 1965), summer sea ice in the Weddell Sea (Reference Garrison and BuckGarrison and Buck, 1991) and summer ice in the Amundsen Sea (Reference Thomas, Lizotte and ArrigoThomas and others, 1998). Hence, it is increasingly apparent that surface and freeboard communities are a pervasive feature of the Antarctic pack ice present from spring to the late summer months. It is worth noting that these habitats were conspicuously absent during this cruise in McMurdo Sound, in the Bay of Whales and on fast ice near Sulzberger Bay, all of which are located over the continental shelf. Their widespread occurrence in the off-shelf pack-ice regime and their absence on the continental shelf supports the conceptual (Reference Garrison, Sullivan and AckleyGarrison and others, 1986) and mechanistic (Reference Fritsen, Ackley, Kremer, Sullivan, Lizotte and ArrigoFritsen and others, 1998) models describing where and when near-surface habitats and algal blooms will form in Antarctic sea ice.
Acknowledgements
This work has been supported by U.S. National Science Foundation grants OPP-9614201 (to D. L. Garrison and M. M. Cowing) and OPP-9814972 (to G. H. Fritsen). Our additional gratitude goes to M. M. Cowing for her help with core-sample collection and coordination of the program, and J. Boc for assistance in the preparation of the manuscript. We wish to thank Captain J. Barkowski and officers and crew of the R.V. nathaniel b. palmer for their continuing excellence in ship operations, as well as J. Barnes and the rest of the supporting Antarctic Science Associates team members for their invaluable contributions to this research.



