1 Introduction
Over the past 25 years, employment-based pensions have been shifting from traditional defined benefit (DB) plans in which employers bear most investment risks to defined contribution (DC) plans that place the investment responsibility on workers. Consequently, the number of households with retirement account assets has soared along with the number of households owning stocks inside those accounts. Between 1989 and 2008, the share of households with equities inside employer-sponsored retirement accounts more than doubled from 12% to 31% (Investment Company Institute and the Securities Industry and Financial Markets Association, 2008). About two-thirds of participant assets in 401(k) plans – the most widely used type of employer-sponsored DC plan – were invested in equities in 2007 (Investment Company Institute, 2008).
As 401(k) plans were becoming increasingly popular, the economy experienced significant booms and busts. Between March 1991 and March 2001, the economy prospered for an unprecedented 10 years (National Bureau of Economic Research [NBER], 2011). Then in 2000, the dot-com bubble burst and stock prices fell by double digits for three straight years. This triggered a relatively short recession in March 2001. The economy bounced back and expanded again for more than 6 years. Retirement account balances (DC plans and Individual Retirement Accounts [IRAs]) peaked at $8.7 trillion in the third quarter of 2007 before plummeting $2.7 trillion (31%) through the first quarter of 2009 as the stock market crashed (Butrica and Issa, Reference Butrica and Issa2011). Although retirement account balances have now recovered much of their value, they would have been significantly higher had the market not crashed and instead continued on its pre-crash path. The 2008 stock market crash coincided with the Great Recession, the longest of any recession since World War II (NBER, 2011), with the highest unemployment rates in nearly three decades and record-long unemployment spells.
While the economy has clearly taken investors on a rollercoaster ride of ups and downs during the past two decades, it is not clear how they have responded. This paper documents changes in DC plan participation and contributions between 1990 and 2009 and examines how they correspond to changes in the economy. Do 401(k) participants stop contributing or reduce their contributions during economic downturns? Do participants react similarly to all economic downturns, or do certain downturns, because of their severity, induce different or more dramatic behavioral responses? Do 401(k) participants respond more to busts than booms?
2 Background
Many Americans choose not to save for retirement, and the reason may be related to the changing pension landscape. The percentage of workers covered by a traditional DB pension plan that pays a lifetime annuity, often based on years of service and final salary, has been steadily declining over the past 25 years. Between 1989 and 2013, the proportion of private industry full-time workers participating in DB pension plans declined from 42% to 19%, while the share participating in DC plans – investment accounts established and often subsidized by employers, but owned and controlled by employees – increased from 40% to 51% (Wiatrowski, Reference Wiatrowski2011; Bureau of Labor Statistics, 2013).
As DB pensions are tied to employers, workers do not have to think about retirement savings. They are automatically enrolled, contributions are automatically deducted, and benefits are automatically paid when workers retire. With DB pensions, employers bear the responsibility for ensuring that employees receive pension benefits. In contrast, DC retirement accounts are owned by employees. Workers have to actively decide to participate in the plan, how much to contribute, which investments to put their money in, and whether to take benefits as an annuity or lump sum payment at retirement. With DC retirement accounts, workers bear the responsibility for their own financial security. This requires that individuals make informed and forward-looking decisions every step of the way. Moreover, in recent decades both the array of financial instruments and their complexity have increased – obligating investors to evaluate and understand many new and more sophisticated financial products. How well-equipped individuals are at making their savings decisions determines, at least in part, the amount of income in retirement they get to enjoy. However, recent studies have revealed less than encouraging information about retirees’ ability to adequately plan for retirement. Although DC plans have the potential to provide retirees with substantial retirement wealth, a typical household approaching retirement had 401(k)/IRA balances of only $42,000 in 2010 (Munnell, Reference Munnell2012).
Moreover, differences in pension wealth across gender and racial groups are substantial (Butrica and Johnson, Reference Butrica and Johnson2010). Although some of the differential is driven by factors beyond the individual's control, others such as participation, contribution level, and portfolio allocation are usually the result of the individual's decisions. If offered a plan, blacks and Hispanics are less likely to participate, tend to contribute a lower share of their earnings to the plan, and are more likely to withdraw funds from their accounts or borrow from them compared with whites. In addition, some evidence suggest that blacks, Hispanics, and women are often conservative investors and less willing to take on financial risk. However, it is not clear whether these conservative investment tendencies reflect innate preferences or merely blacks’ and women's relatively limited wealth holdings (Schubert et al., Reference Schubert, Brown, Gysler and Brachinger1999; Bajtelsmit and Bernasek, Reference Bajtelsmit and Bernasek2001). Blacks and women are also less likely than others to invest their 401(k) funds in equities, which historically have had higher rates of return than other investment types (Ariel Investments and Hewitt Associates, 2009).
With this in mind, it is not particularly surprising that participation rates among private wage and salary workers in 2013 who were offered an employer retirement plan were 87% in DB pensions, but only 71% in DC plans (Bureau of Labor Statistics, 2013). Even among full-time workers – whose participation rates are typically higher – participation rates were 89% in DB pensions but only 75% in DC plans (Bureau of Labor Statistics, 2013). Do workers not participate because of inertia – which automatic enrollment can fix? Or are they scared off by the financial decisions and responsibilities that go hand-in-hand with DC plans?
If the policy goal is to help retirees be financially independent and minimize poverty at older ages, it is important to understand how individuals think about retirement planning and how they make their financial decision along the way. Are individuals well equipped to make their own sound financial decisions in an environment where the responsibility of retirement saving is increasingly shifting from employers to workers and financial products are becoming ever more complex? Assuming they are, how are their decisions influenced by life events or the economy?
A number of studies have examined the impact of stock market crashes and economic downturns on older workers’ retirement decisions (Coile and Levine, Reference Coile and Levine2006, Reference Coile and Levine2011; Goda et al., Reference Goda, Shoven and Slavov2010). Other studies have analyzed the impact of stock market and labor market conditions on retirement income and assets (Engen et al., Reference Engen, Gale and Uccello2004; Brady, Reference Brady2009; Burtless, Reference Burtless and Orenstein2009; Gustman et al., Reference Gustman, Steinmeier and Tabatabai2009; Coile and Levine, Reference Coile and Levine2010). Butrica et al. (Reference Butrica, Smith and Toder2010) considered the impact of the 2008 stock market crash and alternative recovery scenarios on future retirement savings. The authors assumed that 401(k) participants would continue making the same total contributions to retirement accounts and would rebalance their portfolios to maintain the target allocation for their age. Their assumptions about how participants would behave in response to a stock market crash were necessary to isolate the effects of the stock market crash itself on retirement savings.
The current paper recognizes that retirement account assets depend not only on market performance, but also on individuals’ behavior – whether individuals contribute and how much they contribute – which could be influenced by many factors, including stock market performance and the economy. It uses restricted data from the Survey of Income and Program Participation (SIPP) linked to Social Security administrative data on earnings and contributions from 1990 to 2009. These data have a number of advantages over other data sources. First, information on participation and contributions come from actual tax records and are not subject to the measurement error common in self-reported data (Dushi et al., Reference Dushi, Iams and Tamborini2011, Reference Dushi, Iams and Tamborini2013). Second, unlike data collected by employers, financial/investment firms, or trade associations, these data are nationally representative. Third, they provide detailed information on the demographic characteristics, economic situation, and life events of workers and their spouses, which likely influence workers’ participation and contributions in DC plans. Finally, these data provide 20-year longitudinal measures of participation and contributions independent of workers’ employers.
Similar studies using survey data alone rely on self-reports of 401(k) participation and contributions. For example, Muller and Turner (Reference Muller and Turner2011) used the Panel Study of Income Dynamics and found that 401(k) participation is influenced by the performance of the stock market. However, this study relies on self-reported 401(k) information, which can be unreliable because most workers are not well informed about their retirement plans (Mitchell, Reference Mitchell1988; Johnson et al., Reference Johnson, Sambamoorthi and Crystal2000; Gustman et al., Reference Gustman, Steinmeier and Tabatabai2007). Similar studies using administrative, employer-level, or plan-level data alone often lack detailed information about participants to accurately gauge how key demographic and economic shocks that can occur over the lifecourse might affect their participation and contributions in retirement plans. For example, Utkus and Young (Reference Utkus and Young2009) used Vanguard DC plan data and found that 16% of plan participants changed their asset allocation during 2008 (only slightly higher than the trading rates in the prior two years), and 3.1% of active participants stopped their elective deferrals in 2008 (only slightly higher than the 2.4% in 2007). However, their study did not control for other events that may have triggered these responses – such as the birth of a child or a home purchase.
Our study suffers from neither of these problems because it combines detailed information on demographic characteristics and lifecourse events with tax records. It is similar to research by Smith et al. (Reference Smith, Johnson and Muller2004) that used these same data and found that key life events, such as the birth of a child and the purchase of a home, influence contributions in DC plans. However, our study updates Smith et al. (Reference Smith, Johnson and Muller2004) using more recent data and extends it by also considering the effects of economic expansions and contractions on 401(k) participation and contributions.
3 Theoretical framework
Economic theory maintains that people save in order to smooth consumption over time. The standard models predict that people defer current consumption and set money aside for the future so as to equalize the marginal utility of consumption in the present period with the expected marginal utility in future periods. This equilibrium condition implies that an unexpected increase in current consumption needs or an unexpected decline in current income will induce people to reduce savings, perhaps in part by lowering their contributions to employer-sponsored retirement plans. Possible examples of these shocks include the loss of a spouse (due to death or divorce), the onset of health problems for a family member or oneself, a spell of unemployment, a stock market crash, or a recession.
When stock market returns plummet or the economy contracts, we would expect to see declines in 401(k) participation because workers may be reluctant to commit to saving. For workers who continue to participate when the stock market crashes or the economy is in a recession, we would expect to see declines in 401(k) contributions because workers may be pessimistic that the stock market will rebound, feel uncertain about their future wages or job prospects, or because their spouses may have lost their jobs in the recession. Of course, there is the possibility that 401(k) participation and contributions can change independent of employee behavior if, for example, workers lose their jobs in a recession and are not eligible to participate, employers freeze enrollment for new participants, or employers reduce wages, reduce matching contributions, or freeze contributions for current participants.
Key lifecourse events, such as the birth of a child or the purchase of a home, can also lead people to reduce retirement contributions. But workers might choose to maintain their plan contributions and instead increase current spending by borrowing from their 401(k) plans, especially if the shock to income or consumption needs is temporary. Many plans allow workers to borrow from their retirement accounts. The most common reason for 401(k) loans is to purchase a home or make home improvements or repairs (Munnell and Sundén, Reference Munnell and Sundén2004).
4 Methodology
We examine contributions to employer-sponsored retirement plans over time and how they interact with key life events for a large sample of workers. The data come from the 1996, 2001, 2004, and 2008 panels of the SIPP pooled together and linked to administrative data from the Social Security Administration's (SSA) Detailed Earnings Record (DER) and Summary Earnings Record (SER).
The SIPP provides basic demographic data, including age, race, gender, marital status, and education, as well as information about employment status, income, and earnings. Special topical modules provide additional information on marital histories, fertility histories, employment histories, disability, asset holdings, and employer-sponsored pension participation. In particular, the survey asked respondents with work limitations about when their health problems started, and asked homeowners about when they purchased their homes. Thus, the data allow us to identify the timing of key life events, including marriages, divorces, widowhood, the birth of a child, the onset of health problems that limit the ability to work, and the purchase of a home. As the survey interviewed all adult members of the household, it also provides information about key transitions in the spouse's life.
The DER contains information collected from the Internal Revenue Service's Form W–2, which employers must file to report salaries and benefits they pay to their employees, as well as self-employment income from Schedule SE (Olsen and Hudson, Reference Olsen and Hudson2009). The DER provides annual information on total earnings, earnings covered by Social Security and Medicare, taxable earnings from 1978 to 2009, and worker contributions to employer-sponsored retirement accounts from 1990 to 2009.Footnote 1 The DER file also includes employer identification codes enabling users to calculate job tenure and identify respondents who change jobs over time.
We restrict the sample to wage and salary workers ages 20–69 who report positive earnings in the given year.Footnote 2 We exclude workers younger than 20 because many employers do not allow them to participate in retirement plans, and we exclude workers older than 69 because people must begin withdrawing funds from DC plans at age 70½. Our sample includes 851,841 person-year observations between 1990 and 2009 for over 168,000 individuals. We express all dollar amounts in constant 2011 dollars (indexed to changes in the Consumer Price Index).
We define wage and salary workers as individuals with positive earnings from any job in a calendar year and with at least half of their total annual earnings from wage and salary employment.Footnote 3 Workers are offered DC plans if: (1) they report on the SIPP pension topical module that their employer offered a DC plan and that they were eligible to participate; or (2) they made a DC contribution in any year while on the pension job up to and including the SIPP pension topical module year.Footnote 4 Workers participate in DC plans if their W-2 data show contributions to a DC plan during the calendar year from 1990 to 2009.Footnote 5 We sum all worker contributions (as reported in box 12 of workers’ W-2 forms) from all jobs in a calendar year to create our measure of total annual contributions, and we divide this amount by total annual earnings to create our measure of contribution rates.Footnote 6
We begin our analyses by showing how DC offer rates have changed over time. We then show participation rates, contribution levels, and contribution rates by year, age, and earning level. We then estimate logit models of the participation decision and linear regression models of the level of contributions for workers contributing to their retirement plans. Predictors in the models include age and its square (to capture nonlinear effects of age), age splines with kinks at age 30, 40, 50, and 60, marital status, log of own and couple earnings, number of work years since age 20, unemployment (measured as a full calendar year with no earnings), the number of children under age 18, the presence of a work limitation, the presence of a working spouse, and indicators (during the current year) of the onset of work limitations, the purchase of a home, the birth of a child, the death of a spouse, the dissolution of a marriage through divorce, and a job change.Footnote 7 We also include SIPP panel dummies and year dummies to capture changes in 401(k) behavior over time. We are particularly interested in the sign and magnitude of the year dummies, which may capture or reflect macroeconomic conditions including the unemployment rate, gross domestic product (GDP), and stock market performance.
5 Results
5.1 DC offer rates
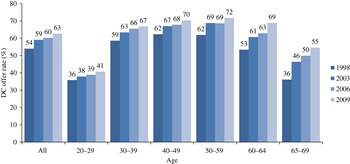
The share of wage and salary workers offered DC plans has increased over time, rising from 54% in 1998 to 63% in 2009 (Figure 1). This percentage is fairly similar to that in the National Compensation Survey, which reports that 55% of civilian workers were offered a DC plan in 2013 (BLS, 2013). This trend reflects the increase in employers offering DC pensions – either replacing or in addition to their DB pensions, as well as the increase in finance and service jobs that typically offer DC plans and the decline in manufacturing jobs that typically offered DB pensions. Although DC offer rates increased for all age groups, prime age workers (those ages 30–59) are more likely to work in jobs that offer DC pensions than are younger or older workers.
(colour online) DC offer rate among wage and salary workers ages 20–69, by age and year. Source: Authors’ tabulations of the 1996, 2001, 2004, and 2008 SIPP pension topical modules matched to the Social Security Administration's Detailed Earnings Record (DER).

5.2 Participation
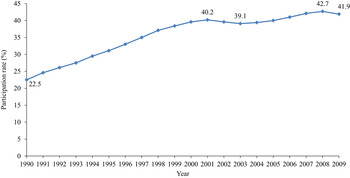
Among wage and salary workers ages 20–69, the share contributing to employer-sponsored retirement accounts, not conditional on being offered a DC plan, increased sharply between 1990 and 2001 (rising from 22.5% to 40.2%) (Figure 2). Participation then dipped slightly between 2001 and 2003 (falling from 40.2% to 39.1%) with the 2001 recession, dot.com stock market crash, and high unemployment period from 2002 to 2004.Footnote 8 After 2003, participation rates increased again, but much more gradually, and peaked at 42.7% in 2008. Coinciding with the Great Recession, participation rates fell in 2009 to 41.9%. Again, this percentage is fairly similar to that in the National Compensation Survey, which reports that 38% of all civilian workers participated in a DC plan in 2013 (BLS, 2013).
(colour online) Participation rate among wage and salary workers ages 20–69, by year. Source: Authors’ tabulations of the 1996, 2001, 2004, and 2008 SIPP data matched to the Social Security Administration's Detailed Earnings Record (DER).

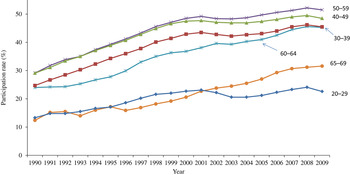
As DC plans became more common, participation rates, not conditional on being offered a DC plan, increased between 1990 and 2001 for all ages (Figure 3). Since 2001, participation rates leveled off for workers under age 50, but continued to rise for workers over age 50. Note, however, that participation rates have distinct recession dips between 2001 and 2003 and between 2008 and 2009. The recession dips are bigger for younger workers than for older workers, but participation rates declined for all workers under age 60 during both recessions.
(colour online) Participation rate among wage and salary workers ages 20–69, by age and year. Source: Authors’ tabulations of the 1996, 2001, 2004, and 2008 SIPP data matched to the Social Security Administration's Detailed Earnings Record (DER).

Much of the observed changes in historic DC participation rates reflect changes in employer offer rates. Only workers offered a DC plan can participate, and offer rates have increased over time as employers increasingly offer these types of plans.
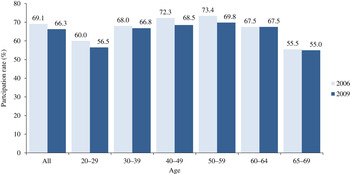
Participation rates among workers offered a DC plan are higher than participation rates among all workers. About 69% of workers offered a DC plan in 2006 made contributions to their plan (Figure 4). This percentage is identical to that in the National Compensation Survey, which reports that 69% of civilian workers with access to a DC plan participated in 2013 (BLS, 2013).
(colour online) Participation rate among wage and salary workers ages 20–69 offered a DC plan, by age and year. Source: Authors’ tabulations of the 1996, 2001, 2004, and 2008 SIPP data matched to the Social Security Administration's Detailed Earnings Record (DER).

Among those offered a plan, participation rates rise with age until 59 and decline at older ages. Younger and older workers are both less likely to be offered a DC plan and less likely to participate when they are offered a plan compared with workers in their 50s.
Conditional on having a DC plan offer, we still see a significant drop in DC participation between 2006 (based on the 2004 SIPP panel) and 2009 (based on the 2008 SIPP panel) in response to the Great Recession. Among all workers offered a DC plan, participation fell from 69.1% in 2006 to 66.3% in 2009. Although participation rates are highest among 40–49-year-olds and 50–59-year-olds, these groups also experienced the largest drops in participation between 2006 and 2009.
5.3 Contribution levels and rates
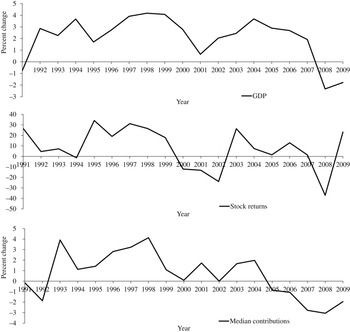
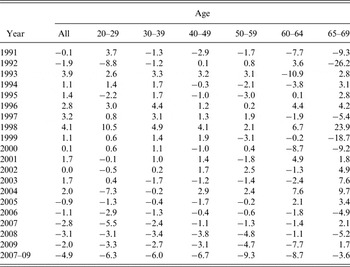
Changes in median DC contribution amounts mirrored changes in GDP and stock returns between 1991 and 2009 – particularly starting in 2002 (Figure 5). For example, amid booming economies median DC contributions increased 19.1% between 1992 and 1999 (about 2.5% per year) and 3.7% between 2002 and 2004 (about 1.8% per year) (Appendix Table 1). They declined 4.6% between 2004 and 2007 (−1.5% per year) as the booming housing market began to reverse, and another 4.9% between 2007 and 2009 (−2.5% per year) with the stock market crash and Great Recession.
Percent change in contribution amount among wage and salary workers ages 20–69 participating in a DC plan compared with change in GDP and stock returns, by year. Source: Authors’ tabulations of the 1996, 2001, 2004, and 2008 SIPP data matched to the Social Security Administration's Detailed Earnings Record (DER).

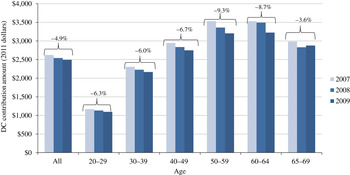
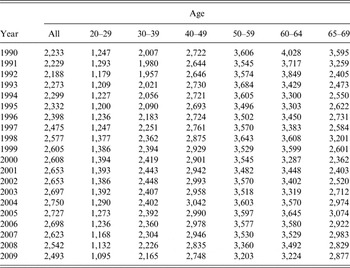
Workers ages 50–64 were the hardest hit by the recent economic downturn (Figure 6). Between 2007 and 2009, median contributions declined 9.3% from $3,530 to 3,203 for those ages 50–59 and 8.7% from $3,529 to 3,224 for those ages 60–64 (Appendix Table 2). Contributions of workers ages 65–69 declined the least over this time period – only 3.6% from $2,983 in 2007 to $2,877 in 2009.
(colour online) Median contribution amount and percent change among wage and salary workers ages 20–69 participating in a DC plan, by age and year. Source: Authors’ tabulations of the 1996, 2001, 2004, and 2008 SIPP data matched to the Social Security Administration's Detailed Earnings Record (DER).

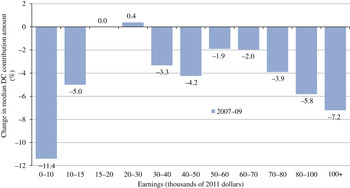
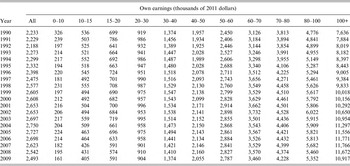
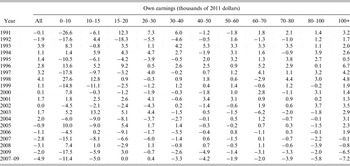
The lowest and highest earners experienced the largest decline in contribution levels as a result of the recession (Figure 7, Appendix Tables 3 and 4). Compared with their DC contributions in 2007, workers making under $10,000 contributed 11.4% less in 2009. At the other end of the earnings distribution, workers making $80,000 to 100,000 contributed 5.8% less and workers making more than $100,000 contributed 7.2% less in 2009. Since median contribution amounts are well below the statutory maximum contribution limits, reductions in contribution amounts are not due to changes in contribution limits, which increased over this period.
(colour online) Percent change in median contribution amount among wage and salary workers ages 20–69 participating in a DC plan, by earnings. Source: Authors’ tabulations of the 1996, 2001, 2004, and 2008 SIPP data matched to the Social Security Administration's Detailed Earnings Record (DER).

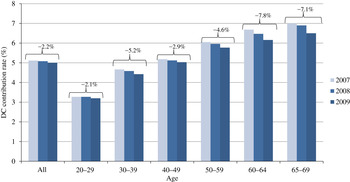
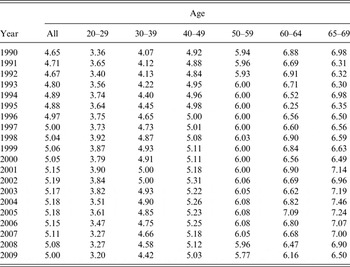
Contributions can increase even if workers do not change their contribution rates. All else equal, contributions will increase if earnings increase. However, we also find that contribution rates (contribution amount divided by total earnings) declined with the Great Recession (Figure 8 and Appendix Table 5). For the typical DC participant, contribution rates declined 2.2% between 2007 and 2009, from 5.1% to 5.0%. The largest changes occurred among the oldest workers. Between 2007 and 2009, median contribution rates declined 7.8% for workers ages 60–64 and 7.1% for those ages 65–69. In contrast, they declined only 2.1% for workers ages 20–29.
(colour online) Median contribution rate and percent change among wage and salary workers ages 20–69 participating in a DC plan, by age and year. Source: Authors’ tabulations of the 1996, 2001, 2004, and 2008 SIPP data matched to the Social Security Administration's Detailed Earnings Record (DER).

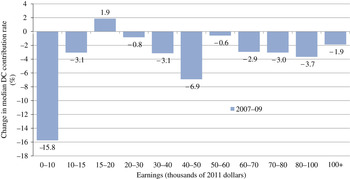
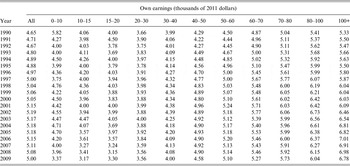
Among participants, median contribution rates for the lowest earners declined 15.8% between 2007 and 2009 from 4.0% to 3.4% (Figure 9 and Appendix Table 6). They declined 6.9% for workers earning $40,000–50,000 from 4.9% to 4.6%. Median contribution rates also declined 3.7% (from 6.3% to 6.0%) for workers making $80,000–100,000.
(colour online) Percent change in median contribution rate among wage and salary workers ages 20–69 participating in a DC plan, by earnings. Source: Authors’ tabulations of the 1996, 2001, 2004, and 2008 SIPP data matched to the Social Security Administration's Detailed Earnings Record (DER).

5.4 Multivariate analysis of participation
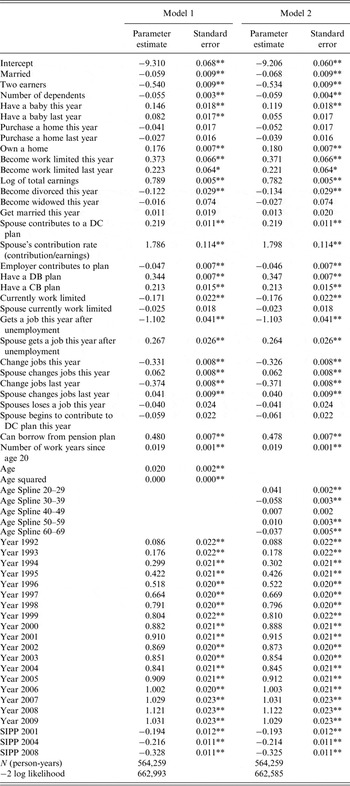
Table 1 reports logistic regression coefficients of participation from 1991 to 2009 among workers offered a DC plan. Models 1 and 2 vary only in the age specification: model 1 includes age and age squared, and model 2 includes age spines. The models control for many of the same variables as in Smith et al. (Reference Smith, Johnson and Muller2004), but also include year dummies. Many of the coefficients have the expected sign. For example, both models show that workers’ probability of participating increased with earnings, more work years, and age. Workers who changed jobs or returned to work after a spell of unemployment were less likely to participate in a DC plan surrounding their job change. This may reflect either waiting periods for new workers or failure to initially enroll in offered plans with new employers. Less intuitive is the finding that the probability of participating declined when the employer contributed to the plan. One explanation is that some workers stop participating when their employers lower the matching contribution – which happened during the recent recessions (Munnell and Quinby, Reference Munnell and Quinby2010). Another explanation might be that some workers have particular savings targets and choose to divert less of their current income to savings when their employers save on their behalf.
Logistic regression of the likelihood of wage and salary workers ages 20–69 participating in 401(k) plans conditional on being offered a plan (1991–2009)

** indicates p<0.001; * indicates p<0.01.
Notes: Table includes wage and salary workers ages 20–69 offered a DC plan in years 1991 to the SIPP interview year over the duration of the SIPP interview pension job.
Source: Authors’ tabulations of the 1996, 2001, 2004, and 2008 SIPP data matched to the Social Security Administration's Detailed Earnings Record (DER).
While this finding is in contrast to what some researchers have found (Engelhardt and Kumar, Reference Engelhardt and Kumar2007), our study uses 401(k) information from tax records and controls for a number of demographic characteristics and lifecourse events that other studies have not done. Furthermore, this finding is consistent with what Smith et al. (Reference Smith, Johnson and Muller2004) found using the same data source for earlier years.
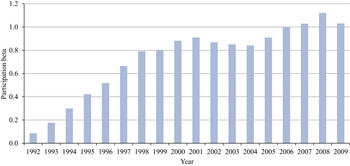
Our key variables of interest here are the year dummies. The probability that a worker participated in a DC plan increased every year between 1991 and 2001, but then declined between 2001 and 2004 as the recession progressed and unemployment rates increased. Participation probabilities increased again between 2005 and 2008, and then declined after 2008 as the recession progressed and unemployment rates increased. The impact of the 2001 and 2008 recessions on participation probabilities continued past the official end of both recessions. The coefficients for 2001 and 2003 differ statistically from each other, as do the coefficients for 2008 and 2009 – suggesting that DC participation did change before and after each of these recessions.Footnote 9
Figure 10 graphically compares the unadjusted logistic parameter estimates for the year dummies (omitted year is 1991). The coefficients represent a 1.2 percentage point reduction between 2001 and 2003, and a 1.7 percentage point reduction between 2008 and 2009 due to the recessions – even after controlling for other factors. The difference in DC participation between each set of years is statistically different from zero.
(colour online) Unadjusted year-dummy logistic regression parameter estimates of DC participation among wage and salary workers ages 20–69 offered a DC plan. Source: Authors’ tabulations of the 1996, 2001, 2004, and 2008 SIPP data matched to the Social Security Administration's Detailed Earnings Record (DER).

5.5 Multivariate analysis of contribution amount
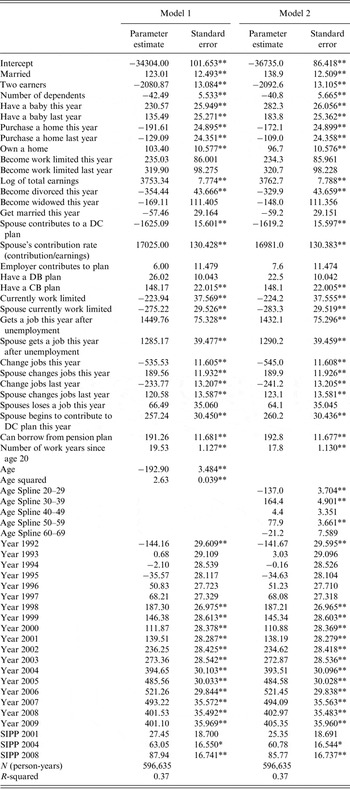
Table 2 reports the results from our ordinary least squares (OLS) regression of 401(k) retirement contributions for participating workers. This model controls for many of the same variables as in Smith et al. (Reference Smith, Johnson and Muller2004), but also includes year dummies. We find that many of the relationships shown in this table are similar to those in the original study.
OLS regression estimates of contribution amount among wage and salary workers ages 20–69 participating in a 401(k) Plan (1991–2009)

** indicates p<0.001; * indicates p<0.01.
Notes: Table includes wage and salary workers ages 20 to 69 participating in a DC plan in years 1991 to the SIPP interview year over the duration of the SIPP interview pension job.
Source: Authors’ tabulations of the 1996, 2001, 2004, 2008 SIPP data matched to the Social Security Administration's Detailed Earnings Record (DER).
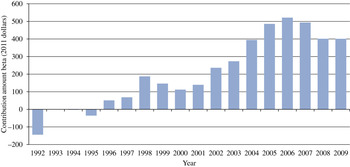
Holding other factors constant, contributions increased from 1995 to 1998, declined until 2000, and then increased until 2006. After 2006, contributions declined through 2009 (see also Figure 11). Models 1 and 2 are identical except for the age specification, and both models find nearly identical contribution patterns by year. The coefficients for 2007 and 2009 differ statistically from each other – suggesting that DC contributions did change before and after the Great Recession even after controlling for worker characteristics and lifecourse events. This finding is consistent with Dushi et al. (Reference Dushi, Iams and Tamborini2013) who use the same data, as well as with Brien and Panis (Reference Brien and Panis2013) who use Form 5500 data. We find no evidence that contributions were statistically different before and after the prior recession, even though participation was.
(colour online) Unadjusted year-dummy OLS regression parameter estimates of DC contribution amounts among wage and salary workers ages 20–69 participating in a DC plan (2011 dollars). Source: Authors’ tabulations of the 1996, 2001, 2004, and 2008 SIPP data matched to the Social Security Administration's Detailed Earnings Record (DER).

Interestingly, when we consider the year coefficients in the participation and contribution models, we find that lower contributions precede recessions, while lower participation follows recessions. It appears that workers first lower their contribution amount and later change their decision to participate.
Unfortunately, our data do not include information about automatic enrollment. They also do not include information about changes in employer contributions in years other than the SIPP pension topical module year. Participation and contribution behaviors are likely affected by these and other factors for which we cannot control. Despite these limitations, our results strongly suggest that economic forces, beyond just their effects on earnings and employment, influence workers’ retirement saving behavior.
6 Discussion
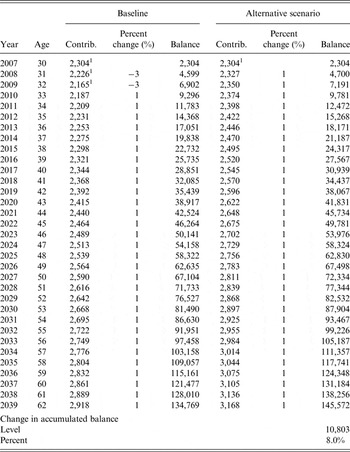
To give some context to our findings, we consider what would happen to long-run retirement account balances if workers reduced their contributions between 2007 and 2009 by the same amount observed in the data and then began increasing their contributions 1% per year in 2010. We compare retirement account balances under this scenario with those under a scenario which assumes that workers did not reduce their contributions between 2007 and 2009, but instead increased them by 1%.
Our data show that the typical 30-year-old worker contributed $2,304 in 2007 and reduced his contributions by 6% or $139 between 2007 and 2009 (Appendix Table 1). His retirement account balance at age 62 is projected to be just under $135,000 (Table 3). (This assumes contributions begin increasing 1% per year in 2010 and that accumulated balances earn a 3% annual rate of return.) If instead of reducing his contributions between 2007 and 2009, he increased them just 1% each year, his account balance at age 62 would be $145,572 – a difference of $10,803 or 8.0%. The further individuals were from retirement when the recession occurred and the higher their contributions before the recession, the larger the potential negative impact on their retirement savings. Of course, workers can recoup some or all of their investment losses by increasing their future contributions. For example, our hypothetical worker could recoup all of his losses from the recession by increasing his baseline contribution in 2010 by $485, and then continuing future contributions at the higher level under the alternative scenario. The regression results in Table 1 show that participation is lower immediately following a spell of unemployment, suggesting it is difficult to get back on track after losing a job. But for workers who do contribute after an unemployment spell (Table 2), they tend to contribute higher amounts on average in an attempt to catch up. For those who do not catch up, the recession will amount to a real loss in retirement savings.
Long-term impact of the recession on the retirement account balances of a typical 30-year-old (in 2011 dollars)

Notes: The baseline scenario assumes that contributions increase 1% each year starting in 2010. The alternative scenario assumes that contributions increase 1% each year starting in 2008. Both scenarios assume a 3% rate of return on account balances.
Source: Authors’ tabulations of the 1996, 2001, 2004, and 2008 SIPP data matched to the Social Security Administration's Detailed Earnings Record (DER).
1 Median contribution amounts for a 30–39-year-old wage and salary participant based on positive deferred contributions on the DER from 1990 to the SIPP interview year (Appendix Table 1).
7 Conclusions
With the erosion of DB pensions and the growth in DC plans, sound retirement planning increasingly depends on the commitment of individuals to invest in retirement accounts throughout their work lives. A better understanding of the factors influencing workers’ 401(k) behavior could help policymakers design policies that encourage higher participation and contribution levels throughout workers’ careers, thus enhancing private retirement savings so that retirees may rely less on Social Security benefits.
We find that the Great Recession, more so than each of the previous two recessions, had a large negative impact on DC participants’ behavior. The significant differences in the year dummies suggest that workers may be changing their 401(k) behavior in response to expectations about the economy and stock market. Participation dropped off slightly, while contribution amounts and contribution rates declined dramatically – even after controlling for changes in life events also likely to influence participation and contributions. The decline in worker participation after the 2001 and 2008 recessions occurred despite the increased adoption of automatic enrollment. The decline in participation is especially sharp for younger workers who were more likely to be new employees and automatically enrolled in their employers’ retirement plans. This suggests that economic forces outweigh inertia in participation decisions.
Although the typical worker reduced his annual contributions only $130 as a result of the Great Recession, this represented a decline of 4.9%. This is especially troubling when one considers that the median contribution amount before the recent recession began was only about $2,600 – far less than the 2007 legislated contribution limits of $15,500 for workers under age 50 and $20,500 for those ages 50 and older. Workers were already contributing to their retirement savings far less than permitted, and now they are contributing even less.
Finally, our results suggest that workers’ participation and contribution decisions are not always made simultaneously, at least with regard to their response to recessions. As the economy falters, workers first lower their contribution amounts and later change their decision to participate. Lower contributions precede recessions, while lower participation follows recessions.
Appendix
Median contribution amount for wage and salary participants ages 20–69, by year and age (in 2011 dollars)

Change in median contribution amount for wage and salary participants ages 20–69, by year and age (percent)

Median contribution amount for wage and salary participants ages 20–69, by year and own earnings (in 2011 dollars)

Change in median contribution amount for wage and salary participants ages 20–69, by year and own earnings (%)

Median contribution rate for wage and salary participants ages 20–69, by year and age (%)

Median contribution rate for wage and salary participants ages 20–69, by year and own earnings (%)