In many areas of social science inquiry, hypotheses cannot be tested with randomized treatments and laboratory-levels of control. Scholars must instead draw inferences based on either observational data or experiments conducted with imperfect levels of compliance. As a consequence, a great deal of attention has gone into developing methods to generate unbiased estimates of causal effects in the presence of unmeasured confounders that influence both outcomes and the probability of treatment. A frequent choice is applying instrumental variables (IVs) analysis to generate unbiased estimates of causal effects.
In this note, we show that Bayesian estimation methods for bivariate probit models are superior to traditional maximum likelihood (ML) routines. Bayesian methods provide more accurate estimates of key model parameters in realistic settings. Further, the Bayesian approach facilitates the direct calculation of important causal quantities of interest along with measures of uncertainty.
After presenting the bivariate probit IV model, we report results from two studies contrasting the performance of Bayesian and ML algorithms. First, using simulated data, we show that Bayesian bivariate probit models outperform the ML routine in terms of bias and coverage, especially in the presence of weak instruments or small sample sizes. Second, we compare ML and Bayesian estimates using the Sondheimer and Green (Reference Sondheimer and Green2010) data set, which estimates the effect of educational attainment on voter turnout, and show that the differences in estimation methods can affect substantive conclusions in a real-world application.
BIVARIATE PROBIT MODELS FOR ESTIMATING CAUSAL EFFECTS
While IV models are increasingly common in political science (cf., Sovey and Green Reference Sovey and Green2010, 194), some researchers find the standard approach—two-stage least squares (2SLS)—too inflexible and difficult to adjust to handle common data types. In particular, social scientists frequently encounter instances where both the endogenous regressor and the outcome variable are dichotomous. In these cases, some authors have suggested a bivariate probit model. For instance, Angrist and Pischke argue that, ‘‘Bivariate probit probably qualifies as harmless in the sense that it’s not very complicated and easy to get right using packaged software routines’’ (Reference Angrist and Pischke2009, 201).
Indeed, bivariate probit models have appeared regularly in prominent political science work in the past (e.g., Gerber and Green Reference Gerber and Green2000; Arceneaux and Nickerson Reference Arceneaux and Nickerson2009), and continue to be used regularly even in the discipline’s most prestigious journals (Maves and Braithwaite Reference Maves and Braithwaite2013; Fuhrmann and Sechser Reference Fuhrmann and Sechser2014; Cederman, Hug and Wucherpfennig Reference Cederman, Hug, Schadel and Wucherpfennig2015). Most often this is justified by the desire to appropriately handle an endogenous regressor when both the instrument and the outcome are binary. Wucherpfennig, Hunziker and Cederman state that, “[W]e rely on a seemingly unrelated bivariate probit estimator. This is a framework suitable for two processes with dichotomous outcomes for which the error terms are correlated” (Reference Wucherpfennig, Hunziker and Cederman2016, 11).
Superficially, bivariate probit models represent a modest adjustment to standard IV models. Yet, correctly implementing the model is challenging. First, ML bivariate probit algorithms in common software suites can be inaccurate (e.g., Freedman and Sekhon Reference Freedman and Sekhon2010). Second, estimates for treatment effects are difficult to calculate directly from standard model outputs. Quantities of interest such as the average treatment effect (ATE) require further calculations and uncertainty estimates for these quantities are not directly available.
Approach
We consider the problem of identifying a causal effect in the context of the potential outcomes framework (Rubin Reference Rubin1974). Let y∈{0,1} be a binary outcome, T∈{0,1} be a treatment variable, and x i be a vector of covariates (including a constant) for observation i∈[1, 2, … , n]. We observe an outcome y i which is a realization of one of two potential outcomes (y i0, y i1) corresponding to the two possible levels of treatment (T i0,T i1). Thus, y i0 and y i1 are random variables such that
 $$\matrix{ {y_{{i0}} } \, {\equals} \, {1({\bf x}_{i} \rgamma _{2} {\plus}\eta _{i} \,\gt\,0)} \hfill \cr {y_{{i1}} } \hfill \, {\equals} \hfill \, {1(\beta {\plus}{\bf x}_{i} \rgamma _{2} {\plus}\eta _{i} \,\gt\,0),} \hfill \cr } $$
where η
i
is a symmetric unobserved error term centered at 0, and 1(⋅) is the standard indicator function. The ATE is then
 ${\Bbb E}(y_{1} ){\minus}{\Bbb E}(y_{0} )\,\equiv\,{\rm \Delta }$
. Assuming that f(⋅|
μ
) is the probability density function (PDF) for the error term η, F(⋅|
μ
) is the cumulative density function (CDF), and
μ
represents any parameters defining f(⋅), then Δ=F(β+xγ2|
μ
)−F(xγ2|
μ
).
Assuming that the unobserved errors are conditionally independent of the treatment, η i ⊥T i |x i , the ATE can be estimated using standard regression techniques (Rosenbaum and Rubin Reference Rosenbaum and Rubin1983). However, in many settings, this assumption does not hold; some factors may affect both the treatment assignment and the outcome. In this scenario, estimates from standard linear models are known to be inconsistent.
To generate consistent estimates of Δ, we introduce a variable,Footnote 1 z, that is related to T but is independent of y conditioned on the covariates. With some additional assumptions, it is then possible to apply methods from structural equation modeling to generate consistent estimates of causal effects (Chib Reference Chib and Greenberg2003). The basic approach is to solve a system of simultaneous equations:
 $$\eqalignno{ & T_{i} \,{\equals}\,1({\bf{x}} _{i}\!{{\rm '}} \rgamma _{1} {\plus}z_{i} \pi {\plus}\eta _{{1i}} \,\gt\,0) \cr & y_{i} \,{\equals}\,1({\bf{x}} _{i}\!{{\rm '}} \rgamma _{2} {\plus}T_{i} \beta {\plus}\eta _{{2i}} \,\gt\,0), $$
where
 $(\eta _{{1i}} ,\eta _{{2i}} ){{\rm '}} \sim f^{{(2)}} ({ { \bbbeta }} \!\mid\!{\mib \bmu } )$
is some bivariate PDF defined by parameters
μ
.
Model Specification And Likelihood
Correctly estimating Model (2) will, given additional assumptions, allow us to correctly estimate the various model parameters and thus the causal quantities of interest (Angrist, Imbens and Rubin Reference Angrist, Imbens and Rubin1996; Chib Reference Chib and Greenberg2003). We make four assumptions. Assumption 1 states that the instrument has a conditional effect on the endogenous treatment, or more formally COV(z, T| X )≠0. Assumption 2, commonly referred to as the exclusion restriction, states that knowledge about the data-generating process of the instrument will not effect the outcome except through the treatment. Assumption 3, the stable unit treatment value assumption, states that the potential outcomes for each person are unrelated to the treatment received by other observations. Finally, Assumption 4 states that the unmeasured errors are distributed according to a bivariate normal distribution symmetric around the vector 0 with covariance matrix Ω.Footnote 2
Letting ϕ (2)(⋅) be a bivariate normal PDF and Φ(2)(⋅) be the CDF, we can formalize this model by letting (η 1i , η 2i )′=(ε 1i , ε 2i )′~ iid ϕ (2)(0, Ω) in Equation 2. To identify the model, we set ω 11=ω 22=1 and ω 12=ω 21=ρ∈[0,1], which means that Ω is a correlation matrix. The likelihood can then be expressed as:
 $$\eqalignno{ L(y,T\! \mid \!{\bf x},z,\rgamma _{1} ,\rgamma _{2} ,\beta ,{\bf \Omega })\,{\equals}\, & \prod\nolimits_{\,i\,\in\,{\scr F}} {{\rm \Phi }^{{(2)}} \left( {\left( {\matrix{ \,\,\,{{\minus}(x_{i} \rgamma _{1} {\plus}z_{i} \pi )} \hfill \cr {(2y_{i} \,{\minus}\,1)(x_{i} \rgamma _{2} )} \hfill \cr } } \right),{\bf \Omega }} \right)} \cr & {\times}\prod\nolimits_{\,i\,\in\,{\cal G}} {{\rm \Phi }^{{(2)}} \left( {\left( {\matrix{ \,\,\,\,\quad{x_{i} \rgamma _{1} {\plus}z_{i} \pi } \hfill \cr {(2y_{i} \,{\minus}\,1)(x_{i} \rgamma _{2} {\plus}\beta )} \hfill \cr } } \right),{\bf \Omega }} \right),} $$
where
 ${\scr F}$
is the subset where we observe T
i
=0, and
 ${\cal G}$
represents the subset where T
i
=1.
Bayesian Estimation
The model in Equation 3 can be estimated with several possible ML routines. However, previous work by Freedman and Sekhon suggests caution:
In multidimensional problems, even the best numerical analysis routines find spurious maxima for the likelihood function. Our models present three kinds of problems: (1) flat spots on the log likelihood surface, (2) ill-conditioned maxima, where the eigenvalues of the Hessian are radically different in size, and (3) ill-conditioned saddle points with one small positive eigenvalue and several large negative eigenvalues (Reference Freedman and Sekhon2010, 144).
Thus, we turn to a Bayesian approach for estimating this model, which sometimes offers superior performance for models with multiple maxima and which can incorporate prior structure to improve numerical performance where the likelihood is difficult to characterize.
The Bayesian model is implemented in the Stan modeling language using no-U-turn sampling (Hoffman and Gelman Reference Hoffman and Gelman2014). Full replication code along with additional discussion of the model is provided in the Online Appendix.
Calculating Quantities of Interest
To calculate the actual treatment effects of interest, we first estimate the interim quantity
 ${\rm \Delta }_{i}^{{(ATE)}} \,{\equals}\,{\rm \Phi }({\bf{x}} _{i}{{\rm \!'}} \rgamma _{2} {\plus}\beta )\,{\minus}\,{\rm \Phi }({\bf{x}} _{i}{{\rm \!'}} \rgamma _{2} )$
. We evaluate this quantity at the observed value of the covariates
x
i
. We then calculate
 ${\rm \Delta }^{{(ATE)}} {\equals}\mathop \sum\nolimits_{i{\equals}1}^n {\rm \ztbnd \Delta }_{i}^{{(ATE)}} \,/\,n$
. Crucially, calculating Δ(ATE) for each draw from the posterior provides a posterior distribution for the ATE.
Another quantity of interest is the average effect of the treatment on the treated (ATT), defined as Δ(ATT)=E[y 1|T=1]−E[y 0|T=1]. We can again calculate the interim value
 $${\rm \Delta }_{i}^{{(ATT)}} \,{\equals}\,{{{\rm \Phi }^{{(2)}} \left( {\left( {\matrix{ {x_{i} \rgamma _{1} {\plus}z_{i} \pi } \hfill \cr {x_{i} \bgamma _{2} {\plus}\beta } \hfill \cr } } \right),{\bf \Omega }} \right)\,{\minus}\,{\rm \Phi }^{{(2)}} \left( {\left( {\matrix{ {x_{i} \bgamma _{1} {\plus}z_{i} \pi } \hfill \cr {x_{i} \bgamma _{2} } \hfill \cr } } \right),{\bf \Omega }} \right)} \over {{\rm \Phi }({\bf{x}} _{i}{{\rm \!'}} \rgamma _{1} {\plus}z_{i} \pi )}},$$
evaluated for the observed values of x
i
and z
i
. The ATT is then
 $\mathop{\sum}\nolimits_{i{\equals}1}^n {{\rm \Delta }_{i}^{{(ATT)}} \!/\!n} $
.Footnote
3
SIMULATION STUDY
In this section, we compare the performance of the Bayesian and ML bivariate probit models using simulated data. Specifically, we compare the results from the Stan model shown in the Online Appendix with the biprobit command in StataSE version 14.2.Footnote 4
For this study, x is a matrix of an intercept and one independent variable. Both the independent variable in x and the instrument are drawn from standard normal distributions. Using this data, we generate the treatment and outcome exactly as assumed in Equation 2.
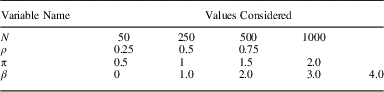
We fix the γ parameters such that γ 1=(1.5, −1) and γ 2=(−2, 2.5). However, we vary the correlation between the first and second stage (ρ), the number of observations (N), the instrument strength (π), and the treatment coefficient (β). Table 1 displays the parameter values considered. For each of the 240 parameter combinations, we simulate 500 independent data sets.
Parameter Values for Data Simulation

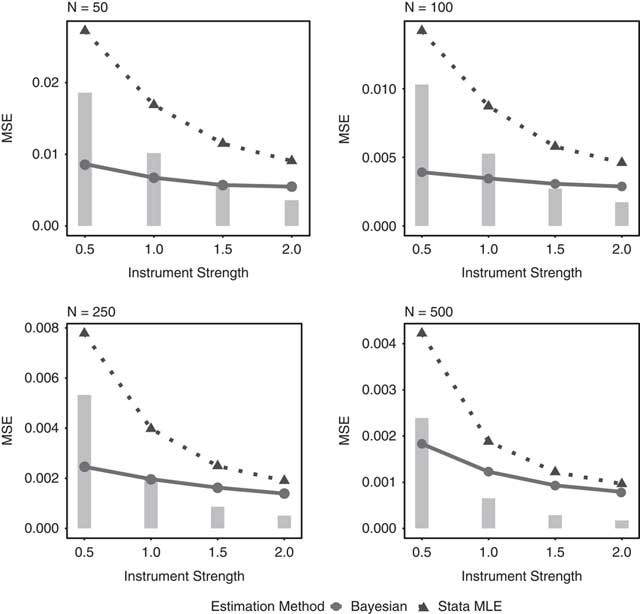
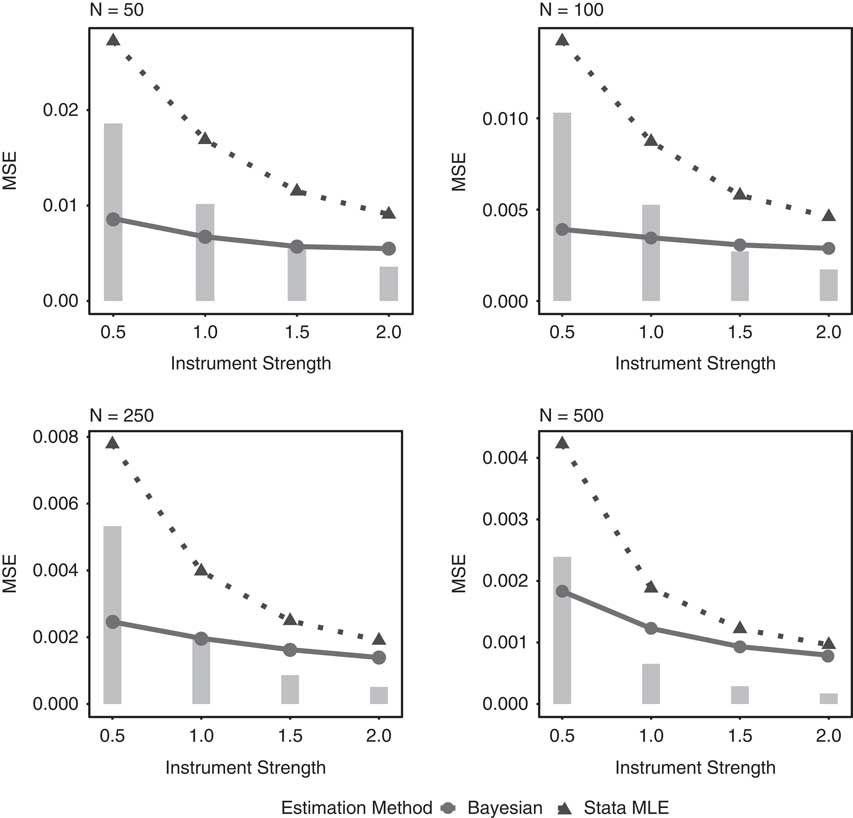
To compare the methods, we calculate the mean squared error (MSE). Each frame of Figure 1 displays the MSE on the ATE for the ML and Bayesian methods partitioned by sample size.Footnote 5 The gray vertical bars are the difference between the MSE for each approach. The figure reveals two important patterns. First, the MSE of the Bayesian estimator is always smaller than that of the ML estimator, even with modestly large sample sizes and strong instruments. Second, both estimators perform better with stronger instruments (from left to right along the x-axis) and larger sample sizes (plots going from the top left to bottom right). However, when the instrument is weak, or sample sizes are smaller, the relative advantage of the Bayesian estimator is greater.Footnote 6
This figure compares the mean squared error (MSE) on the average treatment effect for the Bayesian and maximum likelihood (ML) estimates on the simulated data sets. Gray vertical rectangles show the difference between the two MSEs at each parameter value. The Bayesian estimator outperforms the ML estimate in terms of the MSE across all parameter settings, and this pattern is particularly clear with small samples and weak instruments.
THE EFFECT OF EDUCATION ON VOTER TURNOUT
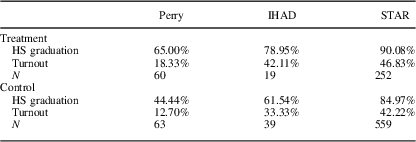
In this section, we compare the Bayesian and ML bivariate probit models to estimate the causal effect of education on turnout. To address this question, Sondheimer and Green (Reference Sondheimer and Green2010) (henceforward SG) leverage three randomized experiments aimed at stimulating educational attainment (e.g., Hanushek Reference Hanushek1999; Kahne and Bailey Reference Kahne and Bailey1999; Barnett Reference Barnett2010; Heckman et al. Reference Heckman, Moon, Pinto, Savelyev and Yavitz2010): the High/Scope Perry Preschool Experiment (Perry), the I Have A Dream program (IHAD), and the Student–Teacher Achievement Ratio (STAR) experiment. The basic approach is to consider these experiments as encouragement studies, where educational attainment is the causal variable of interest and the experimental assignments are instruments. SG then match data from participants to turnout in federal elections between 2000 and 2004, where the outcome variable is an indicator for voting in any election in this period. The goal is to estimate the effect of educational attainment on political participation, which may be confounded by socioeconomic status (Berinsky and Lenz Reference Berinsky and Lenz2011).
There are two features of this data, which is displayed in Table 2, that are relevant for our purposes. First, the sample sizes are small for the Perry (N=123) and IHAD (N=58) experiments. Second, high-school graduation rates in the STAR experiment were very high in absolute terms across treatment conditions (90.08 percent in the treatment group and 84.97 percent in the control group), which implies a relatively weak instrument.
Description of Educational Experiment Data from Sondheimer and Green (Reference Sondheimer and Green2010)

Note: Perry=High/Scope Perry Preschool Experiment; IHAD=I Have A Dream program; STAR=Student–Teacher Achievement Ratio; HS=high school.
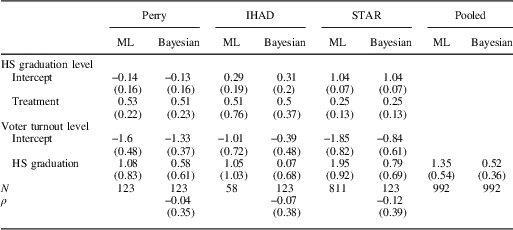
The ML bivariate probit results from SG are shown in the columns labeled ML in Table 3. The columns labeled “Bayesian” show these estimates using the Bayesian approach. Note that the coefficients estimated in the Bayesian models differ considerably from the ML estimates in the second stage. While the effects of education on turnout are all positive, they suggest more modest effect sizes and are more likely to include 0 in the 95 percent credible interval than originally reported.
Bivariate Probit Regression and Bayesian Instrumental Variable Results for the Downstream Effects of Educational Attainment on Turnout

Note: Maximum likelihood (ML) columns replicate table 5 in Sondheimer and Green (Reference Sondheimer and Green2010). Coefficients are ML estimates and Bayesian posterior means.
In parentheses, we report bootstrapped standard errors for ML estimates and posterior standard deviations for Bayesian estimates. Pooled estimates are calculated by creating precision weighted coefficients.
Perry=High/Scope Perry Preschool Experiment; IHAD=I Have A Dream program; STAR=Student–Teacher Achievement Ratio; HS=high school.
The differences between the ML and Bayesian models persist when we pool across studies. SG construct a precision weighted estimate of the coefficient measuring the effect of education on turnout on the probit scale.Footnote 7 This is shown in the right column of Table 3 and suggests that there is strong evidence in favor of the effect of high-school graduation on turnout. The Bayesian models, however, only weakly support this conclusion. Figure 2 displays the posterior estimates for the ATEs (left panel) and ATTs (right panel) for each study, as well as the pooled posterior density.Footnote 8 The posterior mean pooled ATE is 0.22, which suggests that the causal effect of high-school graduation on voting in a federal election is a 22 percent increase. However, there is significant uncertainty. The posterior probability that the pooled ATE is less than 0, Pr(Δ(ATE)≤0), is ~0.14. The right panel shows similar estimates for the effect of the treatment on the treated.
Bayesian treatment effect estimates for the effect of education on voter turnout Note: These posterior densities of the treatment effects for each data set were obtained by calculating the average treatment effect (ATE) and average effect of the treatment on the treated (ATT) at each iteration of the MCMC algorithm. Based on the pooled posterior density for each, p(ATE≤0)=0.14 and p(ATT≤0)=0.15.The pooled estimates are an average of the estimated ATE and ATT at each MCMC draw weighted by sample size. Perry=High/Scope Perry Preschool Experiment; IHAD=I Have A Dream program; STAR=Student–Teacher Achievement Ratio; MCMC=Markov chain Monte Carlo.

CONCLUSION
In this note, we argue that a Bayesian approach to estimating bivariate probit IVs is superior to standard ML routines. Broadly speaking, Bayesian and ML approaches to inference provide virtually identical parameter estimates. However, in the case of bivariate probit IV models, this appears not to be the case. First, numerical issues with the likelihood surface appear to prevent standard routines from locating the true ML estimator (Freedman and Sekhon Reference Freedman and Sekhon2010). The Bayesian model, however, is better able to recover the true model parameters in many settings. Specifically, our simulation study showed that in settings more similar to actual applied research in the social sciences—where sample sizes are often modest and instruments are often quite weak—the Bayesian approach is more likely to provide accurate inferences.
Second, in an IV setting, the specific parameter values from the bivariate probit model are not of direct interest, making interpretation difficult. The Bayesian approach makes it simple to calculate key causal quantities of interest along with appropriate measures of uncertainty. We illustrate the advantage of this flexibility by re-estimating the effect of educational attainment on voter turnout (Sondheimer and Green Reference Sondheimer and Green2010).
In all, the analyses above illustrate how the Bayesian approach can provide more reliable and accurate estimates of treatment effects, and is more flexible for calculating treatment effects in the presence of binary outcomes than traditional ML approaches. Before concluding, however, it is worth noting one important limitation. Specifically, analysts should realize that any bivariate probit model requires more restrictive assumptions for estimating causal quantities than alternative approaches such as 2SLS. By assuming the joint normality of the error distribution, bivariate probit models are less agnostic than 2SLS, which assumes only monotonicity.
With that said, one of the advantages of adopting the Bayesian framework is that it is possible to extend the model in a variety of ways, leveraging the extensive array of tools available in the Bayesian literature, to address these concerns. Chib and Greenberg (Reference Chib, Greenberg and Jeliazkov2007) provide a variant of the model with fewer assumptions, and Chib, Greenberg and Jeliazkov (Reference Chib2009) extend this further to allow for non-random sample selection. Although far more flexible, however, these models also make assumptions about the joint distribution of the treatment and the outcome that may not always be appropriate. Additional work is required to extend this modeling framework to accommodate flexible joint distributions.
Nonetheless, bivariate probit models are still routinely estimated in the social sciences, and the Bayesian implementation described here offers significant practical advantages over the standard ML techniques now dominant in the literature. With large samples and strong instruments, all approaches will provide nearly identical answers. Yet, researchers are seldom blessed with this kind of data. Under more realistic circumstances with finite samples and weak instruments, the Bayesian implementation we describe promises to aid researchers in making more accurate, efficient, and interpretable estimates of treatment effects.