





1. Introduction
Internal gravity waves (IGWs) are ubiquitous features of the ocean but are filtered out by the quasi-geostrophic description of the system. Although generally they account for only a small fraction of the kinetic energy of the overall ocean, their existence has profound physical significance: they play an important role in transferring momentum, heat and tracers across the ocean, and their breaking drives most of the turbulence that leads to the inhomogeneity of ocean mixing, which in turn affects the large-scale circulation.
In the IGW continuum, energy is supplied at large scales by atmospheric and tidal forcings and is dissipated at small scales. Understanding the energy transfer across scales driven by nonlinear processes is one topic of central importance in physical oceanography. Such understanding will not only shed light on the physical interpretation of IGW spectral forms, generally considered as the Garrett–Munk spectrum and its variations (Garrett & Munk Reference Garrett and Munk1972, Reference Garrett and Munk1975; Cairns & Williams Reference Cairns and Williams1976), but also provide an estimate of the energy flux towards small dissipation scales (downscale energy flux) that is available for ocean mixing. The latter aspect, as one focus of our current work, is particularly important given the fact that information at small dissipation scales is difficult to obtain from both measurements and modelling.
While the downscale energy cascade of the IGW continuum can be excited by many mechanisms, such as wave–eddy interactions (e.g. Watson Reference Watson1985) and bottom scattering (e.g. Kunze & Llewellyn Smith Reference Kunze and Llewellyn Smith2004), in many cases, nonlinear wave interactions are considered as a major contributor to the cascade in abyssal oceans (e.g. Müller et al. Reference Müller, Holloway, Henyey and Pomphrey1986; Polzin & Lvov Reference Polzin and Lvov2011). In quantification of spectral energy transfer due to nonlinear wave interactions, one critical tool is the wave kinetic equation (WKE) derived in the framework of wave turbulence theory (Zakharov, Lvov & Falkovich Reference Zakharov, Lvov and Falkovich1992; Nazarenko Reference Nazarenko2011). For systems with three-wave resonant interactions, the general form of the WKE reads
 \begin{align} \frac{\partial n}{\partial t} &= \iint 4{\rm \pi}\,|V(\boldsymbol{p},\boldsymbol{p}_1,\boldsymbol{p}_2)|^2\,f_{p12}\, \delta(\omega-\omega_1-\omega_2)\,\delta(\boldsymbol{p}-\boldsymbol{p}_1-\boldsymbol{p}_2) \,\textrm{d}\boldsymbol{p}_1 \,\textrm{d}\boldsymbol{p}_2 \nonumber\\ &\quad -\iint 8{\rm \pi}\,|V(\boldsymbol{p}_1,\boldsymbol{p},\boldsymbol{p}_2)|^2\,f_{1p2}\, \delta(\omega-\omega_1+\omega_2)\,\delta(\boldsymbol{p}-\boldsymbol{p}_1+ \boldsymbol{p}_2) \,\textrm{d}\boldsymbol{p}_1 \,\textrm{d}\boldsymbol{p}_2, \end{align}
where  $n(\boldsymbol {p},t)$ is the spectral action density (with
 $\boldsymbol {p}$ being the vector of the wavenumber and
 $t$ the time),
 $V$ is the interaction coefficient,
 $\omega$ is the wave frequency,
 $f_{p12}= n_1n_2 -n_p(n_1+n_2)$ and
 $f_{1p2}= n_pn_2 -n_1(n_p+n_2)$. The right-hand side of (1.1) is also referred to as the collision integral, which describes wave action evolution due to triad interactions. Other mechanisms, such as generation/dissipation of IGWs and coupling with eddies/currents, are not included. The existence of eddies and currents potentially may be important in nonlinear energy transfer (e.g. Kafiabad, Savva & Vanneste Reference Kafiabad, Savva and Vanneste2019; Dong, Bühler & Smith Reference Dong, Bühler and Smith2020, Reference Dong, Bühler and Smith2023; Savva, Kafiabad & Vanneste Reference Savva, Kafiabad and Vanneste2021) but will not be the focus of the current work. For IGWs,
 $\boldsymbol {p}=(k_x,k_y,m)$,
 $\omega ^2=(N^2 k^2+f^2 m^2)/(k^2+m^2)$ is the dispersion relation, with
 $k=(k^2_x+k^2_y)^{1/2}$ being the magnitude of horizontal wavenumbers,
 $N$ the buoyancy frequency, and
 $f$ the Coriolis frequency. The interaction coefficient
 $V$ has been derived using various approaches in the literature (e.g. Olbers Reference Olbers1974, Reference Olbers1976; Müller & Olbers Reference Müller and Olbers1975; McComas & Bretherton Reference McComas and Bretherton1977; Lvov & Tabak Reference Lvov and Tabak2001, Reference Lvov and Tabak2004; Lvov et al. Reference Lvov, Polzin, Tabak and Yokoyama2010), which yield formulations shown to be equivalent on the resonant manifold (Lvov, Polzin & Yokoyama Reference Lvov, Polzin and Yokoyama2012).
The collision integral has non-zero values on the resonant manifold:
 \begin{equation} \boldsymbol{p}=\boldsymbol{p}_1 \pm \boldsymbol{p}_2 \quad\textrm{and}\quad \omega=\omega_1\pm\omega_2. \end{equation}
Therefore, (1.1) provides the energy transfer rate through collections of triad interactions in the spectral space. Such a WKE characterizes the spectral evolution in the kinetic (or nonlinear) time scale  $\tau _{\boldsymbol {p}}^{NL}$, and is valid only for weakly nonlinear waves whose linear time scale
 $\tau _{\boldsymbol {p}}^{L}$ (
 $=2{\rm \pi} /\omega _{\boldsymbol {p}}$, i.e. the wave period) is (much) smaller than
 $\tau _{\boldsymbol {p}}^{NL}$, that is, the normalized Boltzmann rate (Nazarenko Reference Nazarenko2011; Lvov et al. Reference Lvov, Polzin and Yokoyama2012)
 \begin{equation} |\varepsilon_{\boldsymbol{p}}|=\frac{\tau_{\boldsymbol{p}}^L}{\tau_{\boldsymbol{p}}^{NL}}= \left|\frac{2{\rm \pi} (\partial n_{\boldsymbol{p}}/\partial t)}{\omega_{\boldsymbol{p}} n_{\boldsymbol{p}}} \right| \ll 1. \end{equation}
The evaluation of the IGW energy cascade for Garrett–Munk spectra based on (1.1) was first undertaken by McComas et al. in a series of papers (McComas & Bretherton Reference McComas and Bretherton1977; McComas & Müller Reference McComas and Müller1981a,Reference McComas and Müllerb). A major argument made in these works is that the collision integral in (1.1) is dominated by three types of non-local (i.e. scale-separated in either vertical wavenumber or frequency, or both) interactions, namely parametric subharmonic instability (PSI), elastic scattering (ES) and induced diffusion (ID) (see schematic illustrations in figure 1). McComas & Müller (Reference McComas and Müller1981a) argued further that the Garrett–Munk spectrum is in equilibrium with respect to ES so that the downscale energy flux can be calculated from PSI and ID contributions. This simplification allowed an analytical formulation of the downscale energy flux, which laid the foundation of finescale parameterization that estimates the turbulent dissipation rate due to internal wave breaking. The Gregg–Henyey–Polzin finescale parameterization yields (Henyey, Wright & Flatté Reference Henyey, Wright and Flatté1986; Gregg Reference Gregg1989; Polzin, Toole & Schmitt Reference Polzin, Toole and Schmitt1995; Polzin et al. Reference Polzin, Naveira Garabato, Huussen, Sloyan and Waterman2014)
 \begin{equation} P_{finescale} = C_0\,\frac{f\kern0.06em N^2\cosh^{{-}1}(N/f)}{f_0N_0^2\cosh^{{-}1}(N_0/f_0)}\,\hat{E}^2\, \frac{3(R_{\omega}+1)}{4R_{\omega}} \sqrt{\frac{2}{R_{\omega}-1}}, \end{equation}
where  $f_0=7.8361\times 10^{-5}$ s
 $^{-1}$ is the GM76-referenced Coriolis frequency corresponding to 32.5
 $^{\circ }$ latitude,
 $N_0=3\,\textrm{cph} = 5.2360\times 10^{-3}$ s
 $^{-1}$ is the GM76-referenced buoyancy frequency,
 $\hat {E}=0.1\,\text {cpm}/m_c$ is the non-dimensional gradient spectral level with the critical vertical wavenumber
 $m_c$ evaluated through the integrated shear spectrum
 $\int _0^{m_c} 2m^2\,E_k(m)\,\textrm{d} m=2{\rm \pi} N^2/10$, and
 $R_{\omega }$ is the shear-to-strain ratio. Here,
 $C_0=8\times 10^{-10}$ W kg
 $^{-1}$ is a prefactor obtained by fitting microstructure measurements in the ocean. For GM76,
 $\hat {E}=1$ and
 $R_{\omega }=3$. While McComas & Müller (Reference McComas and Müller1981a) provide the correct functional form of (1.4), their calculated value
 $C=1.8 \times 10^{-9}$ W kg
 $^{-1}$ has a factor of 2.25 difference from
 $C_0$.
The wavenumber vectors and action balance for the three types of scale-separated interactions with  $\boldsymbol {p}_0=\boldsymbol {p}_1+\boldsymbol {p}_2$, where the action transfer direction is based on Garrett–Munk spectra: (a) PSI, (b) ES, (c) ID. For PSI and ES,
 $+1$ denotes one unit of action received by the wave mode as a sink (red dot), and
 $-1$ denotes one unit of action sent by a mode as a source (green dot). Induced diffusion can reverse direction with sinks and sources (grey dots), which is determined by the spectral slopes to be discussed in § 3.2. For all three mechanisms, the action transfer regarding the highest-frequency wave
 $\boldsymbol {p}_0$ is always opposite to those regarding
 $\boldsymbol {p}_1$ and
 $\boldsymbol {p}_2$, with energy conservation guaranteed by
 $\omega _0(\partial n_0/\partial t)=\omega _1(\partial n_1/\partial t) + \omega _2(\partial n_2/\partial t)$.

While the calculation by McComas et al. provides an estimate of energy flux in the same order of finescale parameterization, the interaction mechanisms involved in the calculation suffer from physical inconsistencies that have never been resolved completely. As summarized in Polzin & Lvov (Reference Polzin and Lvov2011), at least two confusing paradoxes exist:
(a) In frequency space, both dominant mechanisms of PSI and ID are believed to transfer energy toward low frequencies (i.e. backward cascade). This is not realistic for a balanced IGW continuum unless there is an energy injection at high frequency into the ocean, which is not known. Thus there must exist a ‘missing’ mechanism that moves energy to high frequencies to form a forward cascade.
(b) The GM76 wave action spectrum is independent of vertical wavenumber
 $m$ in the range of high $m$, which leads to a zero-flux state for ID (since diffusion requires gradient in $m$ at least at the leading order). This makes obscure the calculation by McComas et al., where an artificial correction in ID has to be applied to enable cascade in the high-$m$, high-$\omega$ range of the spectra, and raises questions on what the actual mechanism is for such a cascade in this range.


The paradoxes (a) and (b) have been addressed partly by Dematteis & Lvov (Reference Dematteis and Lvov2021) and Dematteis, Polzin & Lvov (Reference Dematteis, Polzin and Lvov2022), mainly for a modified GM76 spectrum that serves as a stationary solution to (1.1) (action spectrum  $n(k,m)\sim k^{-3.69}m^0$ instead of the standard GM76
 $n(k,m)\sim k^{-4}m^0$). In these works, it was necessary to consider the non-rotating condition
 $f=0$ such that (1.1) becomes scale-invariant and yields a power-law solution. For this modified power-law spectrum, it was identified that ID provides a non-zero and frequency-forward flux by considering the complete diffusion tensor (i.e. including the off-diagonal elements), and that local interactions (which had been ignored by McComas et al.) play a major role in the downscale energy cascade. By applying a combined analytical and numerical approach, the authors explicitly calculated the downscale energy flux, which is within a factor of 2 compared to the prediction by finescale parameterization (1.4).
In spite of the significant progress achieved in Dematteis & Lvov (Reference Dematteis and Lvov2021) and Dematteis et al. (Reference Dematteis, Polzin and Lvov2022), the paradoxes (a) and (b), along with a convincing evaluation of downscale energy flux in quantitative consistency with (1.4) in the WKE framework, have never been addressed for the original problem of the GM76 spectrum. This is an important task considering that the GM76 spectrum, although not a stationary state of (1.1) as understood now, is still largely considered a standard model for realistic IGW spectra among most physical oceanographers. We undertake this task leveraging the fast rise of computational power that has enabled a direct numerical evaluation of the complete spectral energy transfer based on (1.1). Since our approach is purely numerical and we do not seek a scale-invariant field, we are able to incorporate naturally a finite value of  $f$ that was not treated in Dematteis & Lvov (Reference Dematteis and Lvov2021) and Dematteis et al. (Reference Dematteis, Polzin and Lvov2022). Our results show that the energy flux across the critical vertical scale of 10 m (generally considered as the scale where dissipation starts to take over linear wave dynamics) is approximately
 $1.5 \times 10^{-9}$ W kg
 $^{-1}$, with a factor of 1.5 greater than the finescale formula (1.4). We further decompose the cascade into different mechanisms, and show that the downscale flux is provided mainly by PSI and local interactions, with ID contributing almost zero flux. This is in sharp contrast to the calculation by McComas et al. (flux based on PSI plus ID), and addresses the paradox (b). In addition, we find that there exists a clear frequency-forward cascade, supplied mainly by local interactions and ES, which addresses paradox (a). The role of ES, which was hypothesized previously to have no effect on energy cascade in GM76, is now revealed because of the adoption of finite Coriolis frequency
 $f$.
2. Numerical method
For numerical evaluation of spectral energy transfer, we use the WKE derived in Lvov & Tabak (Reference Lvov and Tabak2001, Reference Lvov and Tabak2004) with detailed formulation of the interaction coefficient  $V$ provided in Lvov et al. (Reference Lvov, Polzin, Tabak and Yokoyama2010, Reference Lvov, Polzin and Yokoyama2012) and Pan et al. (Reference Pan, Arbic, Nelson, Menemenlis, Peltier, Xu and Li2020). This WKE is derived from a Hamiltonian formulation of the dynamical equation of IGWs, in which the isopycnal vertical coordinate has to be used. The isopycnal vertical wavenumber
 $m_i$ is converted from its Eulerian counterpart by
 $m_i=(g/\rho N^2)\,m$. Hereafter, we use notation
 $m$ throughout the paper for convenience, which represents isopycnal
 $m_i$ in the formulation of the WKE (e.g. (2.1) and the appendices), and Eulerian
 $m$ in presenting the results in § 3.
The WKE, in the form of (1.1), involves a collision integral over six dimensions in  $\boldsymbol {p}_1$ and
 $\boldsymbol {p}_2$. One can reduce the dimension of integration by integrating only on the resonant manifold defined by the delta functions. Since the GM76 spectrum is horizontally isotropic, it is convenient to first integrate out the horizontal angle dependence, then reduce the integration by applying the delta functions. With detailed formulation provided in Appendix A, this procedure leads to an integration over only two dimensions, namely magnitudes of the horizontal wavenumbers
 $k_1$ and
 $k_2$:
 \begin{equation} \frac{\partial n(k,m)}{\partial t} = \int_0^{+\infty} \int_0^{+\infty} \left[\frac{h^+(m^{*+}_1)}{|{g^+}'(m^{*+}_1)|}-2\,\frac{h^-(m^{*-}_1)}{|{g^-}'(m^{*-}_1)|}\right] \textrm{d} k_1\,\textrm{d} k_2, \end{equation}
where functions  $h^+$,
 $h^-$,
 ${g^+}'$,
 ${g^-}'$ (which additionally depend on
 $k,m,k_1,k_2$) and the roots
 $m^{*+}$ and
 $m^{*-}$ are defined in Appendix A,
 $k=\sqrt {k_x^2+k_y^2}\in \mathbb {R}^+$, and
 $m\in \mathbb {R}$ (taking both positive and negative values). The numerical integration of (2.1) is rather straightforward, but care has to be taken in terms of the root finding for
 $m^{*+}$ and
 $m^{*-}$, with details discussed in Appendix B. Our numerical code, implemented in FORTRAN with message passing interface for parallel computation, is made available on GitHub at https://github.com/yue-cynthia-wu.
Our numerical approach, in principle, shares some level of similarity to ‘Method 3’ in Eden, Pollmann & Olbers (Reference Eden, Pollmann and Olbers2019b) regarding the evaluation of the collision integral (2.1) on the resonant manifold, but the latter is implemented for a different version of the WKE. Additionally, our procedure (of using cylindrical coordinates and integrating out the horizontal angle dependence) does enforce horizontal isotropy of the IGW spectrum. This feature is beneficial for our planned subsequent work (beyond this paper) to integrate the WKE in time while exactly maintaining the horizontal isotropy as was done in Olbers, Pollmann & Eden (Reference Olbers, Pollmann and Eden2020). In addition, Eden et al. (Reference Eden, Pollmann and Olbers2019b) employed other methods using broadened delta functions to compute the collision integral, but the results are more noisy and do not show clear advantage. Indeed, as understood recently in both pure mathematical derivation (e.g. Deng & Hani Reference Deng and Hani2023) and numerical studies (e.g. Hrabski & Pan Reference Hrabski and Pan2020, Reference Hrabski and Pan2022), the WKE should be considered as a result of maintaining sufficient quasi-resonances from the dynamical equation, so using broadening in the delta function is somewhat redundant. Such broadened delta functions, on the other hand, might be physically meaningful if finite size effect is important, as in situations described in Pan & Yue (Reference Pan and Yue2017).
Despite the observed variability in the spectral forms of the realistic IGW fields in different seasons and at different geographical locations, we start with the GM76 model, which is one of many realistic possible spectra
 \begin{equation} E(\omega,m)=E_0\,A(m/m^*)\,B(\omega), \end{equation}
where  $m^*=10^{-2}$ m
 $^{-1}$ is a reference vertical wavenumber, and the functions
 \begin{equation} \left.\begin{gathered} A(m/m^*)\sim m^{*-1}[1+(m/m^*)^2]^{{-}1},\\ B(\omega)\sim \omega^{{-}1}(\omega^2-f^2)^{{-}1/2}, \end{gathered}\right\} \end{equation}
are normalized to be integrated to unity (i.e.  $\int _0^\infty A(m/m^*)\,\textrm {d}(m/m^*)=1$ and
 $\int _f^N B(\omega )\,\textrm {d}\omega =1$, with
 $f=10^{-4}$ s
 $^{-1}$ and
 $N=5\times 10^{-3}$ s
 $^{-1}$) so that the total (integrated) energy level of GM76 equals
 $E_0=3\times 10^{-3}$ m
 $^2$ s
 $^{-2}$. The action density spectra, which are needed in evaluating (2.1), can be calculated by
 $n(k,m)=E(k,m)/\omega =E(\omega,m)$
 $(\partial \omega /\partial k)/(2{\rm \pi} \omega k)$ considering horizontal isotropy. In the high-
 $\omega$, high-
 $m$ regime of the spectrum, we have
 $E(\omega,m) \sim \omega ^{-2} m^{-2}$ and
 $n(k,m) \sim k^{-4} m^{0}$ (see figure 2).
The GM76 model of the (a) energy density spectra, and (b) action density spectra, with  $E(\omega,m) \sim \omega ^{-2} m^{-2}$ and
 $n(k,m) \sim k^{-4} m^{0}$ in the high-frequency, high-wavenumber regime. Curves in each plot represent the spectrum with one variable taking fixed values. Red vertical lines denote the GM76-referenced vertical wavenumber
 $m^*=10^{-2}$ m
 $^{-1}$.

In order to set our computation for a physical problem that reflects the size of the real ocean, we consider a domain with horizontal circular radius 42.4 km and vertical extent 2.1 km. To evaluate (2.1), we use  $1080\times 1080$ grids of uniform spacing in both
 $k$ and
 $m$, with the smallest resolved scales 40 m and 2 m in the two directions, i.e.
 $k \in [1.5\times 10^{-4}, 1.6\times 10^{-1}]$ m
 $^{-1}$ and
 $m \in [3.0\times 10^{-3}, 3.2]$ m
 $^{-1}$. We use the non-hydrostatic dispersion relation
 $\omega ^2=(N^2k^2+f^2m^2)/(k^2+m^2)$, which bounds the IGW frequency between
 $f$ and
 $N$, while the hydrostatic version leads to (non-physical) super-buoyancy IGWs in a large spectral area of the selected
 $(k,m)$ domain where
 $k/m$ is large. (Since the interaction coefficients in the WKE used in this paper are derived under hydrostatic approximation, the results at regions of large
 $k/m$ should be considered as an approximation. Olbers (Reference Olbers1974, Reference Olbers1976) and Müller & Olbers (Reference Müller and Olbers1975) provided a non-hydrostatic version of the WKE for IGWs.) With the above setting, our numerical calculations are performed on the Great Lakes clusters at University of Michigan with two nodes of 72 CPUs, and the simulation takes 6–8 hours to calculate all
 $O(10^{12})$ triad interactions.
3. Results
3.1. Energy transfer in spectral space
The energy transfer in spectral space  $\partial E(k,m)/\partial t$ is calculated by multiplying
 $\partial n(k,m)/\partial t$ with
 $\omega$, where
 $\partial n(k,m)/\partial t$ is obtained by numerically evaluating the WKE (2.1). In figure 3, we plot
 $(2{\rm \pi} k)(mk)\,\partial E(k,m)/\partial t$, with the factor
 $2{\rm \pi} k$ accounting for horizontal azimuth integration, and
 $mk$ accounting for the plot in the log-log axis. More precisely, with these prefactors, the total
 $\partial E/\partial t$ can be computed conveniently by integrating the values over the area in figure 3, i.e.
 $\partial E/\partial t = \iint (2{\rm \pi} k)(mk)\,(\partial E(k,m)/\partial t) \,\textrm {d}[\log (m)]\,\textrm {d}[\log (k)]$. (We will show later, in figure 5, that our simulation conserves the total energy so that
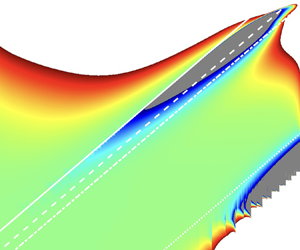
 $\partial E/\partial t=0$.) This plotting technique is also used in Eden, Chouksey & Olbers (Reference Eden, Chouksey and Olbers2019a) and Eden et al. (Reference Eden, Pollmann and Olbers2019b), which facilitates an unbiased visualization of energy transfer. Figure 3(a) shows the source regions (with
 $\partial E(k,m)/\partial t<0$, providing energy), and figure 3(a) shows the sink (with
 $\partial E(k,m)/\partial t>0$, receiving energy) regions. Here, the terminologies ‘sink’ and ‘source’ are inherited from Eden et al. (Reference Eden, Pollmann and Olbers2019b) and are used to indicate the direction of energy cascade. If a stationary spectrum is assumed, then they can be related physically to the generation and dissipation mechanism that has to balance the spectral energy transfer. We see that energy is transferred from waves in the frequency band
 $[2f,4f]$ to both lower and higher frequencies. The component of forward frequency cascade is also seen in the results of Eden et al. (Reference Eden, Pollmann and Olbers2019b). We will further investigate the mechanisms leading to this cascade in § 3.2, addressing paradox (a) in the theory of McComas et al.
Energy transfer  $\log [(2{\rm \pi} k)(mk)\,\partial E/\partial t]$ for GM76 with (a) sinks (
 $\partial E/\partial t>0$), and (b) sources (
 $\partial E/\partial t<0$). We plot only the range with positive
 $m$ since the spectrum at negative
 $m$ is completely symmetric. The white solid, dashed, dash-dotted and dotted lines along the diagonal denote frequencies
 $2f$,
 $3f$,
 $4f$ and
 $35f$ (
 $=0.7N$), respectively.

It is important to verify that the WKE under the above setting stays in the weakly nonlinear regime and provides a valid approximation of the dynamics. In particular, one may be concerned about the rapid modal evolution in the high-wavenumber, high-frequency regime, as first pointed out in Holloway (Reference Holloway1978), which may violate condition (1.3) regarding the normalized Boltzmann rate  $\varepsilon _{\boldsymbol {p}}$. For this purpose, we check the values of
 $\varepsilon _{\boldsymbol {p}}$ in the selected scale limits. As shown in figure 4, there indeed exist large spectral regions where
 $m>0.1$ m
 $^{-1}$ and/or
 $\omega >0.9N$ with
 $|\varepsilon _{\boldsymbol {p}}| \sim O(1)$, indicating the failure of the WKE in the regime of high wavenumbers and/or high frequencies. These regions with
 $|\varepsilon _{\boldsymbol {p}}|$ not much less than 1 will be treated with caution in the subsequent discussion of energy fluxes.
Normalized Boltzmann rate  $\varepsilon _{\boldsymbol {p}}=2{\rm \pi} (\partial n_{\boldsymbol {p}}/\partial t)/(\omega _{\boldsymbol {p}} n_{\boldsymbol {p}})$ for GM76 in the
 $(k,m)$ domain. The white solid, dashed, dash-dotted and dotted lines along the diagonal denote frequencies
 $2f$,
 $3f$,
 $4f$ and
 $45f$ (
 $=0.9N$), respectively. Regions where
 $m>0.1$ m
 $^{-1}$ and/or
 $\omega >0.9N$ indicate violation of the weak nonlinearity assumption in wave turbulent theory, including regions of
 $\varepsilon _{\boldsymbol {p}}>1$ (white) and
 $\varepsilon _{\boldsymbol {p}}<-1$ (grey) with obvious violation.

We further define the energy fluxes across  $k_0$,
 $m_0$ and
 $\omega _0$, respectively, based on energy conservation in the finite domain:
 \begin{gather} \mathcal{P}^k(k_0)={-}\int_0^{m_{max}} \int_0^{k_0} 4{\rm \pi} k\,\frac{\partial E(k,m)}{\partial t}\,\textrm{d} k \,\textrm{d} m, \end{gather}
 \begin{gather}\mathcal{P}^m(m_0)={-}\int_0^{m_0} \int_0^{k_{max}} 4{\rm \pi} k\,\frac{\partial E(k,m)}{\partial t}\,\textrm{d} k \,\textrm{d} m, \end{gather}
 \begin{gather}\mathcal{P}^\omega(\omega_0)={-}\int_{0}^{m_{max}} \int_0^{k_{max}} 4{\rm \pi} k\,\frac{\partial E(k,m)}{\partial t}\,\mathbb{1}_{\omega\le\omega_0}\,\textrm{d} k \,\textrm{d} m, \end{gather}
where  $k_{max}=0.016$ m
 $^{-1}$,
 $m_{max}=0.32$ m
 $^{-1}$, and
 $\mathbb{1}$ is an indicator function. Equations (3.1)–(3.3) are energy fluxes only due to nonlinear wave–triad interactions within the selected scale limits, which do not include fluxes entering the IGW field from the large-scale end by generation nor draining from the small-scale end by dissipation. The evaluations here are based on the conservation of total energy
 $\partial E/\partial t$ by the WKE. In the prefactors
 $4{\rm \pi} k$,
 $2{\rm \pi} k$ comes from the integration over horizontal azimuth, and
 $2$ accounts for the vertical symmetry over
 ${\pm }m$. The energy fluxes in all three directions are plotted in figure 5 (black curves). We see that
 $\mathcal {P}^\alpha (\alpha _{max}) \approx 0$ with
 $\alpha =k$,
 $m$ and
 $\omega$, indicating energy conservation. We remark here that energy conservation is achieved only approximately by our numerical algorithm since the roots
 $m^{*+}$ and
 $m^{*-}$ in (2.1) found by the root-finding algorithm (Appendix B) do not lie exactly on the discrete
 $m$-grid points, which breaks the symmetry when looping over three wavenumber vectors in a triad. This affects mainly the high-frequency regime of the spectrum (figure 3 with strong sink and source where
 $\omega >0.7N$). (The region where
 $\omega \sim N$ is problematic for two reasons: (1) if
 $m$ is not much greater than
 $k$, then the hydrostatic approximation in the WKE breaks down, making the evaluation of
 $\partial n/\partial t$ (and
 $\partial E/\partial t$) untrustworthy; (2) if
 $m \in \mathbb {R}^+$ is small, then the root finding for the reduction interactions (
 $m^*_{1,{right}} \in (0,m)$) deviates from its true value due to limited resolution between 0 and
 $m$; see Appendix B and figure 8.) Since the hydrostatic approximation is also violated in this regime, we discard the contribution of triads with frequencies greater than the cutoff frequency
 $\omega _{cutoff}=0.7N$ in the calculation of energy fluxes.
Energy fluxes due to nonlinear wave–wave interactions within the selected scale limits across (a) horizontal wavenumber, (b) vertical wavenumber, and (c) frequency for GM76. In (b), dashed and dash-dotted lines denote  $m_{cutoff}=0.2$ m
 $^{-1}$ (corresponding to the smallest scale for 90 % of the waves with
 $|\varepsilon _{\boldsymbol {p}}|<0.2$; figure 4) and the critical vertical wavenumber
 $m_c=0.6$ m
 $^{-1}$, respectively. In (c), solid, dashed and dash-dotted lines denote
 $\omega =2f$,
 $3f$ and
 $4f$, respectively. Coloured curves denote PSI, ES, ID and local interactions (LT) using selection criteria defined in § 3.2.

The fluxes defined in (3.1)–(3.3) are energy transfer only due to nonlinear wave–wave interactions within the selected scale limits, and the values have to be zero at the boundaries (e.g.  $k_{min}$ and
 $k_{max}$, etc.) due to energy conservation. It is clear from figure 5 that the GM76 spectrum, as expected, does not yield a constant energy flux in any spectral direction. While the flux across frequency is bi-directional (figures 3 and 5c), the fluxes across horizontal and vertical wavenumbers are mainly in the forward direction (toward small scales).
To evaluate the downscale energy flux  $\mathcal {P}_d$ that provides energy for small-scale dissipation and mixing (i.e. to evaluate the finescale parameterization), we may follow two approaches. The first approach is to consider
 $\mathcal {P}_d=\mathcal {P}^m(m_c)$ with the critical vertical wavenumber
 $m_c$ evaluated through
 $\int _0^{m_c} 2m^2\,E_k(m)\,\textrm {d} m=2{\rm \pi} N^2/10$ (Polzin et al. Reference Polzin, Naveira Garabato, Huussen, Sloyan and Waterman2014). This approximation encapsulates the energy escaping the internal-wave field at the critical wavenumber
 $m_c\approx 0.6$ m
 $^{-1}$ past which internal waves become unstable to shear instability. The first approach gives
 $\mathcal {P}_d=\mathcal {P}^m(m_c)=1.5 \times 10^{-9}$ W kg
 $^{-1}$, with a factor 1.5 greater than
 $P_{finescale}=1.0 \times 10^{-9}$ W kg
 $^{-1}$ from (1.4) (equation rescaled for our values of
 $f$ and
 $N$). However, as seen in figure 4, the Boltzmann rate close to
 $m_c$ contains large regions of values that are not much less than 1, making the validity of the WKE questionable. The second approach is to instead define a cutoff vertical wavenumber
 $m_{cutoff}\approx 0.2$ m
 $^{-1}$, below which only 10 % of the computed waves violate the weak nonlinearity assumption with
 $|\varepsilon _{\boldsymbol {p}}|>0.2$. The second approach gives
 $\mathcal {P}_d=\mathcal {P}^m(m_{cutoff})=1.6 \times 10^{-9}$ W kg
 $^{-1}$. This approximation yields an upper bound of energy available for dissipation while (almost) free of uncertainties associated with the first approach. We should acknowledge that there exists a gap between the (vertical) length scales where the WKE breaks down and the scale of 10 m in the vertical. Fortunately, the energy-flux curve between the two scales (corresponding to
 $m_c\approx 0.6$ m
 $^{-1}$ and
 $m_{cutoff}\approx 0.2$ m
 $^{-1}$) is relatively insensitive to the vertical wavenumber (figure 5b), making our estimate quite robust.
3.2. Contributions of PSI, ES and ID triads
In this subsection, we discuss the decomposition of energy transfer into contributions from different mechanisms, namely non-local interactions of PSI, ES and ID, and local interactions. The non-local interactions exhibit scale separation in frequency or wavenumber, or both, based on which our classification method is designed. For a resonant triad, we rank the frequencies from high to low as  $(\omega ^H,\omega ^M,\omega ^L)$, and the magnitudes of vertical wavenumbers as
 $(|m^H|,|m^M|,|m^L|)$. We can then classify non-local interactions naturally according to some threshold values of the two metrics, as follows.
(i) PSI:
$|m^M|/|m^L|>\eta$, $1/2 \le \omega ^M/\omega ^H <1/2+\epsilon /2$.(ii) ES:
$\omega ^M/\omega ^L>\xi$, $1/2 \le |m^M|/|m^H| <1/2+\alpha /2$.(iii) ID:
$\omega ^M/\omega ^L>\xi$, $|m^M|/|m^L|>\eta$.


The above criterion characterizes PSI as scale-separated in  $m$ and halving in
 $\omega$, ES as scale-separated in
 $\omega$ and halving in
 $m$, and ID as scale-separated in both
 $m$ and
 $\omega$. In practice, we use
 $\xi =\eta =2$ and
 $\epsilon =\alpha =0.1$ for results below, but we note that the major conclusions hold for a reasonable range of parameters selected. We also remark that the above choices of
 $\xi$ and
 $\eta$ are ‘conservative’ for local interactions, in the sense that some interactions with moderate
 $\xi$ and
 $\eta$ (say slightly greater than 2) are classified as non-local, instead of local, interactions. This is not a drawback for this paper, as we will show that even for this ‘conservative’ choice of local interactions, their role in energy cascade is significant, in sharp contrast to the early conjecture of McComas et al. In the following subsubsections, we discuss the roles of each mechanism in spectral energy transfer.
3.2.1. The PSI mechanism
Parametric subharmonic instability represents the decay of a low-wavenumber parent wave into two nearly identical high-wavenumber child waves with half frequencies. One unit of action of the parent wave  $\boldsymbol {p}_0$ is transferred into two units of action of the child waves
 $\boldsymbol {p}_1$ and
 $\boldsymbol {p}_2$ (see figure 1a).
Using the criterion defined above, we compute the spectral energy transfer due to PSI, with results shown in figure 6(a). In terms of energy cascade in frequency, we see that PSI contributes predominantly to the backward cascade, namely moving energy from frequency band  $[2f,4f]$ (source) to
 $[f,2f]$ (sink). This frequency cascade is accompanied by a strong forward cascade in vertical wavenumbers, which is also clear from the figure. The physical picture of PSI revealed here is consistent with the existing understanding that PSI is effective in tidal damping (i.e. extracting energy above
 $2f$) and that PSI contributes significantly to downscale energy cascade in the IGW continuum (McComas & Bretherton Reference McComas and Bretherton1977).
As figure 3 but for different mechanisms: (a) PSI, (b) ES, (c) ID, (d) LT.

3.2.2. The ES mechanism
The energy transfer due to ES is plotted in figure 6(b), which shows a clear forward cascade in frequency. This was not understood by previous theory of McComas et al., which instead postulated that ES can be neglected for energy transfer in any vertically symmetric IGW spectrum. In fact, the previous postulation to neglect the ES contribution is a little surprising given that the dynamics of ES is similar to a diffusion process that can be understood in analogy to ID. (The previous researchers do have a better understanding of ID, as will be discussed later in the paper.) Consider an ES triad  $\boldsymbol {p}_0=\boldsymbol {p}_1+\boldsymbol {p}_2$ (figure 1b), where
 $\boldsymbol {p}_2$ is the near-inertial mode, and
 $\boldsymbol {p}_0$ and
 $\boldsymbol {p}_1$ are the high-frequency modes with
 $\omega _0 \approx \omega _1 + f$. Given the fact that the action spectra are red with respect to
 $\omega$, i.e. most action contained in low frequencies, it is reasonable to set
 $n_2\gg n_0,n_1$ and
 $n_0< n_1$. According to the WKE, we then have
 \begin{equation} \left.\begin{gathered} \partial n_0/\partial t= C f_{012} = C(n_1n_2 -n_0n_1-n_0n_2) \approx Cn_2(n_1-n_0) >0, \\ \partial n_1/\partial t={-}C f_{012} ={-}C(n_1n_2 -n_0n_1-n_0n_2) \approx{-}Cn_2(n_1-n_0) <0, \\ \partial n_2/\partial t={-}C f_{021} ={-}C(n_1n_2 -n_0n_1-n_0n_2) \approx{-}Cn_2(n_1-n_0) <0, \end{gathered}\right\} \end{equation}
where  $C=4{\rm \pi} \,|V(\boldsymbol {p}_0,\boldsymbol {p}_1,\boldsymbol {p}_2)|^2$ is a constant for this triad. The sign of
 $\partial n/\partial t$ indicates that
 $\boldsymbol {p}_0$ is a sink, while
 $\boldsymbol {p}_1$ and
 $\boldsymbol {p}_2$ are sources. Consumption of one unit of action of
 $\boldsymbol {p}_2$ combined with one unit of action of
 $\boldsymbol {p}_1$ results in generation of one unit of action of
 $\boldsymbol {p}_0$. This process can be described equivalently as diffusion from
 $\boldsymbol {p}_1$ to
 $\boldsymbol {p}_0$ (i.e. towards higher frequency), which in the meanwhile extracts energy from
 $\boldsymbol {p}_2$.
It is clear from the above analysis that a finite value of  $f$ is critical to enable the forward cascade in frequency, which we indeed incorporate in our calculation. The assumption
 $f=0$ used in previous research (either for convenience or for obtaining a scale-invariant WKE, as in Dematteis & Lvov Reference Dematteis and Lvov2021; Dematteis et al. Reference Dematteis, Polzin and Lvov2022) is perhaps one reason leading to the neglect of ES in energy transfer. With the above analysis, we can conclude that the forward frequency cascade by ES shown in figure 6(b) should essentially be expected, and we reach consistency in theory and numerical results.
3.2.3. The ID mechanism
The energy flux due to ID is plotted in figure 6(c), which shows a very weak transfer compared to those from other interaction mechanisms. One could further expect that ID contributes insignificantly to the downscale energy cascade for the GM76 spectrum. This is in strong disagreement with results in McComas & Müller (Reference McComas and Müller1981a,Reference McComas and Müllerb) that ID contributes nearly 30 % of the total downscale energy cascade. The result from McComas et al. originates from the hypothesis that the GM76 spectrum yields a constant downscale energy flux that relies on a logarithmic correction to the ID flux. It is clear from our analysis (figure 5) that the constant flux hypothesis is incorrect, thus the logarithmic correction has no meaningful ground.
The ID mechanism for GM76 or more general IGW spectra can be understood conveniently from a diffusion equation in the high- $m$, high-
 $\omega$ regime:
 $\partial n/\partial t=$
 $(\partial /\partial p_i)(\mathcal {D}_{ij}\,\partial n/\partial p_j)$, with
 $p_i=(k_x, k_y, m)$ for
 $i=1,2,3$, and
 $\mathcal {D}_{ij}$ as the diffusion coefficient matrix. This equation, including the detailed formulation of
 $\mathcal {D}_{ij}$, can be derived by taking dominant terms in the WKE or from a Wentzel–Kramers–Brillouin (WKB) approximation of the dynamic equation, which was first done in McComas & Müller (Reference McComas and Müller1981b) and re-derived by Lvov & Polzin (Reference Lvov and Polzin2022) for IGWs (see also derivations in other physical contexts, such as magnetohydrodynamic (MHD) turbulence (Nazarenko, Newell & Galtier Reference Nazarenko, Newell and Galtier2001), Rossby waves (Connaughton, Nazarenko & Quinn Reference Connaughton, Nazarenko and Quinn2015) and surface gravity waves (Korotkevich et al. Reference Korotkevich, Nazarenko, Pan and Shatah2023)). With
 $D_{33}$ being the dominant element in
 $\mathcal {D}_{ij}$ for IGWs, the leading-order effect of the diffusion takes place in the vertical wavenumber direction and can be approximated by a one-dimensional diffusion equation
 $\partial n/\partial t=(\partial /\partial m) (\mathcal {D}_{33}\,\partial n/\partial m)$. Along with this approximation, one can see that in the high-
 $m$, high-
 $\omega$ regime, the direction of diffusion is determined fully by the dependence of the wave action spectrum on
 $m$, i.e. action diffuses down gradient in the vertical wavenumber direction, according to
 $n(k_0, m)$ at a given
 $k_0$.
Alternatively, the physical picture of ID revealed above through the diffusion equation can be explained directly via the WKE using an argument similar to our previous one for ES. Take an ID triad  $\boldsymbol {p}_0=\boldsymbol {p}_1+\boldsymbol {p}_2$ (figure 1c), with
 $\boldsymbol {p}_1$ the low-
 $m$, low-
 $\omega$ mode, and consider
 $n_1\gg n_0,n_2$. Then we obtain from WKE that
 \begin{equation} \left.\begin{gathered} \partial n_0/\partial t= C f_{012}= C(n_1n_2 -n_0n_1-n_0n_2) \approx C n_1(n_2-n_0), \\ \partial n_1/\partial t={-}C f_{012}={-}C(n_1n_2 +n_0n_1+n_0n_2) \approx{-}C n_1(n_2-n_0), \\ \partial n_2/\partial t={-}C f_{021}={-}C(n_1n_2 +n_0n_1+n_0n_2) \approx{-}C n_1(n_2-n_0). \end{gathered}\right\} \end{equation}
We see that the exchange of action between the two high- $m$, high-
 $\omega$ modes,
 $\boldsymbol {p}_2$ and
 $\boldsymbol {p}_0$, depends on the relative magnitudes between
 $n_2$ and
 $n_0$. The one that is greater between
 $n_2$ and
 $n_0$ serves as the source of the diffusion, and the other as the sink. If we further assume that
 $\boldsymbol {p}_0$ and
 $\boldsymbol {p}_2$ have the same horizontal wavenumber
 $k_0$, i.e.
 $\boldsymbol {p}_1$ is (almost) vertical, then the diffusion direction is again determined by the dependence of
 $n(k_0, m)$ on
 $m$.
Now let us consider a general power-law spectrum in the high- $m$, high-
 $\omega$ regime:
 $E(\omega,m)\sim \omega ^{-2-p} m^{-2-p-q}$, equivalent to
 $n(k,m)\sim k^{-4-p} m^{-q}$. Based on the above analysis (from either the diffusion equation or the WKE), the leading-order diffusion direction is controlled only by the parameter
 $q$. For the GM76 spectrum with
 $p=q=0$, it is expected that the leading-order diffusion vanishes, i.e. the GM76 spectrum is indeed approximately a zero-flux state for ID. The energy transfer in figure 6(c), in fact, comes mainly from the (off-diagonal) sub-elements in
 $\mathcal {D}_{ij}$ (other than
 $\mathcal {D}_{33}$). The effects of the sub-diffusion is analysed analytically in Dematteis et al. (Reference Dematteis, Polzin and Lvov2022) for the scale-invariant case. For our case with finite
 $f$ (which breaks the scale invariance), an analytical treatment is generally much difficult. Nevertheless, our direct numerical calculation shows that the transfer generated by the sub-diffusion is weak compared to other interaction mechanisms.
We can further deduce the ID dynamics under conditions  $q>0$ and
 $q<0$. For
 $q>0$ and
 $q<0$, respectively, the action diffuses towards higher and lower
 $m$ (with the same
 $k$), indicating a backward and a forward cascade in frequency. We can leverage our numerical tools to verify these inferences. For the former with
 $q>0$, we consider a GM75 spectrum with
 $p=0$ and
 $q=0.5$. The energy transfer due to ID is computed as shown in figure 7(a), where we do see a dominating backward cascade in frequency. For the latter, we consider a realistic spectrum
 $E(\omega,m)\sim \omega ^{-2}m^{-1.8}$ with
 $p=0$ and
 $q=-0.2$ taken from field measurements in the Southeast Subtropical North Pacific (Polzin & Lvov Reference Polzin and Lvov2011) reporting
 $E(\omega,m)\sim \omega ^{-2}m^{-1.9}$ to
 $E(\omega,m)\sim \omega ^{-2}m^{-1.75}$. The ID energy transfer, as shown in figure 7(b), indeed exhibits a dominating forward cascade. In summary, the ID mechanism can lead to different directions of energy cascade depending on the spectral slopes of the IGW continuum and should be understood with respect to the specific spectrum of interest.
As figure 3 but for the ID mechanism: (a,b) GM75 spectrum with  $E(\omega,m)\sim \omega ^{-2} m^{-2.5}$, and (c,d) a modified GM76 spectrum with
 $E(\omega,m)\sim \omega ^{-2} m^{-1.8}$, for (a,c) sinks, and (b,d) sources.

3.2.4. The local interactions
The energy transfer by local interactions is shown in figure 6(d). We see a clear bi-directional cascade in frequency extracting energy out of the frequency band  $[2f,4f]$. The transfer is not only non-negligible but stronger than any other interaction mechanisms. The McComas et al. early assumption about the dominance of scale-separated triad interactions in energy transfer is clearly incorrect for the GM76 (and perhaps general) spectrum. While it is difficult to trace exactly the ground based on which McComas et al. made this assumption, it is likely related to some simple calculation regarding the interaction coefficient
 $V$ and red IGW action spectra. However, a comprehensive understanding of the problem also relies on other factors, such as the number of triads participating in energy transfer and the specific form of the GM76 action spectrum. Our direct calculation of (1.1) encapsulating all factors clearly demonstrates the paramount importance of local interactions for the GM76 spectrum. The result here also echoes those in Dematteis & Lvov (Reference Dematteis and Lvov2021) and Dematteis et al. (Reference Dematteis, Polzin and Lvov2022) for a modified GM76 spectrum in the scale-invariant case.
3.3. Constituents of energy flux
The energy fluxes in directions  $k$,
 $m$ and
 $\omega$ due to each mechanism are plotted in figure 5. For forward cascade in
 $k$, we see that majority of the cascade is provided by local interactions, with ES contributing a relatively small fraction. For forward cascade in
 $m$, local interactions and PSI each contribute approximately half to the total flux. The energy transfer in frequency exhibits a bi-directional flux. The backward flux, moving energy from
 $[2f, 4f]$ to lower frequencies, is supplied by both PSI and local interactions with similar magnitudes. The forward cascade results from local interactions, ES and ID (mainly from the sub-diffusion process) with descending contributions. Among all directional cascades, local interactions are the only mechanism participating significantly in all of them, which was neglected in the early works of McComas et al.
We are finally in a good position to state our new understanding regarding paradoxes (a) and (b). For (a), we now understand that the frequency cascade is bi-directional, with the forward flux provided by local interactions, ES and ID, all elements ignored in the works of McComas et al. For (b), the ID mechanism in GM76 is indeed approximately a zero-flux state, except that it forms a weak forward cascade in frequency through the sub-diffusion process. The McComas et al. argument about ID providing a significant portion of the downscale flux should be replaced by local interactions.
4. Conclusions and discussions
Through direct evaluation of the collision integral in the WKE of IGWs, we study the spectral energy transfer for the GM76 spectrum. Our calculation of the downscale energy flux, through its maximum value over all vertical wavenumbers, provides an estimate in close agreement with the finescale parameterization. We also analyse different interaction mechanisms, resolving some long-standing paradoxes in the field. Our new understanding includes the following.
(1) Local interactions are important for energy cascade in all spectral directions, which were completely neglected in early works by McComas et al.
(2) The downscale energy flux (towards high vertical wavenumbers) is supplied by PSI and local interactions, rather than PSI and ID as understood by McComas et al.
(3) The ID mechanism can provide cascade towards different directions depending on spectral slopes of the IGW continuum. For GM76, the leading-order flux by ID vanishes, with the sub-diffusion process providing a weak forward frequency cascade.
(4) The ES mechanism provides a forward frequency cascade (but no cascade in wavenumbers) in vertically symmetric IGW fields, which was not investigated in previous works.
Our capability of numerical evaluation of the WKE opens a new door to an advanced understanding of oceanic IGW cascade and mixing. Among all possible directions of future study, an immediately fruitful one is to evaluate the flux properties and magnitudes for various IGW spectral forms. As revealed in field measurements (e.g. Polzin & Lvov Reference Polzin and Lvov2011) and wave turbulence theory (e.g. Lvov et al. (Reference Lvov, Polzin, Tabak and Yokoyama2010) in terms of stationary solutions to the WKE), the oceanic IGW spectrum exhibits large variability, deviating from the GM76 model. Under this circumstance, it is not clear whether the current finescale formula (1.4), developed mainly with reference to the GM76 spectrum, is sufficiently robust for all IGW spectral forms. Our numerical method provides a direct approach through which this problem can be studied. In addition, combining our WKE predictions with recent high-resolution regional ocean simulations (e.g. Nelson et al. Reference Nelson, Arbic, Menemenlis, Peltier, Alford, Grisouard and Klymak2020; Thakur et al. Reference Thakur, Arbic, Menemenlis, Momeni, Pan, Peltier, Skitka, Alford and Ma2022; Skitka et al. Reference Skitka, Arbic, Thakur, Menemenlis, Peltier, Pan, Momeni and Ma2023) may bring new insights to the field.
We would also like to mention that there is an active debate on the relative importance between the nonlinear wave–wave interactions and wave–eddy interactions in IGW energy cascade, and our current paper clearly does not consider the latter. In order to consider both processes, it may be beneficial, as a first-order approximation, to include an additional eddy-diffusion term (Kafiabad et al. Reference Kafiabad, Savva and Vanneste2019; Dong et al. Reference Dong, Bühler and Smith2020) in the WKE and study the full equation (note that this eddy diffusion is linear assuming a stationary eddy field). While these are future directions we plan to consider, the current work perhaps already has shed some light on the problem in terms of understanding the importance of local interactions that is only part of the wave–wave interactions.
Supplementary material
The data that support the findings of this study are openly available on GitHub at https://github.com/yue-cynthia-wu.
Acknowledgements
The authors thank G. Demantteis, Y. Lvov, S. Nazarenko, J. Shatah, B. Arbic, J. Skitka and two anonymous reviewers for their helpful advice.
Funding
This research is supported by the National Science Foundation (award nos OCE-2241495 and OCE-2306124) and the Simons Foundation through Simons Collaboration on Wave Turbulence.
Declaration of interests
The authors report no conflict of interest.
Appendix A. Reduction of the kinetic equation on a resonant manifold
For a horizontally isotropic IGW spectrum, it is convenient to convert the collision integral to cylindrical coordinates and integrate out the dependence on the horizontal azimuth. For example, the term of summation interactions can be transformed to
 \begin{align} I^+
&=\mathop {\int\!\!\!\!\iiiint\!\!\!\!\int}\limits_{-\infty}^{+\infty}
J^+\,\textrm{d} k_{1x}\,\textrm{d} k_{1y}\,\textrm{d}
k_{2x} \,\textrm{d} k_{2y}\,\textrm{d} m_1\,\textrm{d} m_2
\nonumber\\ &= \mathop \int_{-\infty}^{+\infty}
\int_{-\infty}^{+\infty} \int_0^{2{\rm \pi}} \int_0^{2{\rm \pi}}
\int_0^{+\infty} \int_0^{+\infty} k_1 k_2 J^+\,\textrm{d}
k_1\,\textrm{d}
k_2\,\textrm{d}\theta_1\,\textrm{d}\theta_2\,\textrm{d}
m_1\,\textrm{d} m_2,
\end{align}
where  $J^+=4{\rm \pi} \,|V^{\boldsymbol {p}}_{\boldsymbol {p}_1,\boldsymbol {p}_2}|^2\,f_{p12}\, \delta (\omega -\omega _1-\omega _2)\,\delta (\boldsymbol {k}-\boldsymbol {k}_1-\boldsymbol {k}_2)\, \delta (m-m_1-m_2)$,
 $\boldsymbol {p}= (\boldsymbol {k}, m)=(k_x,k_y,m)$ is the three-dimensional wavenumber vector,
 $\boldsymbol {k}=(k_x,k_y)$ is the horizontal wavenumber vector, and
 $k=|\boldsymbol {k}|$ is the horizontal wavenumber magnitude.
We define
 \begin{equation} Q^+= 4{\rm \pi}\,|V^{\boldsymbol{p}}_{\boldsymbol{p}_1,\boldsymbol{p}_2}|^2\,f_{p12}\, \delta(\omega-\omega_1-\omega_2)\,\delta(m-m_1-m_2)\,k_1 k_2. \end{equation}
Thus
 $$\begin{align} I^+ &=\int_{-\infty}^{+\infty} \int_{-\infty}^{+\infty}
\int_0^{+\infty} \int_0^{+\infty} \int_0^{2{\rm \pi}}
\int_0^{2{\rm \pi}}
Q^+\,\delta(\boldsymbol{k}-\boldsymbol{k}_1-
\boldsymbol{k}_2)\,\textrm{d}\theta_1\,\textrm{d}\theta_2\,\textrm{d} k_1\,\textrm{d} k_2\,\textrm{d} m_1\,\textrm{d}
m_2 \nonumber\\ &=\int_{-\infty}^{+\infty}
\int_{-\infty}^{+\infty} \int_0^{+\infty} \int_0^{+\infty}
\int_0^{2{\rm \pi}} \int_0^{2{\rm \pi}} Q^+\,\delta(k-k_1\cos
\theta_1 -k_2\cos \theta_2) \nonumber\\ &\quad
\times\delta(k_1\sin \theta_1+k_2\sin \theta_2)\,\textrm{d}\theta_1\,\textrm{d}\theta_2\,\textrm{d} k_1\,\textrm{d} k_2\,
\textrm{d} m_1\,\textrm{d} m_2 \nonumber\\ &=\int_{-\infty}^{+\infty}
\int_{-\infty}^{+\infty} \int_0^{+\infty} \int_0^{+\infty}
(2Q^+_{\triangle^+}/|\boldsymbol{\mathcal J}|)\,\textrm{d} k_1\,\textrm{d} k_2\,\textrm{d} m_1\,\textrm{d} m_2 \nonumber\\
&=\int_{-\infty}^{+\infty} \int_{-\infty}^{+\infty}
\int_0^{+\infty}
\int_0^{+\infty}(Q^+_{\triangle^+}/S_{\triangle})\,\textrm{d} k_1\,\textrm{d} k_2\,\textrm{d} m_1\,\textrm{d} m_2,\end{align}$$
where  $\boldsymbol{\mathcal{J}$ is the Jacobian, and
 $S_{\triangle }$ is the area of the triangle formed by
 $\boldsymbol {k}$,
 $\boldsymbol {k}_1$ and
 $\boldsymbol {k}_2$. The subscript
 $\triangle ^+$ of
 $Q^+$ denotes the projection on the manifold of
 $\boldsymbol {k}=\boldsymbol {k}_1+\boldsymbol {k}_2$ for given
 $k$,
 $k_1$ and
 $k_2$. The angle integration involved in the above equation can be found in many wave turbulence literatures, e.g. Zakharov et al. (Reference Zakharov, Lvov and Falkovich1992), Lvov et al. (Reference Lvov, Polzin and Yokoyama2012) and Pan (Reference Pan2017).
Repeating this procedure for reduction interactions, we obtain
 \begin{gather} Q^-= 4{\rm \pi}\,|V^{\boldsymbol{p}_1}_{\boldsymbol{p},\boldsymbol{p}_2}|^2\,f_{1p2}\, \delta(\omega-\omega_1+\omega_2)\,\delta(m-m_1+m_2)\,k_1 k_2, \end{gather}
 \begin{gather}I^-=\int_{-\infty}^{+\infty} \int_{-\infty}^{+\infty} \int_0^{+\infty} \int_0^{+\infty} (Q^-_{\triangle^-}/S_{\triangle})\,\textrm{d} k_1\,\textrm{d} k_2\,\textrm{d} m_1\,\textrm{d} m_2, \end{gather}
where the subscript  $\triangle ^-$ of
 $Q^-$ denotes the projection on the manifold of
 $\boldsymbol {k}_1=\boldsymbol {k}+\boldsymbol {k}_2$ for given
 $k$,
 $k_1$ and
 $k_2$.
We further integrate out the delta function in vertical wavenumbers in (A3) and (A5), which gives
 \begin{align} CL= I^+ + 2I^- &=
\mathop{\iint}\limits_{0\hphantom{00}}^{+\infty} \left\{\int_{-\infty}^{+\infty}
h^+(k, k_1, k_2, m, m_1)\, \delta[g^+(k, k_1, k_2, m,
m_1)] \textrm{d} m_1 \right. \nonumber\\ &\quad
\left.{}-2\int_{-\infty}^{+\infty} h^-(k, k_1, k_2, m,
m_1)\, \delta[g^-(k, k_1, k_2, m, m_1)]
\textrm{d} m_1 \right\}\textrm{d} k_1\,\textrm{d} k_2.
\end{align}
In the inside integral, for given  $k$,
 $m$,
 $k_1$ and
 $k_2$,
 \begin{equation} \left.\begin{gathered} h^+(m_1) = 4{\rm \pi}\,|V^{\boldsymbol{p}}_{\boldsymbol{p}_1,\boldsymbol{p}_2}|^2_{\triangle^+,m^+}\, f_{p12,\triangle^+,m^+}\,k_1 k_2/S_{\triangle},\\ h^-(m_1) = 4{\rm \pi}\,|V^{\boldsymbol{p}_1}_{\boldsymbol{p},\boldsymbol{p}_2}|^2_{\triangle^-,m^-}\, f_{1p2,\triangle^-,m^-}\,k_1 k_2/S_{\triangle},\\ g^+(m_1) = \omega-\omega_1(m_1)-\omega_2(m-m_1),\\ g^-(m_1) = \omega-\omega_1(m_1)+\omega_2(m_1-m), \end{gathered}\right\} \end{equation}
where the subscript  $m^+$ (
 $m^-$) of the interaction coefficient
 $V$ and quadratic function
 $f_{p12}$ (
 $\,f_{1p2}$) denotes projection on
 $m=m_1+m_2$ (
 $m_1=m+m_2$).
Finally,  $CL$ is reduced to an integration over two dimensions
 $k_1$ and
 $k_2$ by integrating out the delta function in frequency:
 \begin{equation} CL= \mathop{\iint}\limits_{0\hphantom{00}}^{+\infty} \left[\frac{h^+(m^{*+}_1)}{|{g^+}'(m^{*+}_1)|}-2\, \frac{h^-(m^{*-}_1)}{|{g^-}'(m^{*-}_1)|}\right] \textrm{d} k_1\,\textrm{d} k_2, \end{equation}
where  $m^{*+}_1$ is the root of
 $g^+(m_1)=0$ for summation interactions, and
 $m^{*-}_1$ is the root of
 $g^-(m_1)=0$ for reduction interactions. The denominators
 ${g^+}'(m_1)$ and
 ${g^-}'(m_1)$ are the
 $m_1$-derivatives of functions
 $g^+(m_1)$ and
 $g^-(m_1)$, respectively (see also (8) of Eden et al. Reference Eden, Pollmann and Olbers2019b):
 \begin{equation} {g^+}'(m_1)={g^-}'(m_1)=\frac{m_1}{\omega_1}\,\frac{\omega_1^2-f^2}{k_1^2+m_1^2}-\frac{m_2}{\omega_2}\, \frac{\omega_2^2-f^2}{k_2^2+m_2^2}. \end{equation}
We note that (A3) and (A5) involve a singularity (first-order pole) when  $\boldsymbol {p}$,
 $\boldsymbol {p}_1$ and
 $\boldsymbol {p}_2$ lie on the same vertical plane, i.e.
 $k=k_1+k_2$ or
 $k_1=k+k_2$, leading to
 $S_{\triangle }=0$ and corresponding to the collinear triad interactions described in Dematteis & Lvov (Reference Dematteis and Lvov2021). However, this is an integrable singularity since it is not involved in (A1) before the coordinate transform and angle integration. Therefore, given sufficiently fine grid resolution of
 $k_1$ and
 $k_2$, the singularity point can be neglected in the integration of (A8). For finite grid resolution, we can retrieve approximately the contribution from the nearby region of the singularity point using (A1) (and its counterpart for reduction interactions). Specifically, for given
 $k$ and
 $m$, contributions from the vicinity of all singularities in the integral of (A8) can be accounted for by treating (A1) with the following procedures: set (due to isotropy)
 $\boldsymbol {k}=(k,0)$; integrate out the delta function in
 $\boldsymbol {k}$ with respect to the integration over
 $k_{2x}$ and
 $k_{2y}$; consider
 $\boldsymbol {k}_1$ in the same direction as
 $\boldsymbol {k}$ by setting
 $k_{1y}=0$, and convert the integration along
 $k_{1y}$ into the integral multiplying by the grid size
 ${\rm \Delta} k$; change the dummy variable
 $k_{1x}$ into
 $k_1$; integrate out the
 $\omega$ and
 $m$ delta functions with respect to the integration over
 $m_1$ and
 $m_2$. These procedures lead to
 \begin{equation} \left.\begin{gathered} CL_0= {\rm \Delta} k \int_0^{+\infty} \left[\frac{h_0^+(m^{*+}_1)}{|{g^+}'(m^{*+}_1)|}-2\, \frac{h_0^-(m^{*-}_1)}{|{g^-}'(m^{*-}_1)|}\right] \textrm{d} k_1,\\ h_0^+(m_1) = 4{\rm \pi}\,|V^{\boldsymbol{p}}_{\boldsymbol{p}_1,\boldsymbol{p}_2}|^2_{{\parallel}^+,m^+}\, f_{p12,\parallel^+,m^+},\\ h_0^-(m_1) = 4{\rm \pi}\,|V^{\boldsymbol{p}_1}_{\boldsymbol{p},\boldsymbol{p}_2}|^2_{{\parallel}^-,m^-}\, f_{1p2,\parallel^-,m^-}, \end{gathered}\right\} \end{equation}
where the subscript  $\parallel ^+$ denotes projection on
 $\boldsymbol {k}=(k,0)$,
 $\boldsymbol {k}_1=(k_1,0)$ and
 $\boldsymbol {k}_2=(k-k_1,0)$, and
 $\parallel ^-$ projection regarding the reduction interactions.
Appendix B. Root finding for $m^{*+}_1$ and $m^{*-}_1$


For given  $k$,
 $k_1$,
 $k_2$ and
 $m$, we search for the roots
 $m^{*+}_1$ and
 $m^{*-}_1$ of
 $g^+(m_1)=g^-(m_1)=0$ for summation and reduction interactions, respectively. Figure 8 shows a graphical interpretation of the root finding for an example case. In this example, it is shown that two roots of
 $m^{*+}_1$ exist for summation interactions, and two roots of
 $m^{*-}_1$ exist for reduction interactions. We note that this example of geometric interpretation cannot rule out the situation where different numbers of roots exist for either type of interaction, especially for a finite range of
 $m$ as in the simulation. In order to cover all possible roots in our numerical root-finding procedure, we set two initial guesses
 $m_1=(0,m)$ and start searching for the roots towards the left and right of both initial guesses along the
 $m_1$-axis using Brent's algorithm (Brent Reference Brent1971) until we have covered the full range of the numerical spectral domain.
Graphical interpretation of the root finding for  $m^*_{1+}$ and
 $m^*_{1-}$ in an example case, given
 $k$,
 $k_1$,
 $k_2$ and
 $m$.


 Open access

