



%20--%3e%3c!DOCTYPE%20svg%20PUBLIC%20'-//W3C//DTD%20SVG%201.0//EN'%20'http://www.w3.org/TR/2001/REC-SVG-20010904/DTD/svg10.dtd'%3e%3csvg%20version='1.0'%20id='Layer_1'%20xmlns='http://www.w3.org/2000/svg'%20xmlns:xlink='http://www.w3.org/1999/xlink'%20x='0px'%20y='0px'%20width='64px'%20height='64px'%20viewBox='5.5%20-3.5%2064%2064'%20enable-background='new%205.5%20-3.5%2064%2064'%20xml:space='preserve'%3e%3cg%3e%3ccircle%20fill='%23FFFFFF'%20fill-opacity='0'%20cx='37.785'%20cy='28.501'%20r='28.836'/%3e%3cpath%20fill='%23595959'%20d='M37.441-3.5c8.951,0,16.572,3.125,22.857,9.372c3.008,3.009,5.295,6.448,6.857,10.314%20c1.561,3.867,2.344,7.971,2.344,12.314c0,4.381-0.773,8.486-2.314,12.313c-1.543,3.828-3.82,7.21-6.828,10.143%20c-3.123,3.085-6.666,5.448-10.629,7.086c-3.961,1.638-8.057,2.457-12.285,2.457s-8.276-0.808-12.143-2.429%20c-3.866-1.618-7.333-3.961-10.4-7.027c-3.067-3.066-5.4-6.524-7-10.372S5.5,32.767,5.5,28.5c0-4.229,0.809-8.295,2.428-12.2%20c1.619-3.905,3.972-7.4,7.057-10.486C21.08-0.394,28.565-3.5,37.441-3.5z%20M37.557,2.272c-7.314,0-13.467,2.553-18.458,7.657%20c-2.515,2.553-4.448,5.419-5.8,8.6c-1.354,3.181-2.029,6.505-2.029,9.972c0,3.429,0.675,6.734,2.029,9.913%20c1.353,3.183,3.285,6.021,5.8,8.516c2.514,2.496,5.351,4.399,8.515,5.715c3.161,1.314,6.476,1.971,9.943,1.971%20c3.428,0,6.75-0.665,9.973-1.999c3.219-1.335,6.121-3.257,8.713-5.771c4.99-4.876,7.484-10.99,7.484-18.344%20c0-3.543-0.648-6.895-1.943-10.057c-1.293-3.162-3.18-5.98-5.654-8.458C50.984,4.844,44.795,2.272,37.557,2.272z%20M37.156,23.187%20l-4.287,2.229c-0.458-0.951-1.019-1.619-1.685-2c-0.667-0.38-1.286-0.571-1.858-0.571c-2.856,0-4.286,1.885-4.286,5.657%20c0,1.714,0.362,3.084,1.085,4.113c0.724,1.029,1.791,1.544,3.201,1.544c1.867,0,3.181-0.915,3.944-2.743l3.942,2%20c-0.838,1.563-2,2.791-3.486,3.686c-1.484,0.896-3.123,1.343-4.914,1.343c-2.857,0-5.163-0.875-6.915-2.629%20c-1.752-1.752-2.628-4.19-2.628-7.313c0-3.048,0.886-5.466,2.657-7.257c1.771-1.79,4.009-2.686,6.715-2.686%20C32.604,18.558,35.441,20.101,37.156,23.187z%20M55.613,23.187l-4.229,2.229c-0.457-0.951-1.02-1.619-1.686-2%20c-0.668-0.38-1.307-0.571-1.914-0.571c-2.857,0-4.287,1.885-4.287,5.657c0,1.714,0.363,3.084,1.086,4.113%20c0.723,1.029,1.789,1.544,3.201,1.544c1.865,0,3.18-0.915,3.941-2.743l4,2c-0.875,1.563-2.057,2.791-3.541,3.686%20c-1.486,0.896-3.105,1.343-4.857,1.343c-2.896,0-5.209-0.875-6.941-2.629c-1.736-1.752-2.602-4.19-2.602-7.313%20c0-3.048,0.885-5.466,2.658-7.257c1.77-1.79,4.008-2.686,6.713-2.686C51.117,18.558,53.938,20.101,55.613,23.187z'/%3e%3c/g%3e%3c/svg%3e)
%20--%3e%3c!DOCTYPE%20svg%20PUBLIC%20'-//W3C//DTD%20SVG%201.0//EN'%20'http://www.w3.org/TR/2001/REC-SVG-20010904/DTD/svg10.dtd'%3e%3csvg%20version='1.0'%20id='Layer_1'%20xmlns='http://www.w3.org/2000/svg'%20xmlns:xlink='http://www.w3.org/1999/xlink'%20x='0px'%20y='0px'%20width='64px'%20height='64px'%20viewBox='5.5%20-3.5%2064%2064'%20enable-background='new%205.5%20-3.5%2064%2064'%20xml:space='preserve'%3e%3cg%3e%3ccircle%20fill='%23FFFFFF'%20fill-opacity='0'%20cx='37.637'%20cy='28.806'%20r='28.276'/%3e%3cg%3e%3cpath%20fill='%23595959'%20d='M37.443-3.5c8.988,0,16.57,3.085,22.742,9.257C66.393,11.967,69.5,19.548,69.5,28.5c0,8.991-3.049,16.476-9.145,22.456%20C53.879,57.319,46.242,60.5,37.443,60.5c-8.649,0-16.153-3.144-22.514-9.43C8.644,44.784,5.5,37.262,5.5,28.5%20c0-8.761,3.144-16.342,9.429-22.742C21.101-0.415,28.604-3.5,37.443-3.5z%20M37.557,2.272c-7.276,0-13.428,2.553-18.457,7.657%20c-5.22,5.334-7.829,11.525-7.829,18.572c0,7.086,2.59,13.22,7.77,18.398c5.181,5.182,11.352,7.771,18.514,7.771%20c7.123,0,13.334-2.607,18.629-7.828c5.029-4.838,7.543-10.952,7.543-18.343c0-7.276-2.553-13.465-7.656-18.571%20C50.967,4.824,44.795,2.272,37.557,2.272z%20M46.129,20.557v13.085h-3.656v15.542h-9.944V33.643h-3.656V20.557%20c0-0.572,0.2-1.057,0.599-1.457c0.401-0.399,0.887-0.6,1.457-0.6h13.144c0.533,0,1.01,0.2,1.428,0.6%20C45.918,19.5,46.129,19.986,46.129,20.557z%20M33.042,12.329c0-3.008,1.485-4.514,4.458-4.514s4.457,1.504,4.457,4.514%20c0,2.971-1.486,4.457-4.457,4.457S33.042,15.3,33.042,12.329z'/%3e%3c/g%3e%3c/g%3e%3c/svg%3e)
1. Introduction
Massive stars drive powerful, radiatively driven winds structured on multiple spatial scales. Small-scale clumping arises from intrinsic instabilities in the line-driving mechanism, while large-scale asymmetries often take the form of Corotating Interaction Regions (CIRs). These CIRs originate from surface perturbations that interact with stellar rotation, producing spiral density and velocity patterns throughout the wind. Observationally, such structures reveal themselves through the presence of Discrete Absorption Components (DACs) in ultraviolet P Cygni profiles. DACs appear as narrow, blue-shifted absorption features that drift toward higher velocities in time-series spectra, tracing the rotational modulation of the outflow. They are ubiquitous among O-type (Howarth and Prinja Reference Howarth and Prinja1989) stars. Hydrodynamic and 3D radiative simulations (Cranmer and Owocki Reference Cranmer and Owocki1996; Dessart Reference Dessart2004) reproduce the observed DAC behavior as the natural outcome of CIRs generated by photospheric perturbations. These spiral structures are now widely recognized as key contributors to the spectroscopic and spectropolarimetric variability observed in hot, massive stars (Harries et al. Reference Harries, Howarth, Schulte-Ladbeck and Hillier1999).
In Wolf–Rayet (WR) stars, detecting DACs is much more difficult because their dense, optically thick winds produce heavily saturated UV P Cygni profiles. Nevertheless, hydrodynamic models suggest that CIRs may still play a crucial role in shaping WR wind variability. Such large-scale structures, rooted at the wind base, are expected to produce detectable asymmetries in polarimetric observables, offering a unique diagnostic of wind geometry. Early spectropolarimetric observations of Wolf–Rayet stars revealed clear, line-dependent polarization variations consistent with large-scale wind asymmetries. Early work by Drissen et al. (Reference Drissen, Robert, Lamontagne and Moffat1989) and Schulte-Ladbeck et al. (Reference Schulte-Ladbeck, Nordsieck, Taylor and Magalhães1990); Schulte-Ladbeck et al. (Reference Schulte-Ladbeck, Nordsieck and Taylor1991); Schulte-Ladbeck et al. (Reference Schulte-Ladbeck, Nordsieck, Taylor, Bjorkman, Magalhães and Wolff1992) reported complex variations in both polarization amplitude and position angle across emission lines, often forming closed “loops” in the Stokes Q–U plane—particularly across the He ii  $\lambda$ 4686 line, suggesting that the wind of WR 6 could be interpreted as an expanding and rotating axisymmetric disc structure. Robert et al. (Reference Robert, Moffat, Drissen, Lamontagne and Seggewiss1992) also detected loci in the Q–U plane across He ii
 $\lambda$ 4686, but crucially found a reversal in the handedness of the loops over WR 6’s 3.76-day period, indicating rotational modulation of a large-scale wind structure.
Later, Harries et al. (Reference Harries, Howarth, Schulte-Ladbeck and Hillier1999) presented long-term observations of both the continuum and line polarization of WR 6. They observed continuum polarization-angle variations of nearly 80řc over a three-year interval, which they attributed to the presence of CIRs as the most consistent explanation for the temporal evolution of both the continuum and line polarization. Using radiative-transfer modeling, they showed that such large-scale spiral structures in a rotating wind could reproduce the observed variability. More recent studies have further supported this interpretation, advocating the presence of CIRs in WR 6’s wind arising from surface perturbations (e.g., St-Louis et al. Reference St-Louis, Tremblay and Ignace2018; Barclay et al. Reference Barclay, Rosu, Richardson, Chené, St-Louis, Ignace and Moffat2024). Alternative scenarios, such as a colliding-wind binary interaction (Koenigsberger and Schmutz Reference Koenigsberger and Schmutz2020), have also been proposed to account for the periodic variability, although a third body would be required to explain the long-term time-dependent modulation. In all cases, the observed variability reflects persistent departures from spherical symmetry in the wind. Because linear spectropolarimetry directly probes geometric asymmetries through Thomson scattering, it provides a powerful diagnostic to test these interpretations. We confront these ideas here using linear spectropolarimetric observations of WR 6.
2. Observation and methods
We obtained two spectropolarimetric datasets of WR 6 using ESPaDOnS (Echelle Spectro-Polarimetric Device for the Observation of Stars) at the Canada–France–Hawaii Telescope (CFHT), on 2009 January 6–9 and 2010 February 24–27. ESPaDOnS provides a resolving power of R  $\sim$ 68 000 over the
 range, allowing us to measure the linear polarization Stokes parameters (Q, U) across numerous emission lines. The absolute level of the continuum polarization measured by ESPaDOnS is not reliable, but the line-to-continuum ratio is not affected. We therefore, focus on the relative polarization variations across emission lines and define the difference between the polarization in the line and the neighboring continuum :
 \begin{equation} \Delta q = q_{{\lambda}} - q_{\mathrm{cont}}, \qquad \Delta u = u_{{\lambda}} - u_{\mathrm{cont}},\end{equation}
We also define the polarization amplitude  $\Delta p = \sqrt{(\Delta q)^2 + (\Delta u)^2}$. and the polarization position angle as
 $\theta$ =
 $\frac{1}{2} \arctan \left( \frac{\Delta u}{\Delta q} \right)$.
3. Results
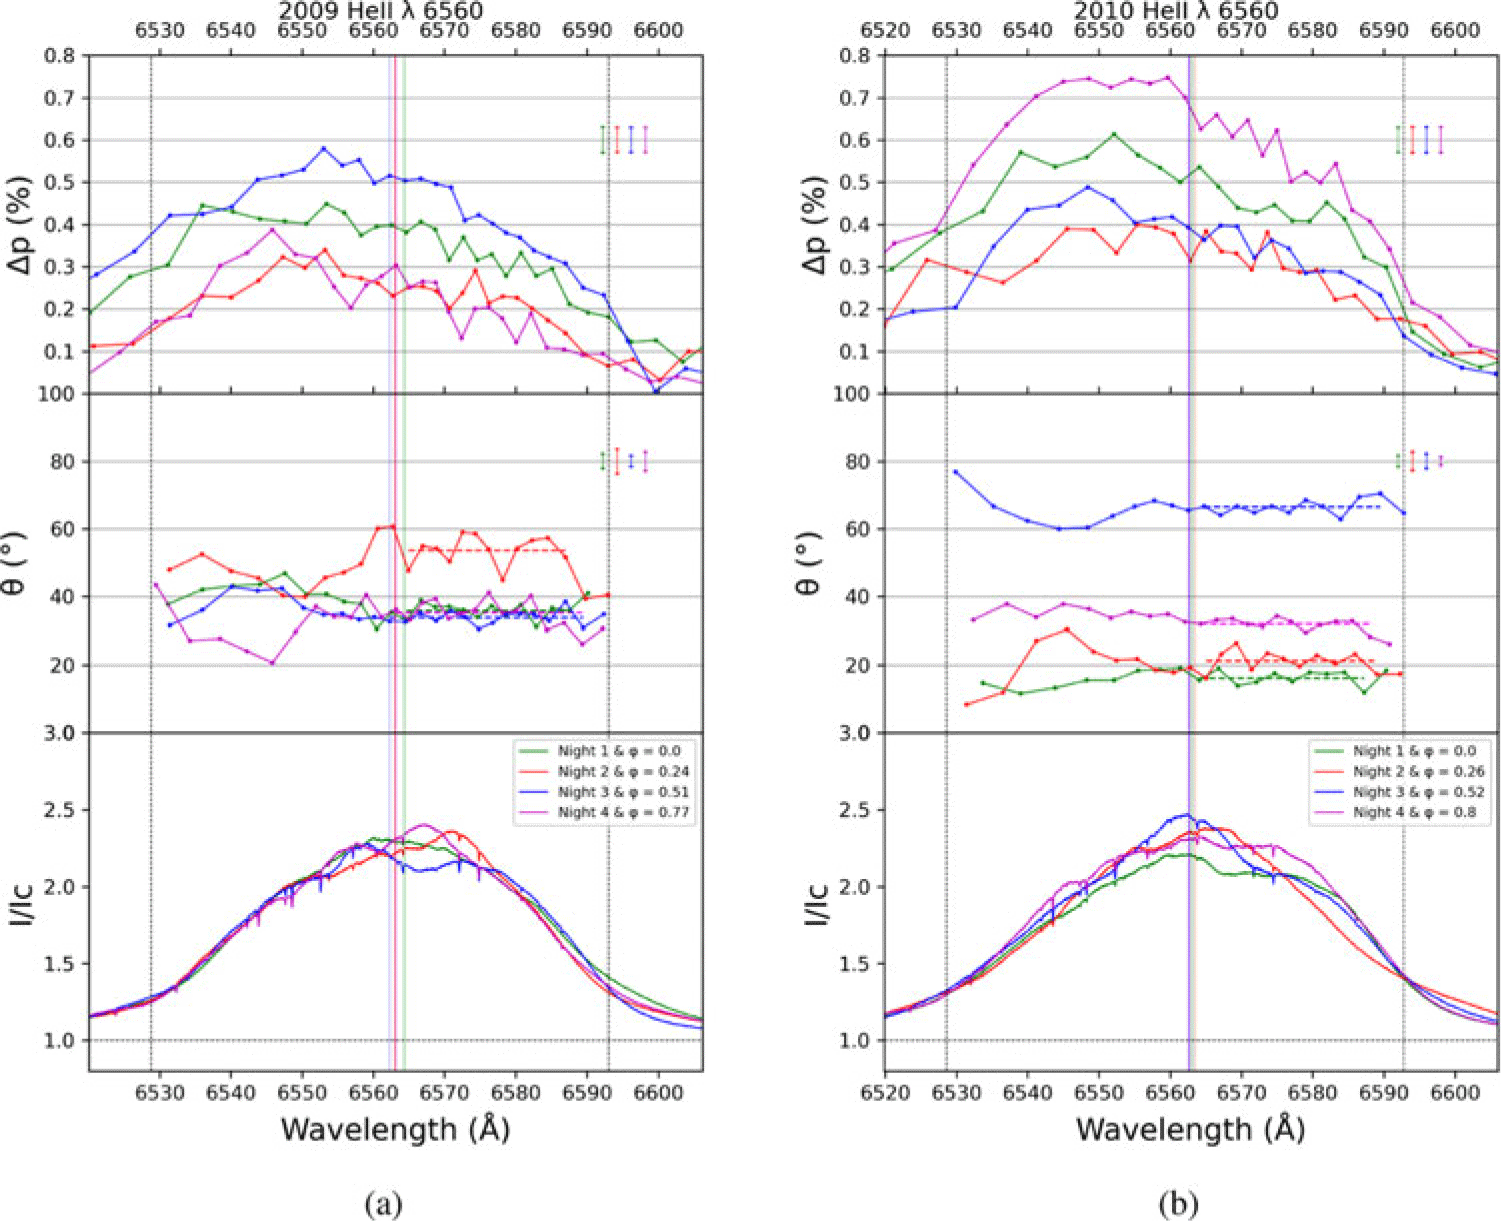
Figure 1 presents the linear spectropolarimetric data for the He ii  $\lambda$
 $6560 A$ line obtained over four consecutive nights in 2009 and 2010. Each sub-panel displays the rectified line intensity
 $I/I_c$ (bottom), the relative position angle
 $\theta$ (middle), and the relative polarization amplitude
 $\Delta p$ (top). The color coding corresponds to the observing nights, with the associated rotational phases indicated in the bottom panels. Phases were computed assuming
 $P = 3.767$ days, adopting the first night of each observing run as phase zero. As in Harries et al. (Reference Harries, Howarth, Schulte-Ladbeck and Hillier1999), the continuum polarization has been removed to emphasize the line-dependent variations. For all nights of both epochs,
 $\Delta p$ follows a consistent pattern. On the red side of the line,
 $\Delta p$ increases gradually from the red wing toward the line center, consistent with the expected depolarization effect produced by the dilution of the polarized continuum by unpolarized recombination emission. In this region,
 $\theta$ remains constant within uncertainties, as expected when only dilution operates. In contrast, the blue side of the line exhibits sharper variations:
 $\Delta p$ decreases rapidly, and
 $\theta$ displays distinct rotations across the profile. The amplitude of the position-angle change reaches
 $\sim$15–20
 $^{\circ}$ in 2009 and about 10
 $^{\circ}$ in 2010. These variations indicate an additional polarimetric contribution on the approaching side of the wind that cannot be explained by dilution alone. Comparable blue-side variations and hook-shaped loops are also detected in other He ii recombination lines, such as the Pickering transitions, but also in He ii
 $\lambda 4686 A$ and He ii
 $\lambda$
 $8237 A$, as well as in the doublet N v
 $\lambda \lambda 4602-4620 A$ line. The recurrence of this behavior across multiple lines and epochs indicates that the mechanism responsible is not line-specific but reflects a systematic global asymmetry in the wind.
Heii  $\lambda 6560 A$ line of WR6 for our 2009 and 2010 data. Each color corresponds to a different night of observation. The top panels show the relative polarization amplitude
 $\Delta p$ (
 $\%$), with representative 1-
 $\sigma$ uncertainties indicated in the upper right corner. The middle panels show the corresponding polarization position angle
 $\theta$. The dashed horizontal lines mark the mean
 $\theta$ measured in the red wing of the line, and are only drawn where
 $\Delta p \ge 0.1 \%$. The bottom panels show the rectified intensity
 $I/I_c$.

Figure 1 Long description
Panel A: Three line graphs show data from 2009. The top graph plots relative polarization amplitude (Δp %) against wavelength (Å), with different colors representing different nights. The middle graph shows the polarization position angle (θ) against wavelength, with dashed horizontal lines marking the mean θ in the red wing. The bottom graph displays rectified intensity (I/Ic) against wavelength. Panel B: Three line graphs show data from 2010, with the same structure and labels as Panel A. Each graph shows variations across different nights, with colors indicating different observation nights.
3.1. Line-dependent polarization structure
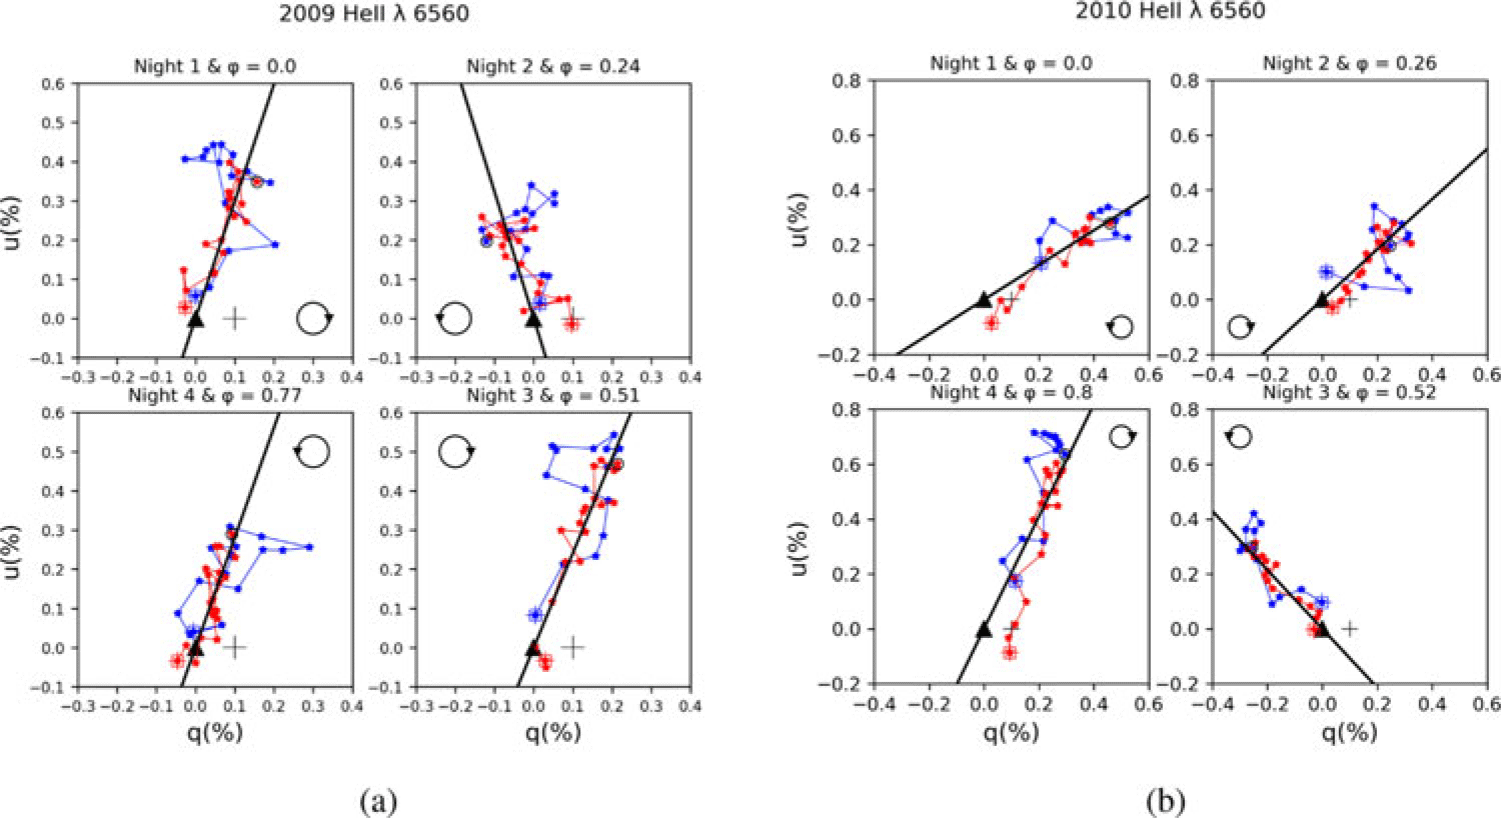
The alternative representation of the same data in the Stokes q–u plane is shown in Figure 2. Data points are color-coded by wavelength, from red (receding velocities) to blue (approaching velocities), with the line center marked by a circled point. This representation highlights the contrasting behavior between the two sides of the line. The red-shifted points, corresponding to constant  $\theta_{\text{red}}$, align along straight lines, whose slope defines
 $\theta_{\text{red}}$ (shown as black lines in figure 2). In contrast, the blue-shifted points deviate from this linear relation and trace closed “hook-shaped” loops, as first reported by Schulte-Ladbeck et al. (Reference Schulte-Ladbeck, Nordsieck and Taylor1991); Schulte-Ladbeck et al. (Reference Schulte-Ladbeck, Nordsieck, Taylor, Bjorkman, Magalhães and Wolff1992).
q-u plot for the four nights of the 2009 Heii  $\lambda 6560 A$ line organized in a clockwise direction. The black lines have been derived from the mean polarization angle of the red part of the lines
 $\theta_{red}$. Typical 1
 $\sigma$ error bars are show as a black cross. A circular arrow indicates the direction of rotation for each night across the line starting by its bluest point.

The observed loops alternate in their sense of rotation from night to night, switching between clockwise and counterclockwise orientations when followed from the bluest to the reddest wavelengths. This systematic alternation reveals a rotating, large-scale structure that modulates the polarized flux as different regions of the wind come into view. A natural explanation is provided by the model of Ignace et al. (Reference Ignace, Bjorkman, Chené, Erba, Fabiani, Moffat, Sincennes and St-Louis2023), in which a CIR sweeps across the visible photosphere, intermittently obscuring the limb polarization. In that framework, the reversal of the loop’s rotation sense occurs as the CIR passes through phase 0, moving from one side of the line of sight to the other. The two successive reversals we detect within each four-night observing run therefore indicate that at least two CIRs are simultaneously present, ensuring continuous modulation across the star’s 3.76-day period, since a single CIR would affect the blue-side polarization only during half of the cycle (Ignace et al. Reference Ignace, Bjorkman, Chené, Erba, Fabiani, Moffat, Sincennes and St-Louis2023).
3.2. Formation radii and diagnostic power
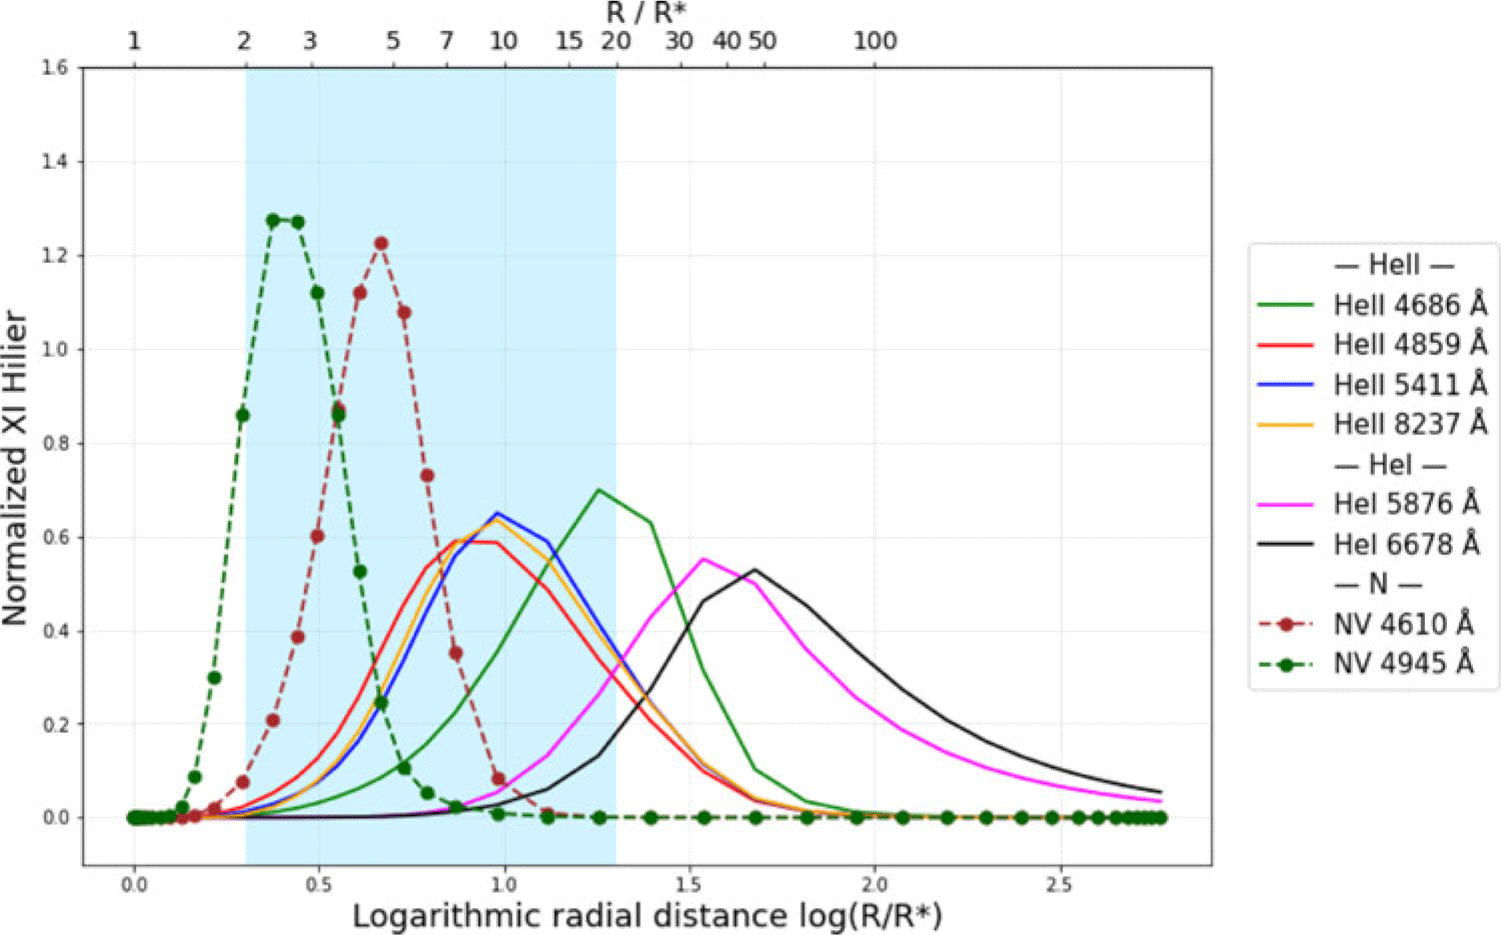
Figure 3 displays the radial emissivity distributions for representative emission lines computed from PoWR models of WR 6. Recombination lines such as He ii and N v form close to the pseudo-photosphere, within the region where CIR-induced occultation can modulate the observed polarization. By contrast, He i lines form farther out in the wind, beyond the CIR-affected zone, while fluorescence–pumped lines such as C iv  $\lambda\lambda$
 $5801-12 A$ and N iv
 $\lambda 7111 A$ follow a different excitation pathway. Their upper levels are populated by UV continuum pumping rather than recombination, leaving the optical transitions optically thin. As they do not absorb polarized continuum photons, these lines remain insensitive to CIR-induced occultation and therefore do not exhibit blue-side polarization signatures. These differences in excitation and opacity explain why blue-side variations and loop patterns occur only in recombination lines, while He i and fluorescence–pumped transitions show only symmetric depolarization. Our analysis of WR 6’s linear spectropolarimetric variability provides new evidence that large-scale, co-rotating structures modulate the wind geometry. The contrasting polarimetric behavior of the red and blue wings of its emission lines reveals two complementary diagnostics. From the red wing, we can recover the intrinsic continuum polarization under the assumption of pure dilution, while the blue wing carries the signature of large-scale structures crossing our line of sight. The alternating orientation of the Q–U loops, observed consistently across all nights, supports a scenario involving at least two CIRs rotating with the star, each periodically obscuring part of the photosphere. In contrast, the absence of blue-side variations in He I and fluorescence lines points to formation regions unaffected by such occultation, either because they are located farther out in the wind or because their excitation mechanism differs fundamentally. Taken together, these results suggest that CIR-induced asymmetries may represent a recurrent phenomenon among early-type WN stars, rather than a peculiarity of WR 6. Continued time-resolved spectropolarimetric monitoring will help determine whether these structures persist, evolve, or reconfigure over time, offering valuable constraints on the rotational and magnetic dynamics that govern massive-star outflows.
Illustration of  $\xi$ (as defined in Hillier et al. (1987)) showing the origin of some of the strongest lines of WR6. The dashed line is Nv
 $\lambda 4945 A$ (7-6) which we can’t investigated. This figure is based on models calculated with the
 $Potsdam Wolf-Rayet$ (PoWR) model atmosphere code.a The blue zone is shown as a indication of the area influenced by CIRs.
 $^{a}$ http://www.astro.physik.uni-potsdam.de/PoWR/

 λ6560A
 Δp
 %
 σ
 θ
 θ
 Δp≥0.1%
 I/Ic
 λ6560A
 θred
 σ
 ξ
 λ4945A
 PotsdamWolf−Rayet
 a

 Open access

