Implications
Daily milk yields of cows decline as pregnancy progresses. By using a test-day model, we revealed that stage of pregnancy did not affect the estimated heritability of daily milk yield. However, 305-day milk yields were decreased in cows with fewer days open, and the rates of reduction associated with decreased days open (⩽90) in the second and third lactations were larger than that in the first lactation. These differences between the effects of stage of pregnancy in the first compared with later lactations should be included when determining the optimal number of days open for lifetime productivity in dairy cows.
Introduction
Pregnancy and calving are indispensable elements of dairy production, but declines in daily milk yield as pregnancy progresses – especially during the late stages of pregnancy – may confound the accurate estimation of breeding values (e.g. Coulon et al., Reference Coulon, Pérochon and Lescourret1995; Leclerc et al., Reference Leclerc, Duclos, Barbat, Druet and Ducrocq2008; Bohmanova et al., Reference Bohmanova, Jamrozik and Miglior2009). In some countries, production traits are adjusted for stage of pregnancy as an environmental effect by using current days open (DO; days from calving to pregnancy) or days pregnant (DP) in genetic evaluations (Interbull, 2015). Environmental effects can be incorporated into estimates of production traits by including the effect in a genetic evaluation model or by pre-adjusting the records for the effects. However, although pre-adjustment may reduce the calculation time needed for genetic evaluation (Leclerc et al., Reference Leclerc, Duclos, Barbat, Druet and Ducrocq2008), it is theoretically recommended to include all effects in the evaluation model by Interbull (2001).
Test-day (TD) models are considered more accurate than a lactation model in accounting for the environmental variation associated with lactation (e.g. Jamrozik et al., Reference Jamrozik, Schaeffer and Dekkers1997; Jensen, Reference Jensen2001). TD models are used in many countries (Interbull, 2015), but few studies (Loker et al., Reference Loker, Miglior, Bohmanova, Schaeffer, Jamrozik and Kistemaker2009) have examined the effects of stage of pregnancy on TD milk yields in variance component estimates. Loker et al. (Reference Loker, Miglior, Bohmanova, Schaeffer, Jamrozik and Kistemaker2009) reported that the average heritabilities for daily yields estimated by using a random-regression TD model with TD records that were pre-adjusted for stage of pregnancy were similar to those estimated by using unadjusted records. However, variance components for daily milk yields have not yet been estimated by using a TD model that includes the effect of the stage of pregnancy. The magnitude of the effect of stage of pregnancy on variance components with days in milk (DIM) might differ under various conditions. For example, the effects of early pregnancy on milk yield may be greater in late, rather than in early, lactation.
An increasingly negative effect of stage of pregnancy on daily milk yield as pregnancy progresses means that decreasing the number of DO decreases late-stage daily milk yields and, consequently, total yield during the current lactation. For example, simulation studies assessing the economically optimal breeding and replacement decision (De Vries, Reference De Vries2006) or optimal length of the voluntary waiting period (i.e. days from calving to breeding; Inchaisri et al., Reference Inchaisri, Jorritsma, Vos, van der Weijden and Hogeveen2011) have assumed that the stage of pregnancy has a negative effect on milk yield. However, these effects were evaluated without consideration of lactation number, and the magnitude of the effect of stage of pregnancy on milk yields differs between the first and subsequent lactations (Coulon et al., Reference Coulon, Pérochon and Lescourret1995; Brotherstone et al., Reference Brotherstone, Thompson and White2004; Leclerc et al., Reference Leclerc, Duclos, Barbat, Druet and Ducrocq2008). Precisely predicting the effect of stage of pregnancy on daily and 305-day milk yields in the first and later lactations could help to reveal the optimal DO for each lactation to maximize lifetime productivity.
Therefore, our objective here was to investigate effects of the stage of pregnancy on variance component estimates, daily milk yields and 305-day milk yield during the first three lactations of Japanese Holstein cows by using a TD model.
Material and methods
Data
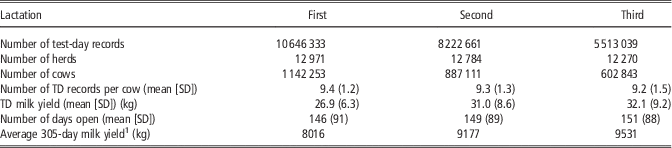
Monthly TD milk records through 305 DIM and calving records during the first three lactations of Holstein cows that had calved from 2000 until 2012 were collected through the Dairy Herd Improvement Program of Japan. Only the milk records of cows for which a lactation length of more than 280 days, at least one TD record and subsequent calving could be confirmed were used for analysis. The reasons for the unknown pregnancy status of cows may have included sale, movement across herds and involuntary culling due to accidents or health disorders. In using the TD records, we could not clarify the reasons why the status of these cows could not be confirmed, so these cows were excluded from the analysis. The minimum size of the contemporary group (herd–TD–milking frequency) was two TD records for each data set. A gestation length of 280 days was assumed and DO was defined as calving interval minus gestation length. The numbers of records and cows and summary statistics of each data set are shown in Table 1. The pedigree data represented 1 717 982 animals for the first lactation; 1 427 943 animals for the second; and 1 074 257 animals for the third, with each data set representing at least three generations.
Numbers of test-day (TD) records, herds, cows and TD records per cow and summary statistics for the first three lactations

1 The average 305-day milk yield of each lactation was estimated by using the regression coefficients of TD milk yield fitted to the subset data used to estimate the variance components.
Models
The data were analyzed within each lactation by using three single-trait random-regression animal models: one model that did not account for the effect of the stage of pregnancy and two models that did. The effects for TD milk record that were common to all models (common) were as follows:
 $$\eqalignno{ common_{{ijkl}} &\,{\equals}\,HTD_{i} {\plus}\mathop{\sum}\limits_{m\,{\equals}\,0}^5 {b_{{jm}} } w(t)_{{klm}} \cr &{\plus}\mathop{\sum}\limits_{n\,{\equals}\,0}^3 {u_{{kn}} z(t)_{{kln}} } {\plus}\mathop{\sum}\limits_{n\,{\equals}\,0}^3 {p_{{kn}} z(t)_{{kln}} } ,$$
where HTD i is the fixed herd–TD–milking frequency effect i (the levels were 1 159 719 for the first lactation, 1 107 672 for the second and 975 815 for the third); b jm is the mth fixed regression coefficient specific to subclass j of the region (two levels) – calendar month – age group at calving (the levels were 540 for the first lactation, 324 for the second and 216 for the third); u kn and p kn are nth random regression coefficients specific to cow k for additive genetic and permanent environmental effects, respectively; and w(t) kln and z(t) kln are covariates for fixed and random regressions, respectively, associated with DIM t for TD record l of cow k (t kl ). The age groups were 18 to 20, 21 to 22, 23, 24, … 33, 34 and 35 months for the first lactation; ⩽35, 36 to 37, 38 to 39, 40 to 41, 42 to 43, 44 to 45, 46 to 47 and 48 to 49 months for the second lactation; and ⩽45, 46 to 50, 51 to 55, 56 to 60, 61 to 65 and 66 to 83 months for the third lactation. The covariates of fixed regression are fourth-order Legendre polynomials (Kistemaker, Reference Kistemaker2003) with the exponential term of the Wilmink function (e kt ), which used a value of –0.05 for k (Wilmink, Reference Wilmink1987; Schaeffer et al., Reference Schaeffer, Jamrozik, Kistemaker and Van Doormaal2000). These covariates are used in dairy sire and cow evaluation model in Japan (Yamazaki et al., Reference Yamazaki, Hagiya, Takeda, Sasaki, Yamaguchi, Sogabe, Saito, Nakagawa, Togashi, Suzuki and Nagamine2013; Hagiya et al., Reference Hagiya, Yamazaki, Nagamine, Togashi, Yamaguchi, Gotoh, Kawahara, Masuda and Suzuki2014). The covariates of the random-regression animal and environmental effects are third-order Legendre polynomials (Jakobsen et al., Reference Jakobsen, Madsen, Jensen, Pedersen, Christensen and Sorensen2002; Togashi et al., Reference Togashi, Lin, Atagi, Hagiya, Sato and Nakanishi2008; Yamazaki et al., Reference Yamazaki, Hagiya, Takeda, Sasaki, Yamaguchi, Sogabe, Saito, Nakagawa, Togashi, Suzuki and Nagamine2013).
The general model (G model), which did not account for the effect of stage of pregnancy, was
 $$y_{{ijkl}} \,{\rm {\equals}}\,common_{{ijkl}} {\plus}e_{{ijkl}} ,$$
where y ijkl is the TD milk record l of cow k and e ijkl is a random residual effect associated with y ijkl .
The DP and DO models accounted for the stage of pregnancy. The DP model includes the covariates for fixed regression associated with DP and the DO model includes the covariates for fixed regressions specific to each DO class associated with DIM (Bohmanova et al., Reference Bohmanova, Jamrozik and Miglior2009). The DP model was
 $$y_{{ijkl}} {\rm \,{\equals}}\,common_{{ijkl}} {\plus}\mathop{\sum}\limits_{q\,{\equals}\,1}^3 {\pi _{q} } (d_{{kl}} )^{q} {\plus}e_{{ijkl}} ,$$
where
 $$\pi _{q} $$
is the qth fixed regression coefficient of DP (d) on TD milk record (q=1 to 3); and d
kl
is DP for TD record l of cow k, which is calculated as the difference between t
kl
and DO of cow k (DO
k
) when t
kl
>DO
k
; otherwise d
kl
=0.
The DO model was
 $$y_{{ijklr}} {\rm \,{\equals}}\,commom_{{ijkl}} {\plus}\mathop{\sum}\limits_{m\,{\equals}\,0}^5 {\varphi _{{rm}} } w(t)_{{klm}} {\plus}e_{{ijklr}} ,$$
where
 $$\varphi _{{rm}} $$
is the mth fixed regression coefficient specific to DO class r with eight levels (Bohmanova et al., Reference Bohmanova, Jamrozik and Miglior2009: ⩽60 [DO⩽60], 61 to 90 [DO61 to 90], 91 to 120 [DO91 to 120], 121 to 150 [DO121 to 150], 151 to 180 [DO151 to 180], 181 to 210 [DO181 to 210], 211 to 240 [DO211 to 240] and ≥241 [DO⩾241] days) and w(t)
klm
is defined as earlier.
The covariance structure was defined as
 $${\mathop{\rm var}} \left[ {\matrix{ {\bf u} \cr {\bf p} \cr {\bf e} \cr } } \right]{\equals}\left[ {\matrix{ {{\bf G}\,\otimes\,{\bf A}} & {\bf 0} & {\bf 0} \cr {\bf 0} & {{\bf P}\,\otimes\,{\bf I}} & {\bf 0} \cr {\bf 0} & {\bf 0} & {\bf R} \cr } } \right],$$
where G and P are the 4×4 additive genetic and permanent environmental (co)variance matrices, respectively, of random-regression coefficients;
 $$\,\otimes\,$$
is the Kronecker product; A is the additive genetic relationship for animals; l is the identity matrix for cows; and R is a diagonal matrix of residual variance specific to a particular DIM interval for each record. These intervals were defined as 5 to 45, 46 to 115, 116 to 205 and 206 to 305 DIM (Miglior et al., Reference Miglior, Sewalem, Jamrozik, Bohmanova, Lefebvre and Moore2007; Yamazaki et al., Reference Yamazaki, Hagiya, Takeda, Sasaki, Yamaguchi, Sogabe, Saito, Nakagawa, Togashi, Suzuki and Nagamine2013). Variance components were estimated by using subsets that consisted of the records for herds that were sampled (~10%) randomly from the complete herds for each lactation. The subset for the first lactation consisted of records for 103 150 cows; for the second lactation, 80 259 cows; and the third, 54 927 cows. The GIBBS3F90 program (Misztal, Reference Misztal2008) was used for Gibbs sampling to estimate the variance components. For Gibbs sampling, the first 50 000 samples were discarded as burn-in. The subsequent 50 000 samples were saved to calculate posterior means and standard deviations for (co)variance components. The convergence was verified through the inspection of graphical data by using the postgibbsf90 program (Misztal, Reference Misztal2008).
Prediction of pregnancy effect
Solutions for the fixed effects of stage of pregnancy were obtained by using the BLUPF90 program (Misztal et al., Reference Misztal, Tsuruta, Strabel, Auvray, Druet and Lee2002), which uses the preconditioned conjugate gradient algorithm with iteration on data. The variance components estimated by the G model were used for solving the effects. Daily milk yields from 5 to 305 DIM and 305-day milk yields for different DO classes were calculated by using the solutions of fixed regression coefficients in the DO model. For example, daily milk yield of DIM t in the DO class
 $$r(\hat{y}_{{r(t)}} )$$
was calculated as
 $$\hat{y}_{{r(t)}} {\equals}\mathop{\sum}\limits_{m\,{\equals}\,0}^5 {(\hat{\varphi }_{{rm}} \,{\minus}\,\hat{\varphi }_{{{\bf DO}151{\minus}180m}} {\plus}\varphi _{{0m}} )w(t)_{m} } ,$$
where
 $$\hat{\varphi }_{{rm}} $$
and
 $$\hat{\varphi }_{{{\bf DO}151{\minus}180m}} $$
are the solutions of the regression coefficient for DO class r and DO151 to 180, respectively, and
 $$\varphi _{{0m}} $$
is the regression coefficient on TD milk yield fitted to the subset data as just described. We set the solutions of DO151 to 180 as the base value, because the average DOs in our current results (Table 1) and those of Yamazaki et al. (Reference Yamazaki, Hagiya, Takeda, Yamaguchi, Osawa and Nagamine2014) were ~150 days. The empirical standard errors, which were defined as the standard deviation of estimates from several samples, for each predicted values were calculated by using the solutions of 10 divided subsets (Suzuki and Van Vleck, Reference Suzuki and Van Vleck1994).
Results and discussion
Variance component estimates
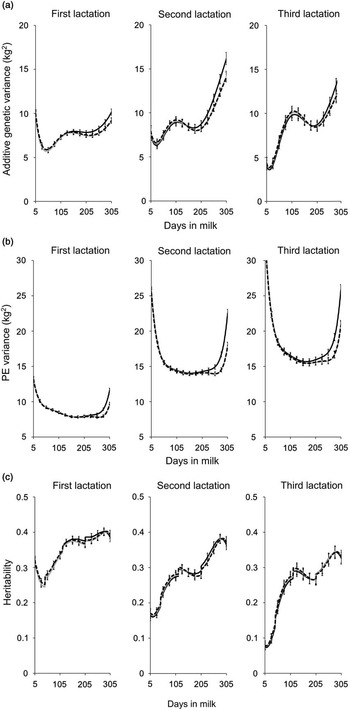
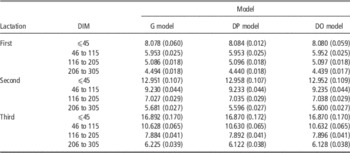
Heritability estimates of daily milk yield at the same DIM did not differ among the G, DP and DO models during the first three lactations; however, the additive genetic and permanent environmental (PE) variances in the late stage of lactations, as estimated by using the DP and DO models (which accounted for the stage of pregnancy effect), were significantly (P<0.05) smaller than those by the G model, which did not incorporate the effect of stage of pregnancy (Figure 1). The variance component estimates were similar between the DP and DO models. The additive genetic variances for the DP and DO models were significantly smaller (P<0.05) than those for the G model at the same DIM after 290 and 258 days, respectively, for the first lactation and 258 and 267 days for the second, according to paired Student’s t-tests. In the third lactation, the results showed the same tendency as those for the first two lactations, but the values for the DP and DO models did not differ from those for the G model. The PE variances for the DP and DO models were significantly (P<0.05) smaller than those for the G model after 253 and 255 days, respectively, for the first lactation; after 248 days for both models for the second lactation; and after 256 and 251 days for the third lactation. The DP and DO models yielded the same residual variances (Table 2). These values for the interval from 206 to 305 DIM were slightly (albeit non-significantly) smaller than those for the G model. In contrast, heritability estimates of daily milk yield at the same DIM did not differ significantly among these three models for all three lactations. These heritability estimates are in line with previous estimates in Japan (Hagiya, Reference Hagiya2010; Hagiya et al., Reference Hagiya, Terawaki, Yamazaki, Nagamine, Itoh, Yamaguchi, Abe, Gotoh, Kawahara, Masuda and Suzuki2013). Our current results indicate that the total variance of random effects (i.e. the sum of the additive genetic, PE and residual variances) for daily milk yield estimated by using a TD model decrease during late lactation when the effect of stage of pregnancy is included in the model. However, there is little need to adjust for the effect of stage of pregnancy when genetic parameters are estimated, because heritability estimates of daily milk yield do not change, regardless of whether the stage of pregnancy effect is included in a TD model.
Posterior means and standard deviations of additive genetic variance (a), permanent environmental (PE) variance (b) and heritability (c) of daily milk yield in the first three lactations of Holstein dairy cows, as estimated by using three different models: the general model (solid black line), which does not account for the pregnancy effect; the days-pregnant model (dotted line), which includes the number of days pregnant to account for the effect of stage of pregnancy; and the days-open model (solid gray line), which includes the days-open class to account for the pregnancy effect.

Posterior means (standard deviations) of residual variance of daily milk yield in the first three lactations of Holstein dairy cows, as estimated by using three different models: the general model (G model), which does not account for the pregnancy effect; the days-pregnant model (DP model), which includes the number of days pregnant to account for the pregnancy effect; and the days-open model (DO model), which includes the days-open class to account for the pregnancy effect

Effect of stage of pregnancy on dairy milk yield
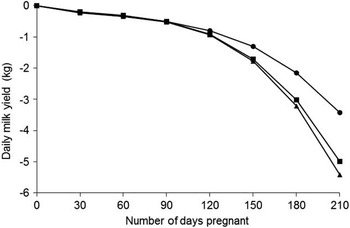
The effects of stage of pregnancy on daily milk yield in the second and third lactations were significantly (P<0.05) larger than those in the first lactation in late stage of pregnancy (Figure 2). The empirical standard errors for the DP effect on daily milk yield ranged from 0.011 to 0.106 kg. The DP effect on daily milk yield, calculated from the regression of DP on TD milk yield, was <1.0 kg in absolute value until 120 DP among all lactations. Thereafter, the effect of DP increased as pregnancy progressed; for example, the effects at 210 DP in the first, second and third lactations were –3.5, –5.1 and –5.5 kg, respectively. These results are in line with those of other studies (Coulon et al., Reference Coulon, Pérochon and Lescourret1995; Leclerc et al., Reference Leclerc, Duclos, Barbat, Druet and Ducrocq2008; Bohmanova et al., Reference Bohmanova, Jamrozik and Miglior2009). In particular, the differences in the current study between the effects of stage of pregnancy in the first, compared with the second or third, lactation were similar to the results of Leclerc et al. (Reference Leclerc, Duclos, Barbat, Druet and Ducrocq2008).
Daily milk yield trend from 0 to 210 days pregnant for the first three lactations (circles, first lactation; squares, second lactation; triangles, third lactation), as estimated by using the days-pregnant model, which includes the number of days pregnant to account for the effect of stage of pregnancy.

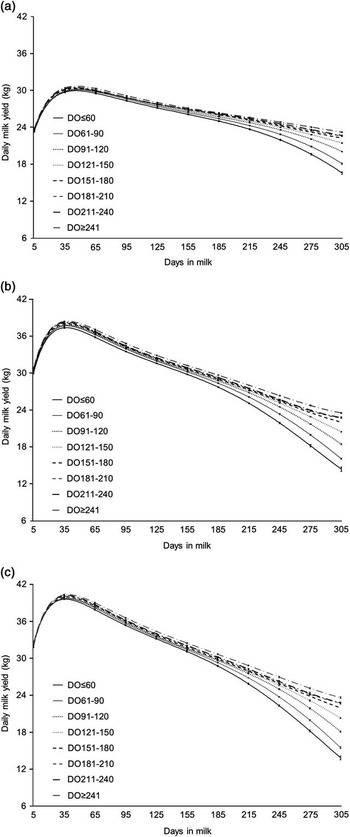
Predicted daily milk yields in the first three lactations in the context of diminished DO declined during late lactation and the yields seemed to drop more rapidly during the second and third lactations than during the first (Figure 3). For example, the differences between the daily milk yields at 270 DIM for DO121 to 150, DO91 to 120, DO61 to 90 and DO⩽60 classes and that for the DO151 to 180 class were –0.3 –1.0, –2.1 and –3.3 kg in the first lactation, respectively; –0.6, –1.7, –3.3 and –5.0 kg in the second lactation; and –0.6, –1.7, –3.6 and –5.3 kg in the third lactation. Daily milk yields were similar among the DO151 to 180, DO181 to 210 and DO211 to 240 classes within each lactation. These differences in dairy milk yield between DO classes were consistent with the findings of Brotherstone et al. (Reference Brotherstone, Thompson and White2004).
Daily milk yields and empirical standard errors from 5 to 305 days in milk for the various days-open (DO) classes for the first (a), second (b) and third (c) lactations, as estimated by using the DO model, which includes the days-open class to account for the pregnancy effect. The empirical standard errors are calculated by using the solutions for 10 divided subsets.

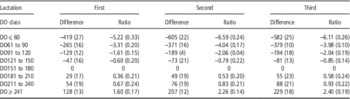
The differences between the predicted 305-day milk yield for each DO class and that for the DO151 to 180 class within each lactation, and the ratio of that difference to the average 305-day milk yield (Table 1) are shown in Table 3. For each lactation, the predicted 305-day milk yield was highest (P<0.05) for the DO⩾241 class and the value dropped as DO decreased. The differences of the predicted 305-day milk yield among DO151 to 180, DO181 to 210 and DO211 to 240 class were relatively small in each lactation, similar to our current results regarding daily milk yields (Figure 3). For the DO classes corresponding to up to 90 days of DO in the first lactation and 120 days in the second and third lactations, the differences between the predicted 305-day milk yield and that of the next longer DO class were less than –100 kg. For the DO⩽60 and DO61 to 90 classes in the second and third lactations, the absolute values of the difference between the predicted 305-day milk yield and that for the DO151 to 180 class, as a ratio of the average 305-day milk yield, were significantly (P<0.05) larger than those in the first lactation. These results suggest that cows that conceive fewer than 90 days after the second or third calving incur greater production losses than those that conceive similarly after the first calving.
Differences (empirical standard errorsFootnote 1 ) between the predicted 305-day milk yields (kg) for the various days-open (DO) classes and that for the DO151 to 180 class, as well as ratios (%, empirical standard errors) of this difference to the average 305-day milk yieldFootnote 2 , during the first three lactations, as estimated by using the DO modelFootnote 3

1 Empirical standard errors were calculated by using the solutions for 10 divided subsets.
2 The average 305-day milk yield of each lactation is shown in Table 1.
3 The DO model includes the days-open class to account for the pregnancy effect.
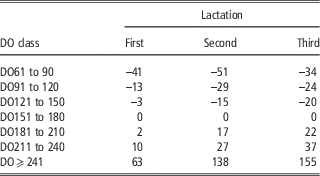
The DO model is able to estimate the different effects of stage of pregnancy for each DO class by applying a separate lactation curve, although the DP model assumes that the effect of stage of pregnancy is independent of stage of lactation. The effects of the stage of pregnancy estimated by the DO model could also be affected by other factors besides stage of pregnancy. We compared the differences in the predicted 305-day milk yield for the various DO classes between the results obtained by using the DO model and the DP model (Table 4); the predictions for the DO⩾241 class were higher when the DP model was used. Some cows in the DO⩾241 class might be donor cows for embryo transfer and donor cows are generally elite cows that are intensively selected for production traits (König et al., Reference König, Bosselmann, von Borstel and Simianer2007). The predictions for the DO61 to 90 class from the DO model were slightly lower than that from the DP model. These differences reflect the antagonistic genetic relationship between milk production and fertility in cows (Hagiya et al., Reference Hagiya, Terawaki, Yamazaki, Nagamine, Itoh, Yamaguchi, Abe, Gotoh, Kawahara, Masuda and Suzuki2013; Yamazaki et al., Reference Yamazaki, Hagiya, Takeda, Yamaguchi, Osawa and Nagamine2014) or the management practice of letting the milk yield decrease for drying off. In summary, the results from the DO model might reflect a complex interaction among lactation, pregnancy stage, milk production ability and management practices.
Differences (kg) between predicted 305-day milk yields estimated by using the days-open (DO) modelFootnote 1 (shown in Table 3) and that obtained by using the days-pregnant (DP) modelFootnote 2 , Footnote 3 for the various DO classes

1 The DO model includes the days-open class to account for the pregnancy effect.
2 The DP model includes the number of days pregnant to account for the effect of stage of pregnancy.
3 The 305-day milk yield obtained by using the DP model less that for the DO151 to 180 class was calculated by accumulating the effects of days pregnant on daily milk yield (Figure 2) during the stage of pregnancy defined as 305 minus the median DO for each DO class. The values for the DO⩽60 class could not be calculated accurately because the number of days pregnant within 305 DIM were too long; those for the DO⩾241 class were set as zero.
In conclusion, the heritability estimates of daily milk yield did not change regardless of whether the TD model accounted for the effect of stage of pregnancy; however, the additive genetic and PE variances during late lactation decreased when the effect of stage of pregnancy was included. The effects of early pregnancy on milk yield in later lactations were larger than those in the first lactation; the rates of reduction of the 305-day milk yield for cows that conceive up to 90 days after the second or third calvings were larger than that after the first calving. These differences between the negative effects of early pregnancy in the first, compared with later, lactations should be included when determining the optimal number of DO to maximize lifetime productivity in dairy cows.
Acknowledgments
This work was supported by a grant from the Ministry of Agriculture, Forestry and Fisheries of Japan (Development of Breeding Technology for Animal Life Production).