




No CrossRef data available.
Article contents
Florida Cognitive Activities Scale: Initial development and validation
Published online by Cambridge University Press: 28 January 2005
Abstract
We used a rational-empirical approach in the construction and validation of a cognitive activity scale for use with elderly populations. The scale development effort produced a 25-item scale with a reasonably high level of internal consistency in a sample of 200 elderly individuals. Scale scores were positively correlated with years of education and measures of various domains of cognitive ability. In a separate cross-validation sample, a similar pattern of reliability and validity coefficients was obtained. The full scale score was found to contribute significantly to the prediction of cognitive ability after controlling for the effects of age, education, and gender. Two subscales (Higher Cognitive Abilities and Frequent Cognitive Abilities) and a measure of self-reported maintenance of cognitive activity were also developed. In a separate study, the maintenance score was found to differ significantly between the validation sample and a sample of individuals with a history of neurological disorder, with a moderate effect size (d approximately = .7). Further cross-validation studies in minority groups and groups of varying socioeconomic status will be critical in establishing the research and clinical value of the scale and subscales. (JINS, 2005, 11, 108–116.)
Information
- Type
- Research Article
- Information
- Journal of the International Neuropsychological Society , Volume 11 , Issue 1 , January 2005 , pp. 108 - 116
- Copyright
- © 2005 The International Neuropsychological Society
INTRODUCTION
In the past decade, many factors have been identified for the development of Alzheimer's disease and for the rate of cognitive decline with aging (Borenstein, 2004). One putative protective factor is the lifestyle characteristic variously referred to as engagement, mental activity level, or challenge (herein referred to as cognitive activity). There are numerous proponents who extol the value of cognitive activity as a protective factor (e.g., Restak, 1997; Rowe & Kahn, 1998). However, the state of the collective research is inconsistent in demonstrating that stimulation provided by everyday cognitive and social activities facilitates the maintenance of cognitive skills in a manner analogous to physical exercise for musculoskeletal and cardiovascular functions (Salthouse et al., 2002). Several authors (e.g., Aartsen et al., 2002; Hultsch et al., 1999; Pushkar et al., 1999) have commented on the methodological difficulties in conducting studies that would meet the requirements of a convincing argument for a protective effect of activity on cognition (Salthouse et al., 2002). These requirements include demonstration of : (1) a negative relationship between age and level of activity, (2) a positive association between level of activity and level of cognition, and (3) an interaction between age and level of activity in the prediction of cognitive level (showing that activity level attenuates the impact of aging on cognition). Because cognitive decline can have an impact on activity level, we would also note that a substantial period of prospective observation is necessary in studies to establish a causative effect of activity level on cognition.
At a basic methodological level, the issue of the measurement of activity is critical. Studies to date have used a variety of measures of “stimulating” activities, including leisure (e.g., Schooler & Mulatu, 2001), physical (e.g., Richards et al., 2003), cognitive (e.g., Wilson et al., 1999), social (e.g., Bukov et al., 2002), and multiple domains (e.g., Aartsen et al., 2002; Hultsch et al., 1999; Menec, 2003). Many of these scales have heterogeneous content (e.g., Bosma et al., 2002); that is, they include items from multiple domains of activity such as physical, social, leisure, and cognitive. In several studies, items were sorted into conceptually similar categories, but not subjected to formal statistical item analyses or other empirical tests. Although all activities have a component of mental activity, activities that are more intensely cognitive have been suggested as having greater potential to serve as protective elements (Wilson et al., 1999). The best-developed cognitive activity scale to date is that of Wilson et al. (1999), which consists of seven items, including activities such as reading books and visiting museums, rated on a five-point frequency scale ranging from every day to once a year. Results from their scale development effort show that the amount and type of cognitive activity was associated with demographic variables, such as age, education and gender. After partialling out the influence of these demographic variables, however, the cognitive activity score continued to be related to performance on cognitive tasks (Wilson et al., 1999). In subsequent studies using this measure of cognitive activities, Wilson et al. (2002, 2003) reported that higher cognitive activity scores were associated with a reduced risk of Alzheimer's disease and were correlated with perceptual speed, visuospatial ability, and semantic memory, but not with episodic or working memory.
However, several shortcomings of the Wilson et al. scale can be noted. One of the items (visiting museums) is likely to have an extremely low response frequency in most populations, but especially in those without access to museums. This item would thus likely contribute little to reliable measurement of individual differences. Because of the narrow focus of the item content for four items (all of which assess reading activities), skewed total activity score distributions may be expected in samples differing from the development sample in level of education. Additionally, the brevity of the scale (seven items), while convenient for large population-based studies, limits scale reliability and validity. Wilson et al. do not report reliability estimates for the seven-item scale.
The purpose of the present research was to develop a cognitive activity scale that would serve as a reliable and valid measure for use in research on aging populations and, potentially, in clinical applications. Our approach relied primarily on the rational-empirical method, in which rational constructs serve as the basis for development of item pools and empirical methods are used to evaluate item and scale quality (see Morey, 1991). Ideally, a cognitive activity scale would capture intensity, frequency, and duration information on a broad list of cognitive activities differing in cognitive demand. However, several issues were identified at the outset as creating special problems in terms of scale development:
- Many activities that would appear to be good candidate items are likely to have unsatisfactory response distributions. For example, many high-intensity cognitive activities have low population base rates (e.g., writing poetry, learning a new language, solving mathematical puzzles) or require special circumstances for engagement (e.g., visiting a museum, attending a play). Endorsement rates for frequency of engagement for such activities would be expected to be very low. While one or two such items may contribute to scale discriminability in the highest range of scores, items with highly skewed response distributions limit estimates of scale internal consistency reliability.
- The same item may have different “meaning” across individuals. Two individuals may spend an equal amount of time watching TV, but the cognitive demand for one may be greater because of a focus on educational programs and quiz shows. Additionally, cognitive engagement can vary across individuals for the same TV program. One individual may be a passive viewer of drama, while another may carefully analyze acting styles and plot development.
- Intensity of a specific cognitive activity can vary across time for the same individual. For example, changes in reading habits with age may substitute low demand material (e.g., popular magazines) for formerly higher ones (e.g., professional journals, science magazines).
- Changes in life situations frequently produce changes in the pattern and intensity of cognitive activity. Because cognitive activities may require financial resources (i.e., money for supplies or equipment), any number of changes in life situation (e.g., divorce, retirement, moving to a rural community, changing jobs) may influence the frequency and duration of activities such as woodworking or painting.
- There are few activities that would be considered to be purely cognitive. Examples might include solving mathematical or crossword puzzles, astronomy, or creative writing. The vast majority of cognitive activities also have social, leisure, or physical elements. There is no question that bridge is a game of relatively high cognitive demand, yet it is also a social game (and for many, the social aspect may be paramount). Conversely, many social and physical activities have cognitive elements. Even the act of taking a walk in a familiar neighborhood can involve surveillance of changes in landscape, a tabulation of visitors to neighbors' homes, and house improvements in progress. Thus, the creation of cognitive activity item pool varying in cognitive demand will almost of necessity contain items varying in several other dimensions that characterize human activities. Scales developed from such item pools would be likely to be labeled heterogeneous when subjected to factor analysis.
- The size of inter-item correlations for a pool of cognitive activity items will be limited by the fact that time constraints limit the number of activities that an individual can accomplish in any given time period; that is, participation in one activity limits the number of other activities that an individual could do in any given time frame. For example, individuals participating in activities such as art work would have less time available for reading. This time limitation constrains the size of the inter-item correlations and reduces internal consistency reliability (alpha).
Because of these issues, we anticipated that the scale development effort would produce a scale with weaker psychometric characteristics (i.e., lower corrected item-total scale correlations and alpha coefficients) than is typically the case in the development of a scale such as a depression inventory, in which construct saturation can be more readily achieved. Additionally, we expected that the scale would be quite heterogeneous when subjected to factor analysis because of the necessity of selecting higher base rate items reflecting several dimensions of human activity (e.g., cognitive, social, physical). Finally, to achieve moderately acceptable psychometric characteristics by traditional standards, we expected the scale construction effort to produce a relatively long scale. This limitation excluded the possibility of capturing detailed information on the cognitive demand characteristics (e.g., nature of reading material), frequency, and duration of cognitive activities (e.g., frequency and duration of reading) because of the response burden to elderly individuals. A simple Likert-type response option appeared to be the solution.
In this paper, we describe the results of three studies on the development and validation of a cognitive activities scale that focused on (1) item selection and scale development, (2) psychometric characteristics in an independent sample, and (3) validation in a sample of individuals with a history of neurological disorders or injury.
STUDY 1
Method
Participants
Participants for this study were drawn from a larger pool of Caucasian individuals in the Charlotte County Healthy Aging Study (CCHAS). CCHAS is a community study of older adults, ages 60–84 years, living independently, and residing in Charlotte County, Florida. Information was obtained by structured interview and self-report questionnaires on demographic variables, lifestyle, diet, exercise, activities, psychological state and personality, social support, and personal and family medical history. Participants also completed a battery of neuropsychological tests. All interviews and neuropsychological measures were administered by trained technicians. More detailed information regarding CCHAS participant selection and data collection is provided in Small et al. (2000). Data from a parallel study of minority individuals will be published separately.
Exploratory data analyses were conducted to identify participants with missing or inconsistent demographic data, missing or outlying scores in the distributions for neuropsychological tests, and missing cognitive activities items (see below). Data for 39 participants were dropped from the data set as a result of these analyses (4 for missing or inconsistent data, 14 for missing neuropsychological test data or outlying scores, and 21 for missing 1 or 2 cognitive activities items). Individuals who were dropped from the analyses had approximately one less year of education than those who were included, but otherwise the two groups did not significantly differ on demographic characteristics. Also identified were 40 individuals who reported a history of neurological disorder or injury. These 40 individuals were excluded from participation in Study 1. From the remaining pool of 387 participants, we randomly selected 100 males and 100 females to serve as the scale development (DEV) sample. Demographic characteristics of the DEV sample are provided in Table 1.
Demographic characteristics and scores for neuropsychological, depression, and cognitive activity measures

Cognitive activity items
Thirty-four items tapping activities of different levels of cognitive effort (e.g., watching TV vs. solving a crossword puzzle) were written by two of the authors (JAM and ARB) to serve as the initial item pool. These items also varied in terms of physical exertion (e.g., writing letters vs. gardening), degree of social interaction (e.g., reading vs. visiting friends), and domain of activity (e.g., managing a financial portfolio, cooking familiar recipes). A six-point frequency response option was used, which required participants to respond to several choices reflecting an increasing frequency of engagement (e.g., never did this activity, have not done this activity in the past year, do this activity every day).
Correlational measures
Several external correlates were available for use in item selection and initial scale validation. These included age, years of formal education, a measure of depression, personality measures, and neuropsychological measures of general cognitive ability, executive function, and memory. The 15-item version of the Geriatric Depression Scale (GDS; Yesavage et al., 1983) was used as a measure of depression. General cognitive ability was measured by the Modified Mini-Mental Status Exam (3MS; Teng & Chui, 1987), a modified and expanded version of the Mini Mental Status Exam (Folstein et al., 1975). Executive functioning was measured by the number of correct responses on the Color-Word trial of the Stroop Test (Color-word; Golden, 1978) and Trails B time to completion from the Trail Making Test (Trails B; Reitan, 1958). Memory was assessed by the Hopkins Verbal Learning Test–Revised (HVLT-R; Benedict et al., 1998), a list learning task in which subjects are presented with three learning trials, followed by delayed recall, cued recall, and a recognition trial. Because of a ceiling effect, the distribution of scores for the recognition trial was highly skewed. Therefore we elected to use the sum of recalled items for trials 1–3 and delayed recall as primary measures of memory. A composite cognitive z score was also used in item selection procedures. This score was calculated as the average z score for the HVLT-R, Stroop, and Trail Making Test scores.
Procedure
In selecting items, we examined classic item analysis metrics: item means, corrected item-scale correlations, item-squared multiple correlations, scale means and variances, and alpha reliability coefficients (Clark & Watson, 1995; Morey, 1991). However, in contrast to item selection and scale development methods in personality and behavior, we placed a stronger emphasis on the distributions of item scores than on item intercorrelations, because of constraints on the size of the inter-item correlation produced by construct impurity and participatory time constraint limitations described above. Additionally, although items with high item means are typically of little value in developing a scale, a decline in frequency of a highly frequent activity might be significant in predicting subsequent changes in cognition or behavior. We therefore focused our examination of item distributions more critically on those items that were infrequently endorsed. The discriminant and convergent validity of the full scale resulting from the item analyses were examined by calculation of correlations with demographic variables and neuropsychological measures. We expected moderate (.20 to .40) correlations of the cognitive activity scale with neuropsychological test scores and education. We also expected small (negative) correlations for the scale with age because of the restricted age range. We also examined correlations with a measure of depression, because the common symptoms of depression include loss of interest and lethargy. We expected correlations for the scale with the depression measure to be in the range of −.15 to −.30, based on studies of the impact of depression on cognitive performance (e.g., Rabbitt et al., 1995).
In the development effort, we also planned to examine possible subscales and scores that might be especially sensitive to changes in health or cognitive status. These included subscales reflecting higher order cognitive activities, frequently endorsed activities, and self-reported maintenance in activity level.
Results
Examination of the item frequency distributions revealed that eight of the 34 activity items had never been performed by over 50% of the sample and/or had not been performed in the past year by 70% of the sample. These items were dropped from consideration. The item intercorrelation matrix revealed two items of similar content (“reading fiction” and “reading nonfiction”) that were highly correlated. These two items were combined and treated as a single item (“reading fiction or nonfiction”) by taking the response indicating the most frequent level of activity in either of the two items individually. Analysis of responses to this remaining set of 25 items revealed that the mean number of activities ever performed was 21.1 (SD = 2.7) and the number of activities currently performed (i.e., at least once in the past year) was 17.1 (SD = 3.1). In order to conduct item analyses, we transformed the response options into a Likert-type scale in which the following scores were applied: “never did this activity” = 0, “have not done this activity in the past year” = 0, “less than once per month” = 1, “1–4 times per month” = 2, “5 or more times per month” = 3, and “every day” = 4.
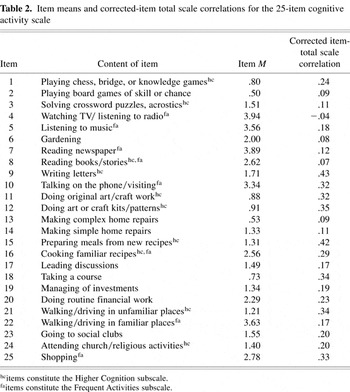
Table 2 presents item means and corrected item-total scale correlations for the set of 25 items. Examination of item characteristics revealed that corrected item-total scale correlations exceeded +.10 for 20 of the 25 items. One of the items had a negative correlation (“watching television,” r = −.04). Overall alpha was .65. Dropping individual items with low corrected item-total scale correlations did not measurably improve scale alpha. Iterative attempts to drop small sets of items on the basis of lower item-total correlations or improvements in overall scale alpha did not improve the reliability of the scale in a meaningful way; instead their removal actually resulted in the reduction of item-total scale correlations for other items. This result suggested that the set of items was, as expected, heterogeneous. A principal components analysis of the 25 items, conducted with Varimax rotation, resulted in the identification of ten factors with eigenvalues greater than 1. Together the ten factors explained only 63% of the variance in item responses. The first factor consisted of four items and accounted for only 13% of the variance in item responses. Seven of the ten factors were identified by only one or two items with loadings greater than .30.
Item means and corrected-item total scale correlations for the 25-item cognitive activity scale

The five items with corrected item-total scale correlations that were less than +.10 were retained because they extended the distribution of item endorsement means. This 25-item Cognitive Activity (CA) scale was found to have a normal distribution (M = 47.8, Mdn = 48.5, SD = 9.5) and a range of scores of 27–72 (possible range 0–100). Examination of the pattern of CA score correlations with age, education, and neuropsychological measures revealed coefficients of the expected size and direction (see Table 3). The correlation of the CA scale with age was negative and small (−.14), and correlations with education and neuropsychological measures ranged from |.19| to |.28|. Approximately 7% of the variance in CA scores was shared by the GDS (r = −.27).
Alpha coefficients and correlations with demographic variables, neuropsychological measures, and depression scores for cognitive activity scores

Two subscales were developed from items in the 25-item cognitive activity scale. Items for the first scale consisted of those having a correlation of +.10 or greater with the composite cognitive measure z score. Item and scale analyses of this 11-item Higher Cognition (HC) scale revealed a single item that did not contribute to alpha reliability. Deletion of this item resulted in a 10-item scale with an alpha of .64, normal distribution (M = 14.9, Mdn = 14.5, SD = 6.3), and a range of scores of 3–30 (possible range 0–40). This scale was also found to be heterogeneous when examined with principal components analysis. The analysis of the ten items produced four factors, each of which was clearly identified by only two items. Not surprisingly, given the items selection strategy, the HC subscale had a pattern of slightly higher correlations with neuropsychological measures than the full CA scale (see Table 3). A small correlation (r = −.18) was obtained for the HC subscale and the GDS score.
A second subscale was developed by selecting items with means equal to or greater than 2.5 (i.e., occurring weekly). This 8-item scale of Frequent Activities (FA) was found to have an alpha of .32, due in large part to the fact that the two items (“watching television,” “reading the newspaper”) had both highly negatively skewed item distributions and small or negative corrected item-total scale correlations. However, all items were retained to produce a measure of the most frequent activities from the full 25-item CA scale. Because of the selection criterion for items, the distribution of FA scores was slightly, but not significantly, skewed (M = 26.3, Mdn = 27.0, SD = 3.1) with a range of scores of 18–32 (possible range 0–32). FA scores had no meaningful correlation with age and a pattern of lower correlations with education and neuropsychological test scores than the CA or HC subscales (see Table 3). The correlation with a measure of depression was small (r = −.15).
Because of its use as a potential indicator of change in health or cognitive status, we also computed a cognitive activity “maintenance” score (AM), a measure of self-reported decrease in activities for the 25-items comprising the CA scale. The AM is a ratio score that is calculated by dividing the number of current activities (i.e., performed in the previous year) by the number of activities ever performed. The distribution of AM scores was normal (M = .82, Mdn = .82, SD = .10) and had a range of scores of .40–1.00 (possible range 0–1.00). The AM score was found to have a small but significant negative correlation with age and no meaningful correlation with education or the 3MS. Small to moderate correlations were found with measures of memory and executive ability (Table 3). The GDS score was correlated with the AM score at a moderate level (r = −.24).
STUDY 2
The second study focused on the examination of the psychometric characteristics and validity correlates of CA, HC, and FA scales, and the AM score in a separate sample.
Method
Participants
Participants for this study were drawn from the same pool of CCHAS individuals as in Study 1. Specifically, the validity (VAL) sample consisted of the 187 individuals (79 males and 108 females) without history of neurological disorder or injury who did not participate in Study 1. Demographic characteristics of the VAL sample are presented in Table 1.
Procedure
We first compared the DEV and VAL samples on demographic (age, education) and cognitive (e.g., 3MS) variables to determine the comparability of the two samples. We then examined descriptive statistics for all scores and calculated internal consistency reliability estimates for the CA, HC, and FA scales. Correlations with age, education, cognitive measures, and a measure of depression were then examined. Finally, we examined the effect of gender on all scores and the association of the CA score to neuropsychological test performance.
Results
Table 1 presents the descriptive statistics for the VAL sample. There were no statistically significant differences between the VAL and DEV groups for age, education, or any cognitive measure (all p > .05). Comparisons of CA, HC, FA, and AM scores (Table 1) between the VAL and DEV samples revealed no significant differences (all p > .05). Reliability analyses produced alpha coefficients for the CA, HC, and FA scales that were similar to those obtained in the DEV sample (Table 3). Table 3 presents correlations between the activity scores and each of the cognitive measures. The pattern of correlations was similar to that obtained with the DEV sample.
There were significant differences between men and women in the VAL sample in years of education (p < .05) and all four of the activity measures (all p < .05). Men had a greater average number of years of education; women had higher scores on all activity measures, with effect sizes ranging from .30 (CA score) to 1.19 (HC score). Despite these differences in score means, the patterns of correlations for men and women were very similar to the pattern found with the DEV sample as a whole and were also very consistent with each other. The only exceptions to this pattern were larger correlations for men for the CA and HC scores with the memory delay measure (.38 and .34, respectively) than for women (.16 and .17, respectively). Multiple linear regression analyses revealed that the CA score contributed significantly to the prediction of each of the neuropsychological measures (for 3MS, p < .05, variance contributed = 1.9%; for other measures, all p < .01, variance contributions 3.4 to 5.2%) after adjustment for age, years of education, and gender.
STUDY 3
The purpose of this study was to evaluate the potential sensitivity of a measure of self-reported change in activity scores to the impact of neurological disorder or injury. Because these participants were still living independently in the community, we assumed that the effect of their disorder or injury on level of cognitive activity was small. Thus, we believed this would be a rigorous test.
Methods
Participants
Participants for this study were drawn from the same pool of CCHAS individuals as in Studies 1 and 2. The NEUR sample consisted of 40 individuals (30 male and 10 female) who reported a history of one or more of the following: endarterectomy, transient ischemic attacks, cerebrovascular accidents, Parkinson's disease, or traumatic brain injury with loss of consciousness and retrograde amnesia. The VAL sample was used as a comparison control group. Table 1 provides descriptive statistics for demographic variables for the NEUR sample.
Procedure
Correlations with age, education, cognitive measures, and a measure of depression were examined. Differences between the NEUR and VAL samples in neuropsychological test performance and in the CA, HC, FA, and AM scores were tested by means of t tests. We then used logistic regression analyses to examine the ability of the activity scores to discriminate between the NEUR and VAL groups.
Results
Table 3 presents correlations between the activity scores and the set of demographic, cognitive, and depression measures. The pattern of correlations for the CA, HC, and FA scores was similar to those obtained with the DEV and VAL samples, with the exception of higher correlations with the HVLT Delay and Trail Making–Part B scores. However, while no AM score correlation was larger than |.30| in the DEV and VAL samples, correlations of |.34| to |.45| were obtained for years of education, HVLT Delay, Stroop Color-Word, and Trail Making–Part B scores.
Individual t tests revealed significantly poorer performance by the NEUR sample on the Stroop Color-Word (t = 2.56, df = 225, p < .05) and Trail Making–Part B (t = 2.68, df = 225, p < .05) scores. Tests of differences between groups on the activity scores revealed significantly lower scores for the NEUR sample for the CA (t = 2.81, df = 225, p < .01), HC (t = 3.04, df = 225, p < .01),), FA (t = 1.98, df = 225, p < .05), and AM (t = 4.09, df = 225, p < .001) scores. The effect size for the AM score was the largest of the scores and moderate in size (d approximately = .7).
Logistic regression analysis was used to examine the predictive value of activity scores in discriminating membership in the two groups. In the first step of the analysis, age, education, and gender were entered as control variables. These three demographic variables were found to make a significant contribution (χ2 = 21.56, df = 3, p < .001) to the distinction between groups. In the second step of the analysis, the four activity scores were then allowed to enter the analysis, using the forward method of entry with the Wald statistic as a criterion. This step produced a significant result with entry of the AM score (χ2change = 9.90, df = 1, p < .01), but other activity scores did not meet criteria for entry. In order to estimate the amount of variance in discrimination accuracy explained by these variables, we calculated the McKelvy-Zavoina index per the recommendation of DeMaris (2002). Age, education, and gender together accounted for 23% of the variance in discrimination accuracy. Addition of the AM score increased explained variance to 31%. A model that included all activity scores did not increase the percentage of explained variance in group discrimination.
DISCUSSION
In this research, we used a rational-empirical approach in the construction and validation of a cognitive activities scale (Florida Cognitive Activity Scale; FCAS) for use with elderly populations. The scale development effort produced a 25-item scale with a reasonably high level of internal consistency reliability (alpha = .65) in a sample of 200 elderly individuals, given the limitations on the size of inter-item correlations imposed by measurement of the activity construct. In this same sample, CA scores were found to correlate positively at a moderate level with years of education and neuropsychological measures of various domains of cognitive ability. A small, negative correlation of CA score with age was obtained, consistent with a modest reduction in the number of activities. In a separate cross-validation sample drawn from the same source, a highly similar pattern of reliability and validity coefficients was obtained. Similar relationships have been reported previously with other types of activity, although the magnitude of the association varies with the types of activities assessed (e.g., Bukov et al., 2002; Menec, 2003; Salthouse et al., 2002). Importantly, the CA score was found to contribute significantly to the prediction of neuropsychological test performance after controlling for the effects of age, education, and gender.
Two subscales and an index of maintenance of cognitive activity were also developed. The HC and FA scales are brief scales designed to provide measures of higher-order cognitive activities and frequent activities, respectively. In both development and validation samples, the HC scale was found to have generally higher correlations with cognitive abilities than the CA and FA scales, while the FA scale had a pattern of somewhat lower correlations with cognitive abilities than the HC and CA scales. These subscales are experimental, but may have the potential of being sensitive to conditions (e.g., executive disorders, movement disorders) that differentially affect items of the full CA scale. The measure of self-reported maintenance of cognitive activity, the AM score, is a ratio of the number of current activities currently performed divided by the number of activities ever performed. This score was found to have a slight negative correlation with age, no meaningful correlation with education, and small to moderate correlations with measures of memory and executive ability in both development and validation samples. In a separate study the AM score was found to differ significantly between the validation sample and a sample of individuals with a history of neurological disorder, with an effect size of about .7. Further, the AM score was found to be the most significant discriminator of the two groups.
While these results speak favorably to the value of the FCAS, a stringent assessment of the research and potential clinical value of the scale will be possible, however, only after additional studies have established the reliability and validity of the scale with additional populations and under conditions that are known to affect cognitive activity. Because participation in the activities that form the FCAS item pool is dependent in part on financial resources, on the ability to afford leisure time, and on cultural influences, cross-validation studies in minority groups and groups of varying socioeconomic status are critical. Additionally, a demonstration of the differential sensitivity of the FCAS scores to a variety of conditions limiting activity level in general (e.g., cardiac disorders) and cognitive activity specifically (e.g., neurological disorders such as Alzheimer's disease) would be valuable in supporting the use of the instrument in subsequent costly longitudinal studies. Studies employing significant others, such as spouses, to rate individuals in varying conditions of physical and cognitive health would also help to establish the integrity of the self-report of involvement in cognitive activities.
Finally, the studies reported here are consistent with the hypothesis of a protective effect of cognitive activity on cognition by showing both a negative relationship between age and level of activity and a positive relationship between level of activity and level of cognition. We recognize, however, that cohort studies such as these do not provide evidence for a causative relationship. Longitudinal studies will be required to produce strong evidence of such protective effects.
ACKNOWLEDGMENTS
The Charlotte County Healthy Aging Study was supported by the Charlotte County Foundation and the University of South Florida Institute on Aging. The analyses reported in this study were supported in part by the Department of Veterans Affairs. Portions of this paper were presented at the 111th Annual Convention of the American Psychological Association, Toronto, Ontario, Canada, August 2003. The Florida Cognitive Activity Scale and normative data can be obtained from James A. Mortimer, Ph.D., Department of Epidemiology and Biostatistics, University of South Florida, Tampa, FL 33620. E-mail: jmortime@hsc.usf.edu.
References
REFERENCES
Aartsen, M.J.,
Smits, C.H.M.,
van Tilburg, T.,
Knipscheer, K.C.P.M., &
Deeg, D.J.H.
(2002).
Activity in older adults: Cause or consequence of cognitive
functioning? A longitudinal study on everyday activities and cognitive
performance in older adults.
The Journals of Gerontology: Series B: Psychological Sciences and
Social Sciences,
57(B),
153–162.CrossRefGoogle Scholar
Benedict, R.H.,
Schretlen, D.,
Goninger, L., &
Brandt, J.
(1998).
Hopkins Verbal Learning Test-Revised: Normative data and analysis
of inter-form and test–retest reliability.
Clinical Neuropsychology,
12,
43–55.CrossRefGoogle Scholar
Borenstein, A.M.
(2004).
The epidemiology of dementia. In
L.M. Nelson,
S. Van Den Eeden, &
C. Tanner (Eds.),
Neuroepidemiology: From principles to practice (pp.
102–130).
New York:
Oxford University Press.
Bosma, H.,
van Boxtel, M.P.,
Ponds, R.W.,
Jelicic, M.,
Houx, P.,
Metsemakers, J., &
Jolles, J.
(2002).
Engaged lifestyle and cognitive function in middle and old-aged,
non-demented persons: A reciprocal association?
Zeitschrift fur Gerontologie und Geriatrie,
35,
575–581.Google Scholar
Bukov, A.,
Maas, I., &
Lampert, T.
(2002).
Social participation in very old age: Cross-sectional and
longitudinal findings from BASE.
Journal of Gerontology: Psychological Sciences,
57B,
P510–P517.Google Scholar
Clark, L.A. &
Watson, D.
(1995).
Constructing validity: Basic issues in objective scale development.
Psychological Assessment,
17,
309–319.CrossRefGoogle Scholar
DeMaris, A.
(2002).
Explained variance in logistic regression: A Monte Carlo study of
proposed measures.
Sociological Methods & Research,
31,
27–74.CrossRefGoogle Scholar
Folstein, M.F.,
Folstein, S.E., &
McHugh, P.R.
(1975).
“Mini-Mental State”: A practical method for grading the
cognitive state of patients for the clinician.
Journal of Psychiatric Research,
12,
189–198.CrossRefGoogle Scholar
Golden, C.J.
(1978).
Stroop color and word test.
Chicago, Illinois:
Stoelting.
Hultsch, D.F.,
Hertzog, C.,
Small, B.J., &
Dixon, R.A.
(1999).
Use it or lose it: Engaged lifestyle as a buffer of cognitive
decline in aging?
Psychology and Aging,
14,
245–263.Google Scholar
Menec, V.H.
(2003).
The relation between everyday activities and successful aging: A
6-year longitudinal study.
Journals of Gerontology: Series B. Psychological Sciences and
Social Sciences,
58,
S74–82.Google Scholar
Morey, L.C.
(1991).
Personality assessment inventory.
Odessa, Florida:
Psychological Assessment Resources.
Pushkar, D.,
Etezadi, J.,
Andres, D.,
Arbuckle, T.,
Schwartzman, A.E., &
Chaikelson, J.
(1999).
Models of intelligence in late life: Comment on Hultsch et al.
(1999).
Psychology and Aging,
14,
520–527.CrossRefGoogle Scholar
Rabbitt, P.,
Donlan, C.,
Watson, P.,
McInnes, L., &
Bent, N.
(1995).
Unique and interactive effects of depression, age, socioeconomic
advantage, and gender on cognitive performance of normal healthy older
people.
Psychology and Aging,
10,
307–313.CrossRefGoogle Scholar
Reitan, R.M.
(1958).
Validity of the trail-making test as an indicator of organic brain
damage.
Perceptual and Motor Skills,
8,
271–276.CrossRefGoogle Scholar
Restak, R.M.
(1997).
Older and wiser: How to maintain peak mental ability for as long as
you live.
New York:
Simon & Schuster.
Richards, M.,
Hardy, R., &
Wadsworth, M.E.
(2003).
Does active leisure protect cognition?
Social Science and Medicine,
56,
785–792.Google Scholar
Rowe, J.W. &
Kahn, R.L.
(1998).
Successful aging.
New York:
Pantheon Books.
Salthouse, T.A.,
Berish, D.E., &
Miles, J.D.
(2002).
The role of cognitive stimulation on the relations between age and
cognitive functioning.
Psychology and Aging,
17,
548–557.CrossRefGoogle Scholar
Schooler, S. &
Mulatu, M.S.
(2001).
The reciprocal effects of leisure time activities and intellectual
functioning in older people: A longitudinal analysis.
Psychology and Aging,
16,
466–482.CrossRefGoogle Scholar
Small, B.J.,
Graves, A.B.,
McEvoy, C.L.,
Crawford, F.C.,
Mullan, M., &
Mortimer, J.A.
(2000).
Is apolipoprotein E a risk factor for cognitive impairment in
normal aging? Evidence from a population-based sample of older
adults.
Neurology,
54,
2082–2088.CrossRefGoogle Scholar
Teng, E.L. &
Chui, H.C.
(1987).
The modified mini-mental state (3MS) examination.
Journal of Clinical Psychiatry,
48,
314–318.Google Scholar
Wilson, R.S.,
Barnes, L.L., &
Bennett, D.A.
(2003).
Assessment of lifetime participation in cognitively stimulating
activities.
Journal of Clinical and Experimental Neuropsychology,
25,
634–642.CrossRefGoogle Scholar
Wilson, R.S.,
Bennett, D.A.,
Beckett, L.A.,
Morris, M.C.,
Gilley, D.W.,
Bienias, J.L.,
Scherr, P.A., &
Evans, D.A.
(1999).
Cognitive activity in older persons from a geographically defined
population.
Journals of Gerontology: Series B: Psychological Sciences and
Social Sciences,
54(B),
155–160.CrossRefGoogle Scholar
Wilson, R.S.,
Mendes de Leon, C.F.,
Barnes, L.L.,
Schneider, J.A.,
Bienias, J.L.,
Evans, D.A., &
Bennett, D.A.
(2002).
Participation in cognitively stimulating activities and risk of
incident Alzheimer disease.
Journal of the American Medical Association,
287,
742–748.CrossRefGoogle Scholar
Yesavage, J.A.,
Brink, T.L.,
Rose, T.L.,
Lum, O.,
Huang, V.,
Adey, M.B., &
Leirer, V.O.
(1983).
Development and validation of a geriatric depression screening
scale: A preliminary report.
Journal of Psychiatric Research,
17,
37–49.Google Scholar

Demographic characteristics and scores for neuropsychological, depression, and cognitive activity measures
Item means and corrected-item total scale correlations for the 25-item cognitive activity scale

Alpha coefficients and correlations with demographic variables, neuropsychological measures, and depression scores for cognitive activity scores
 You have
Access
- 75
- Cited by