Introduction
Universalism in care provision implies that the needs of the individual – and not their resources – should determine the care they receive (Hernæs et al. Reference Hernæs, Kverndokk, Markussen and Øien2023). In the Nordic welfare states, universalism has traditionally been the guiding principle for the provision of long-term care (LTC) (Hjelmar and Rostgaard Reference Hjelmar and Rostgaard2020). However, over the past two decades, Nordic universal care models have increasingly been challenged by rapid population ageing and a sharp rise in the number of older adults requiring care. As a result, ensuring the efficient provision of LTC has become a growing concern for policy makers and public administrators. Across the Nordic region, the policy response has been to rely more on informal and for-profit providers and to introduce choice mechanisms aimed at increasing efficiency (Puthenparambil et al. Reference Puthenparambil, Kröger and Van Aerschot2017; Szebehely and Meagher Reference Szebehely and Meagher2018; Rostgaard et al. Reference Rostgaard, Jacobsen, Kröger and Peterson2022; Hansen and Dahl Reference Hansen and Dahl2023).
Denmark exemplifies this shift. Until the early 2000s, the country was characterized by a high degree of LTC universalism, with comprehensive high-quality services being provided free of charge and with high coverage (Rauch Reference Rauch2007). However, population ageing, rising LTC costs and ongoing challenges in recruiting and retaining qualified staff in the sector (Ministry of Finance et al. 2020; Larsen and Jakobsen Reference Larsen and Jakobsen2022) have led to significant reductions in services. For instance, LTC services have increasingly been targeted towards primarily the most vulnerable older adults (Amilon et al. Reference Amilon, Lauritzen and Christensen2024), and municipalities have cut the average number of care hours allocated per recipient of social and care services (in the following referred to as ‘service users’) (Foged and Houlberg Reference Foged and Houlberg2023).
To maintain quality despite these challenges, Denmark adopted neoliberal principles in its approach to care provision, and a reform in 2003 made municipalities responsible for ensuring that service users eligible for publicly funded care could choose between care providers – either the municipality itself or at least one for-profit provider contracted by the municipality (Rostgaard Reference Rostgaard2011; Danish Ministry of Social Affairs and the Interior 2015). The aim was to enhance care efficiency and quality by enabling service users to express their satisfaction or dissatisfaction with care services through choice (Rostgaard Reference Rostgaard2006). In addition, opting for a private provider allowed service users to purchase supplementary services beyond the care package assigned and financed by the municipality (Amilon et al. Reference Amilon, Kjær, Ladenburg and Siren2022), which facilitated the emergence of a market for private care services (Hjelmar and Rostgaard Reference Hjelmar and Rostgaard2020).
We hypothesize that the shift towards informalization and privatization of LTC (Rostgaard et al. Reference Rostgaard, Jacobsen, Kröger and Peterson2022), coupled with a decline in public care, has led service users with financial resources to increasingly seek private care providers, while those with social resources, such as friends and family, have relied more on their networks for support. As a result, inequities between service users with and without financial and social resources may have worsened over the past decade.
Measuring inequality and inequity in a care context is far from straightforward. In the literature, inequality refers to differences in the access to or utilization of LTC by socio-economic indicators such as income or wealth, whereas inequity refers to such differences while also taking needs-factors into consideration (Hu et al. Reference Hu, Read, Wittenberg, Brimblecombe, Rodrigues, Banerjee, Dixon, Robinson, Rehill and Fernandez2024). However, this distinction may not fully capture the complexity of socio-economic disparities in LTC for three key reasons. First, socio-economic groups may differ in their LTC preferences. What appears as inequity in care utilization may partially reflect varying preferences rather than, or in addition to, inequities. Second, care needs often vary systematically across socio-economic segments. Since these needs are challenging to measure and account for (García-Gómez et al. Reference García-Gómez, Hernández-Quevedo, Jiménez-Rubio and Oliva-Moreno2015), what we interpret as inequities in access to LTC may sometimes reflect unaccounted-for variations in care needs. Third, the ability to effectively navigate complex care systems varies by socio-economic status – both of older adults and of their family members (Kjær Reference Kjær2019). More resourceful individuals may be better equipped to select care providers that cater to their specific needs, which can result in qualitatively different care experiences even when individuals have been allocated to the same ‘care package’.
These considerations suggest that even needs-adjusted disparities in care utilization may not fully reflect inequities across different segments of service users. In the broader equity literature, scholars separate inequity in inputs from inequity in outcomes. For instance, in the health-care literature, equity is often defined as the equal distribution of health – that is, the equal distribution of the objective of health care (Culyer and Wagstaff Reference Culyer and Wagstaff1993; Braveman Reference Braveman2003). Although LTC services serve multiple objectives, enhancing the wellbeing and quality of life of service users remains a central goal (Malley et al. Reference Malley, D’Amico and Fernandez2019; Abbing et al. Reference Abbing, Suanet and Broese van Groenou2022). Following this reasoning, we argue that truly equitable LTC provision achieves similar needs-adjusted quality of life outcomes across all socio-economic groups, rather than merely ensuring equal needs-adjusted access or utilization.
We therefore take a novel approach to investigating inequity in Social Care-Related Quality of Life (SCRQoL), assessed using the Adult Social Care Outcomes Toolkit (ASCOT). The ASCOT is a validated instrument that assesses how well service users’ needs are met across eight domains of quality of life: control over daily life; personal cleanliness and comfort; food and drink; personal safety; social participation and involvement; occupation; accommodation cleanliness and comfort; and dignity (see Supplementary Material Table S1 for details). For brevity, abbreviations are used for domain titles, as indicated by the italicized words. Because all types of care – public, private or informal – contribute to meeting the needs of older adults (Rand et al. Reference Rand, Malley, Netten and Forder2015), it is reasonable to assume that financial and social resources may also support improvements in SCRQoL.
The ASCOT was developed to measure quality of life across a wide range of service user groups (Netten et al. Reference Netten, Burge, Malley, Potoglou, Towers, Brazier, Flynn, Forder and Wall2012), and its construct validity has been demonstrated among home-care users (Malley et al. Reference Malley, Towers, Netten, Brazier, Forder and Flynn2012). Conceptually, it is closely aligned with capability theory, as it incorporates service users’ opportunities for independence, choice and control in the receipt of care (Van Loon et al. Reference Van Loon, Van Leeuwen, Ostelo, Bosmans and Widdershoven2017). The ASCOT enables evaluation of SCRQoL both for individual domains and in aggregate.
This study investigates whether inequities in care provision are reflected both in the overall ASCOT score and across the eight domains individually. We define equitable LTC as care that achieves equal needs-adjusted SCRQoL for individuals regardless of their social or financial resources. Accordingly, we compare the SCRQoL of service users with and without financial and social resources while accounting for their care needs, and we assess whether inequities have increased over the past decade.
Literature review
While a growing body of research has examined inequality and inequity in the LTC context, studies vary significantly in their conceptual approaches, particularly regarding outcome measures and resource allocation. Most research focuses on disparities in home-care use (i.e. care inputs) rather than care outcomes (e.g. Albertini and Pavolini Reference Albertini and Pavolini2017; Carrieri et al. Reference Carrieri, Di Novi and Orso2017; Floridi et al. Reference Floridi, Carrino and Glaser2021). Although some studies assess unmet needs as an outcome (García-Gómez et al. Reference García-Gómez, Hernández-Quevedo, Jiménez-Rubio and Oliva-Moreno2015; Hu et al. Reference Hu, Read, Wittenberg, Brimblecombe, Rodrigues, Banerjee, Dixon, Robinson, Rehill and Fernandez2024) these measures – unlike the ASCOT – do not account for the severity of unmet needs or their varying impact on quality of life (Netten et al. Reference Netten, Burge, Malley, Potoglou, Towers, Brazier, Flynn, Forder and Wall2012).
Studies also differ in their definitions of inequities – particularly regarding which factors should be considered when assessing whether variations in LTC are ‘fair’ (Ilinca et al. Reference Ilinca, Rodrigues and Schmidt2017). Many have taken a narrow view of financial resources, primarily focusing on income disparities as a determinant of unequal LTC provision (Carrieri et al. Reference Carrieri, Di Novi and Orso2017; Mac Innes et al. Reference Mac Innes, Walsh and Österberg2021; Hernæs et al. Reference Hernæs, Kverndokk, Markussen and Øien2023). However, since income disparities tend to be greater among the working-age population than among older adults (Gornick et al. Reference Gornick, Sierminska and Smeeding2009), wealth may serve as a more appropriate measure of financial resources in later life, as it reflects accumulated income over the lifecourse (Rodrigues et al. Reference Rodrigues, Ilinca and Schmidt2018).
Beyond financial resources, non-monetary factors – such as access to informal care from a partner, children or social networks – can significantly impact service users’ SCRQoL (Forder et al. Reference Forder, Vadean, Rand and Malley2018). For instance, spousal support has been shown to mediate the socio-economic gradient in access to formal LTC (e.g. Hu et al. Reference Hu, Cartagena-Farias and Brimblecombe2022; Schmidt Reference Schmidt2017).
Recent reviews highlight the diverse factors influencing LTC outcomes. Rahman et al. (Reference Rahman, Rosenberg, Flores, Parsell, Akter, Alam, Rahman and Edejer2022) report a rural–urban divide in LTC, with older adults in rural areas experiencing more unmet care needs than those in urban areas. In contrast, a scoping review by Goodridge et al. (Reference Goodridge, Hawranik, Duncan and Turner2012), based primarily on studies from the United States and Canada, finds that lower socio-economic status is generally associated with a higher probability of receiving LTC services. This finding is unsurprising as publicly funded care in these (and many other) countries is inherently designed to support lower-income individuals (Gruber and McGarry Reference Gruber and McGarry2025). Moreover, a scoping review by Giebel et al. (Reference Giebel, Hanna, Watson, Faulkner, O’Connell, Smith and Donnellan2024) identifies a range of psychological, interpersonal, structural and cultural factors that act as both barriers and facilitators, contributing to inequalities in access to community-based social care for individuals with dementia.
The substantial variation in findings across reviews suggests that equity in LTC differs across care systems. Single-country studies reveal significant socio-economic disparities in LTC access in, for example, Spain, Austria and France (Paraponaris et al. Reference Paraponaris, Davin and Verger2012; García-Gómez et al. Reference García-Gómez, Hernández-Quevedo, Jiménez-Rubio and Oliva-Moreno2015; Schmidt Reference Schmidt2017). In the UK, Hu et al. (Reference Hu, Read, Wittenberg, Brimblecombe, Rodrigues, Banerjee, Dixon, Robinson, Rehill and Fernandez2024) find that while publicly financed care helps promote socio-economic equality for people with dementia, the level of support remains insufficient. Conversely, Tenand et al. (Reference Tenand, Bakx and Van Doorslaer2020) suggest that the Dutch publicly financed LTC insurance may ‘overshoot’ its target by providing needs-adjusted LTC beyond what would be equitable for lower-income older adults.
These findings align with comparative studies showing that Nordic countries, which have de-familized LTC systems, provide more equitable access to care than southern and continental European countries, where family-centred care models dominate (Motel-Klingebiel et al. Reference Motel-Klingebiel, Tesch-Roemer and Von Kondratowitz2005; Albertini and Pavolini Reference Albertini and Pavolini2017; Carrieri et al. Reference Carrieri, Di Novi and Orso2017; Ilinca et al. Reference Ilinca, Rodrigues and Schmidt2017; Floridi et al. Reference Floridi, Carrino and Glaser2021; Hasseler et al. Reference Hasseler, Heitmann-Möller, Ruppert, Nowossadeck, Fuchs and Hahm2024).
In the Nordic context, studies have primarily examined inequities in access to, or provision of, publicly financed LTC. Findings suggest no significant income-related disparities for these outcomes. For instance, Mac Innes et al. (Reference Mac Innes, Walsh and Österberg2021) find that income does not affect LTC allocation in Sweden, while Hernæs et al. (Reference Hernæs, Kverndokk, Markussen and Øien2023) report similar findings for institutional care in Norway. Similarly, Blomgren et al. (Reference Blomgren, Martikainen, Martelin and Koskinen2008) find that access to formal care in Finland is largely determined by needs-based factors such as age and functional capacity rather than income, a pattern also observed by Meinow et al. (Reference Meinow, Kareholt and Lagergren2005) for Sweden.
While existing literature generally highlights a high level of equity in the allocation of publicly financed LTC in Nordic countries, it largely overlooks potential disparities stemming from unequal access to supplementary care options, such as informal or privately funded care. However, in Sweden, research suggests that family care (Larsson et al. Reference Larsson, Kåreholt and Thorslund2014) or privately funded care (Szebehely and Trydegård Reference Szebehely and Trydegård2012) may, to some extent, offset reductions in public home care services. This finding is supported by Motel-Klingebiel et al. (Reference Motel-Klingebiel, Tesch-Roemer and Von Kondratowitz2005), who report a larger volume of total help and support in Norway than in less comprehensive welfare states such as Spain and Germany. In contrast, Abbing et al. (Reference Abbing, Suanet and Broese van Groenou2023) report a general decline in the use of all care types in the Netherlands, regardless of socio-economic status. However, as the authors emphasize, care outcomes – such as service users’ wellbeing or quality of life – are better suited than care utilization for investigating care inequalities.
Contribution and hypotheses
This study makes four novel and important contributions to the literature on inequities in LTC. First, we examine whether SCRQoL – a central care outcome – varies by service users’ resources while accounting for their care needs. Second, in doing so, we consider potential differences between various aspects of SCRQoL (i.e. if inequities are larger for, say, instrumental aspects of care than for psychosocial aspects of care). Third, contrary to previous studies (Mac Innes et al. Reference Mac Innes, Walsh and Österberg2021; Hernæs et al. Reference Hernæs, Kverndokk, Markussen and Øien2023), we define inequities broadly by investigating if SCRQoL is unequally distributed among service users with and without social resources (e.g. cohabiting, having children, having frequent contact with friends) and/or financial resources (e.g. financial satisfaction, income, wealth). Fourth, we use a broad range of registry- and survey-based variables to define both care needs and individuals’ resources, thereby avoiding common-source bias.
We expect inequities in SCRQoL among service users – and we expect these inequities to have grown over time due to declining publicly financed LTC services. We therefore investigate the following hypotheses:
H1. Financial and social resources are positively associated with service users’ SCRQoL.
H2. Inequities in SCRQoL between service users with and without financial and social resources have increased over time.
Moreover, the eight domains of the ASCOT (control; cleanliness; food; safety; participation; occupation; accommodation; dignity) may be influenced by social and financial resources to varying degrees. In Scandinavian welfare states, informal care-givers primarily provide social contact and support, as such tasks are often not prioritized by formal care providers (Skinner et al. Reference Skinner, Lorentzen, Tingvold, Sortland, Andfossen and Jegermalm2021). We therefore expect social resources to be particularly important for SCRQoL within the domains safety, participation and occupation. Moreover, living with someone, for instance a partner, can be expected to be particularly important for SCRQoL within the domain control, as a partner can help the older adult to choose what to do and when to do it (Kröger Reference Kröger and Szebehely2005).
In Nordic countries (in contrast to, for example, Anglo-Saxon, Eastern, Continental and Southern European countries), older adults prefer to receive personal care from formal carers rather than from informal carers (European Commission 2007; Li et al. Reference Li, Wister and Mitchell2021). We therefore expect financial resources to be particularly important for SCRQoL within the domains cleanliness and dignity, as service users may prefer to pay for a private provider rather than rely on family members for additional assistance with, for example, personal hygiene. Moreover, while not related to care as such, financial resources enhance older adults’ opportunities for social participation (Xia et al. Reference Xia, Van Wijngaarden, Huijsman and Buljac-Samardžić2022), likely benefiting participation and occupation. For the domains food and accommodation, we expect both financial and social resources to play a role, as both formal and informal carers can assist with, for example, meals and cleaning. However, since friends rarely help with practical tasks in Denmark (Amilon et al. Reference Amilon, Casier and Røgeskov2019), we expect a higher SCRQoL to be associated with having a partner or child(ren) but not with having frequent contact with friends.
This leads us to our final hypotheses (indicated in the last column of Table S1):
H3a: Social resources are positively associated with the domains control (partner); food (partner, children); safety, participation, occupation (partner, children, friends); and accommodation (partner, children).
H3b: Financial resources are positively associated with the domains cleanliness, food, participation, occupation, accommodation and dignity.
By investigating these hypotheses, we contribute to the understanding of how the decline in publicly financed services in a welfare state has influenced inequities in SCRQoL between service users with and without social and financial resources. If resources increasingly play a role, universalism in LTC – which has been characteristic of the Nordic welfare states’ model of care provision – may be called into question. Moreover, if resources determine the level of SCRQoL, unmet care needs will become particularly prevalent among older adults with limited resources. In addition to significantly harming these individuals’ wellbeing, such inequity may compromise the legitimacy of the tax-financed formal care model, potentially leading to deteriorating public support (Amilon et al. Reference Amilon, Ladenburg, Siren and Vernstrøm Østergaard2020).
Institutional context
We investigate resource inequities in SCRQoL in Denmark – a case that can draw on unique, high-quality survey and registry data. Studying Denmark is also merited from a contextual perspective, as it serves as a key example of the weakening universalism that has characterized Nordic welfare states since the 1990s (Rauch Reference Rauch2007).
In Denmark, municipalities are responsible for both providing and financing LTC services for older adults with care needs (Ministry of Health 2017). Public care services are financed through general taxation and there are no means tests or user payments involved. While Danish legislation grants all individuals with care needs a general right to assistance, it does not specify detailed entitlements. As a result, municipalities have considerable autonomy in balancing the needs of different groups and prioritizing welfare areas within their budgets. During the study period, rising demand due to population ageing led many municipalities to tighten their care provision guidelines, resulting in an overall decline in services (Amilon et al. Reference Amilon, Lauritzen and Christensen2024).
Publicly financed LTC services are determined through a needs assessment conducted by a municipal care manager (Danish Ministry of Social Affairs and the Interior 2015). As part of this assessment, the care manager may consider whether other household members can assist with practical tasks (i.e. cleaning, shopping, cooking). However, family members are not expected to provide personal care (i.e. personal hygiene and toileting). Municipalities do not consider the service user’s financial resources or their ability to purchase privately funded care when determining eligibility for or the content of publicly financed services.
Municipalities must offer service users a choice between municipal services and at least one private provider (contracted by the municipality). Regardless of the chosen provider, the assigned care package is fully covered with no user fees. However, private providers may allow service users the option to purchase additional services beyond the assigned care package (Amilon et al. Reference Amilon, Kjær, Ladenburg and Siren2022). Nearly half of the service users with private providers report doing so, though the specifics regarding the content of these services remain unclear (Hjelmar and Rostgaard Reference Hjelmar and Rostgaard2020).
Although municipalities are responsible for financing care, family members often contribute additional support such as transportation, administrative assistance and emotional support (KMD 2018; Sortland Reference Sortland, Glasdam and Jacobsen2018). Approximately half of Danes aged 50–64 occasionally provide care for their parents, though only 3 per cent provide high-intensity care (Labbas Reference Labbas2022). This pattern reflects the broader trend identified by Albertini et al. (Reference Albertini, Kohli and Vogel2007): the more extensive the welfare state, the more common, but less intensive, the family care.
Methods
Data
Our analysis is based on data from the Danish Longitudinal Study of Ageing (DLSA) combined with comprehensive administrative registry data from the population, education and income registries and from the registry of allocated home-care services (Visiteret hjemmehjælp – eget hjem). These registries and the DLSA are collected by Statistics Denmark and stored on their secure servers. Access to these data is restricted to certified researchers (see Statistics Denmark 2025 for details). The collection of the DLSA and the linkage of survey data to registry records were approved by Statistics Denmark, project ID 706546.
The DLSA is an ongoing longitudinal study of living conditions among older adults in Denmark, conducted every five years since 1997. The first wave included a representative sample of every fifth cohort born between 1920 and 1945 (ages 52–77 in 1997). Subsequent waves have, as far as possible, retained individuals from the original sample while adding a new cohort of 52-year-olds. To compensate for attrition, new respondents are selected to maintain the representativeness of the data (see Kjær Reference Kjær2019 for details). However, due to higher survival rates among DLSA respondents compared to the general population, no new respondents were added to the oldest cohorts in the 2017 and 2022 waves.
The ASCOT measure has been included in the DLSA since 2012; therefore, this analysis builds on the last three waves of data (2012, 2017 and 2022). Over this period, response rates declined from 74.7 per cent in 2012 to 45.5 per cent in 2022 (Larsen and Mikkelsen Reference Larsen and Mikkelsen2023), partly due to the ageing of respondents but also reflecting a general decline in survey participation (Beullens et al. Reference Beullens, Loosveldt, Vandenplas and Stoop2018). To adjust for falling response rates and the lack of representativeness of the oldest cohorts, population weights based on comprehensive registry data were added to the 2017 and 2022 waves.
For this analysis, we use a sub-sample of respondents aged 67 or older at the point of data collection who were service users (i.e. allocated long-term home-care services by their municipality in the survey year).Footnote 1 This demographic is challenging to include in quantitative studies, as many are unable to participate in surveys. To address this problem, the DLSA employs both telephone and face-to-face interviews, with the latter targeting hard-to-reach older adults (e.g. users of home and institutional care).
Our final sample consists of 1,081 observations, including respondents with information on at least one ASCOT domain and complete information on indicators of care needs. Due to the relatively small sample size, particularly in analyses conducted separately by survey year, we included as many observations as possible in the empirical models. As resource measures enter the models separately, we retained respondents with information on at least one resource measure. Consequently, the number of observations varies slightly across models, ranging from 907 to 1,065 (see Table 1 and figure notes for details).
Descriptive statistics by survey year

Table 1 Long description
Values are reported for survey years 2012, 2017, and 2022, plus Total, and a Difference column indicating 2012 to 2022 changes. Variables include age mean 81 with N 469 in 2012, 82 with N 318 in 2017, and 81 with N 294 in 2022, with Total mean 81 and N 1081. Sex shares are male 0.28, 0.36, 0.3 and female 0.72, 0.64, 0.7, with Total shares 0.31 male and 0.69 female. Post secondary education shows No at 0.57 with N 265 in 2012, 0.5 with N 158 in 2017, and 0.41 with N 121 in 2022, and Yes at 0.43 with N 204 in 2012, 0.5 with N 160 in 2017, and 0.59 with N 173 in 2022, with Total shares 0.5 No and 0.5 Yes. Functional limitations are 3 to 6 at 0.54, 0.58, 0.67 and 0 to 2 at 0.46, 0.42, 0.33, with Total shares 0.59 and 0.41. Hours of LTC mean are 9.4 in 2012, 13 in 2017, and 9.5 in 2022, with Total mean 10 and N 1.081. SCRQoL lists ASCOT score 0.88, 0.84, 0.82 with Total 0.85, and domain scores for 2012, 2017, 2022 and Total respectively: Control 0.81, 0.79, 0.74, Total 0.78; Cleanliness 0.91, 0.87, 0.84, Total 0.88; Food 0.93, 0.9, 0.89, Total 0.91; Safety 0.88, 0.83, 0.84, Total 0.85; Participation 0.78, 0.76, 0.72, Total 0.76; Occupation 0.79, 0.78, 0.74, Total 0.77; Accommodation 0.85, 0.8, 0.77, Total 0.81; Dignity 0.87, 0.84, 0.85, Total 0.86. Resources include Children No 0.13, 0.094, 0.14 and Yes 0.87, 0.91, 0.86; Cohabits No 0.77, 0.79, 0.79 and Yes 0.23, 0.21, 0.21; Sees friends monthly No 0.29, 0.3, 0.34 and Yes 0.71, 0.7, 0.66; Financially satisfied No 0.29, 0.23, 0.32 and Yes 0.71, 0.77, 0.68; High disposable income No 0.89, 0.89, 0.89 and Yes 0.11, 0.11, 0.11; High wealth No 0.81, 0.82, 0.83 and Yes 0.19, 0.18, 0.17. Share of sample, observations is 43 per cent with N 469 in 2012, 29 per cent with N 318 in 2017, 27 per cent with N 294 in 2022, and Total 100 per cent with N 1.081.
1 Indicates a statistically significant difference between the proportions in 2012 and 2022. The p-values were calculated using Pearson chi2 test for categorical variables and t-test for continuous variables, * p < 0.05, ** p < 0.01, *** p < 0.001.
2 Assessed care need, measured as the mean monthly hours of home care expected to be required during a given year.
3 Preference-weighted ASCOT score.
4 Disposable equivalized income; percentiles were calculated for individuals aged 67–97 years and retired from the labour market (including both service users and non-users).
Measuring social care-related quality of life (SCRQoL)
We measure SCRQoL using the ASCOT, which captures how well individuals’ needs are met across eight quality of life domains (Malley et al. Reference Malley, D’Amico and Fernandez2019). The original ASCOT assesses both the current situation within each domain and the hypothetical situation without support from social services. For example, the Accommodation item asks: ‘Could you tell me which of the following statements best describes how clean and comfortable your home is?’ and ‘Imagine that you did not have the support and services from social services that you do now, and no other help stepped in. In that situation, which of the following would best describe how clean and comfortable your home is?’. Responses are given on a four-level scale ranging from the ideal state to high unmet needs (see Netten et al. Reference Netten, Burge, Malley, Potoglou, Towers, Brazier, Flynn, Forder and Wall2012 and the Supplementary Materials for details). The Danish version used in this study, however, asks only about the current situation (Amilon et al. Reference Amilon, Lauritzen and Christensen2024). As current circumstances reflect support from social services as well as private or informal sources, social and financial resources are likely to influence quality of life across the eight domains, and consequently the responses.
The computation of the total ASCOT score acknowledges that domains may differ in their relative contribution to overall quality of life. Using preference weights from a discrete choice experiment, we calculate total SCRQoL (ASCOT score). In the absence of Danish preference weights, we apply the UK weights derived for older adults (Netten et al. Reference Netten, Burge, Malley, Potoglou, Towers, Brazier, Flynn, Forder and Wall2012). We then examine whether resource-based inequities exist, both for the total ASCOT score and across each of its eight domains.
Measuring individuals’ resources
Social resources are measured through self-reported information on cohabitation status (cohabit with, for example, a spouse or partner, yes versus no), children (have at least one child versus do not have children) and contact with friends and acquaintances (at least monthly contact versus less often or do not have any).
We measure financial resources through self-reported information about financial satisfaction (economic situation is good or very good versus average, poor or very poor). Moreover, we use two indicators from the income registry to measure financial resources. First, equivalized disposable income is based on official information on household total income after tax and other deductions, divided by the weighted number of household members. Second, individual net wealth contains the value of housing wealth and a wide range of financial assets after deductions for debts. While this measure does not include all types of asset (most notably, pension wealth is excluded for administrative reasons), it has the advantage of providing comparable objective wealth information for the period under study. Both measures are adjusted for inflation. We compare service users in the top quartile to service users in the bottom three quartiles. Quartiles are determined based on the total sample of respondents to the DLSA over 67 years of age (i.e. regardless of whether they receive LTC services or not), with the exclusion of respondents who reported that they were still working. Thus, these measures indicate whether the service user’s income or wealth is in the top quartile as compared to those of other retirees.
Controlling for care needs
We use a comprehensive set of measures to control for care needs, building on both registry and survey-based information. As the DLSA includes every fifth cohort, information about age is obtained from the population registry and included as a dummy variable (less than 82 years versus 82+ years). Moreover, following Tenand et al. (Reference Tenand, Bakx and Van Doorslaer2020), we include information about assessed care need, measured as the number of care minutes each service user was allocated by a care manager. These data are sourced from Statistics Denmark’s registry of allocated home-care services (Visiteret hjemmehjælp – eget hjem). Through this information, we construct a proxy for assessed care need by calculating the average number of allocated hours per month in a year. As this variable is strongly skewed – with most individuals allocated relatively little care and a few individuals allocated substantial care – we also include it as a quadratic term in all regressions.
In addition, we control for self-rated health (very good or good versus average, poor or very poor) and functional limitations, measured as self-reported difficulties in executing activities of daily living (ADLs) (Shanas et al. Reference Shanas, Townsend, Wedderburn, Friis, Milhøj and Stehouwer1968). We constructed a dichotomous variable based on the number of ADLs that the service user reported carrying out with difficulty or not being able to do (high functional capacity = problems with 0–2 ADLs versus low functional capacity = problems with 3–6 ADLs). Included ADLs were: cutting toenails; going up or down stairs; walking indoors; walking outdoors; washing or taking a bath or shower; getting dressed; putting on shoes.
Last, we control for sex (derived from the population registry, coded as male or female) and education (derived from the education registry, coded as less than post-secondary education versus at least post-secondary education).Footnote 2
Data analysis
We first present descriptive statistics of the analytical sample. Next, we explore associations between total SCRQoL (preference-weighted ASCOT score) and resources while controlling for needs-factors, using ordinary least squares (OLS) regression models. As some respondents are included in several waves of the DLSA, we cluster standard errors at the individual level. We estimate and present adjusted predicted ASCOT scores based on OLS models for service users with and without each of the investigated financial and social resources. To investigate changes over time, we include interaction terms between the year (2012, 2017 and 2022) and our resource measures. As omitted variables may confound the relationship between resources and SCRQoL, the associations between resources and SCRQoL cannot be interpreted as causal effects.
To investigate if resources matter for the eight ASCOT domains, we build on OLS regression models to calculate adjusted predicted SCRQoL per domain with and without each of the six resources. We then calculate differences between individuals with and without a specific resource for each domain and use the delta method to determine if the difference is statistically significant. Due to the large number of significance tests (48 in total), we use multiple-test procedures to correct p-values to avoid erroneously concluding that a difference between individuals with and without a specific resource for a specific domain is statistically different from zero when it is not (Newson Reference Newson2010).
Results
Table 1 presents the characteristics of our sample of service users – individuals who were granted long-term home care by their municipalities – by year and in total. In all survey years, service users were 81 years old on average and approximately two-thirds of the sample were female. The share of service users with post-secondary education increased significantly, from 43 per cent in 2012 to 59 per cent in 2022. As expected, because public LTC services were increasingly targeted towards the most vulnerable older adults, the share of service users experiencing significant functional limitations (3–6) increased significantly in the period (from 54% to 67%) as did the share reporting average, bad or very bad self-reported health (from 62% to 80%). Despite these signs of deteriorating health and increasing disability among service users, the assessed care need (measured as average care hours assigned by the municipality) only increased (insignificantly) from 9.4 to 10 hours.
SCRQoL measured as total weighted ASCOT score fell significantly from 2012 to 2022 (from 0.88 to 0.82), as did all domain scores except dignity. Regarding social resources, around 90 per cent of service users had children, 20 per cent lived with someone and 70 per cent maintained contact with friends and acquaintances at least monthly. These shares remained relatively stable over time. The pattern is similar for financial resources: around 70 per cent of service users were financially satisfied, while around 11 per cent were in the top income and 18 per cent were in the top wealth quartiles in all survey years.
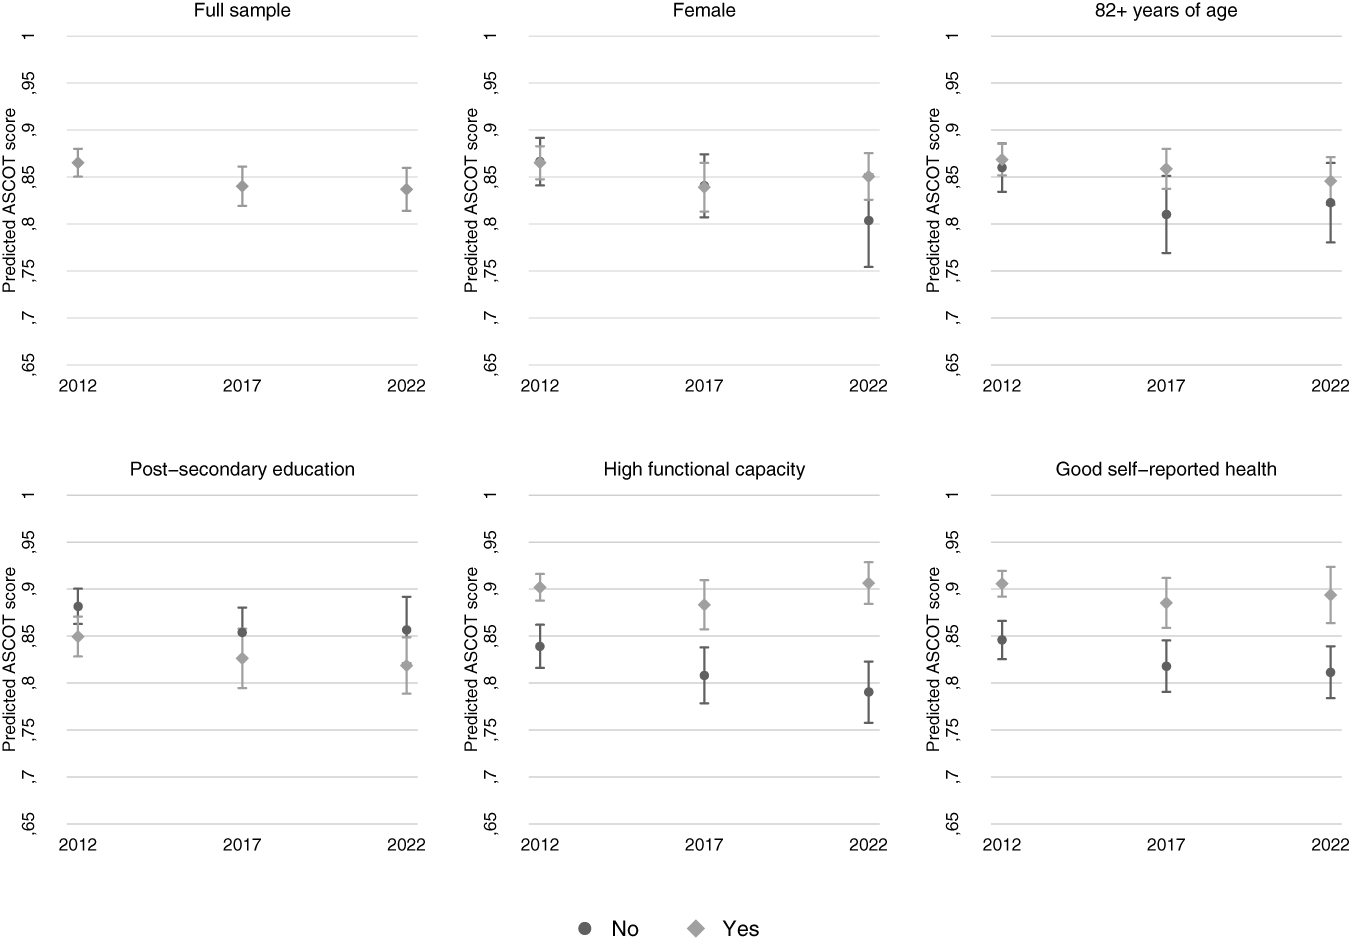
We first show how the predicted adjusted ASCOT score varied over the survey years, in total and by selected needs-variables (Figure 1). The figure reveals that when taking service users’ characteristics into consideration, SCRQoL (predicted weighted ASCOT score) fell significantly from 2012 to 2022. Education was significantly associated with SCRQoL in 2012, but not in 2017 or 2022. Age was significantly associated with SCRQoL in 2017, but not in 2012 or 2022. Gender was not significantly associated with SCRQoL in any year. Service users with relatively high functional capacity (0–2 limitations) and good or very good self-reported health had significantly higher SCRQoL than service users with more functional limitations (3−6) and poorer health. The large and growing differences between service users based on health and functional capacity suggest that these factors play a crucial role in later life.
Development in Social Care Related Quality of Life (SCRQoL) by service user characteristics. Linear probability models (adjusted for education, age, gender, functional limitations, self-reported health and assessed care need). Presented as predicted probabilities. See Supplementary Material Tables S2–S7 for complete regression models underlying the predicted probabilities presented in this figure. N = 945.

Figure 1 Long description
The plots display predicted ASCOT scores over the years 2012, 2017 and 2022, with the vertical axis ranging from 0.65 to 1. Each plot includes two series differentiated by marker shapes, representing ′No′ and ′Yes′ as indicated in the legend. In the ′Full sample′ plot, scores remain relatively stable across the years, with slight fluctuations. The ′Female′ plot shows a consistent pattern similar to the full sample, with no significant differences between ′No′ and ′Yes′. For ′82+ years of age′, scores show a slight decline over time, with ′Yes′ generally higher than ′No′. In ′Post-secondary education′, scores are stable, with ′Yes′ slightly higher than ′No′ in 2022. The ′High functional capacity′ plot indicates higher scores for ′Yes′ compared to ′No′, with a noticeable gap widening by 2022. Finally, ′Good self-reported health′ shows consistently higher scores for ′Yes′, with a slight increase over time. Key values include a range from approximately 0.75 to 0.95 across different plots, highlighting the differences in predicted ASCOT scores based on service user characteristics.
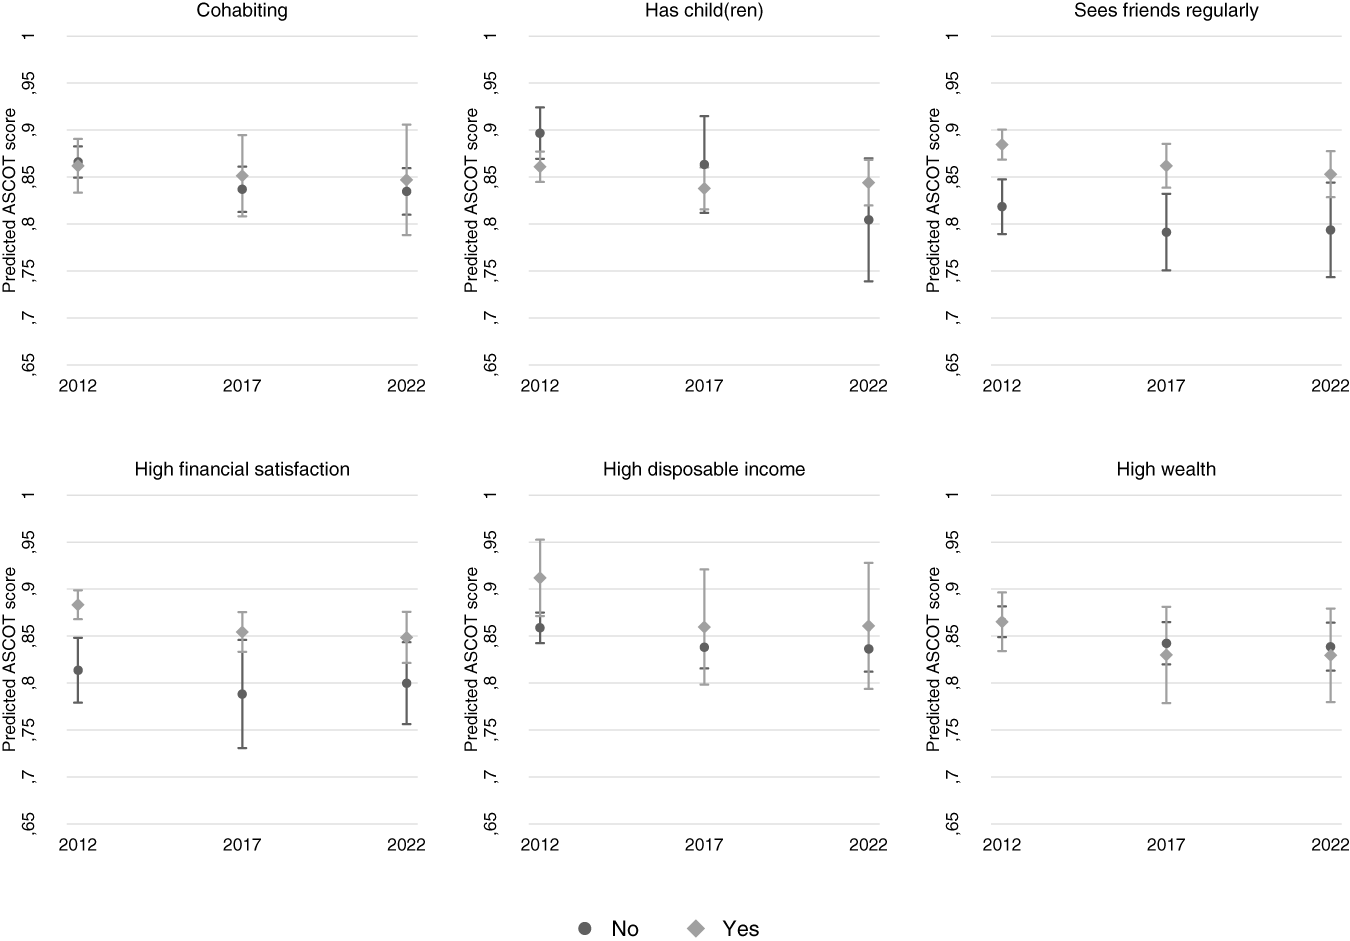
Average adjusted predicted ASCOT scores by resource appear in Figure 2. The graphs provide mixed evidence for our hypothesis that resources are positively associated with SCRQoL (H1). Associations with having children or a high disposable equivalized income were present in 2012 but not in 2017 or 2022. High financial satisfaction was associated with SCRQoL in 2012 and 2017, but not in 2022. Cohabitation and high wealth showed no significant associations, whereas regular contact with friends consistently predicted higher SCRQoL. Contrary to our expectation (H2), differences between service users with and without these resources remained stable over time, with SCRQoL declining in parallel for both groups.
Development in Social Care Related Quality of Life (SCRQoL) by service user resources. Linear probability models (adjusted for education, age, gender, functional limitations, self-reported health and assessed care need). Presented as predicted probabilities. See Supplementary Material Tables S8–S13 for complete regression models underlying the predicted probabilities presented in this figure. N = 907–945.

Figure 2 Long description
Cohabiting. The horizontal axis label is 2012, 2017, 2022. The vertical axis label is Predicted ASCOT score, with tick labels 0.65, 0.7, 0.75, 0.8, 0.85, 0.9, 0.95, 1. Two series are shown in a legend: No and Yes. In 2012, two points are plotted near 0.86 to 0.88 with vertical error bars. In 2017, two points are plotted near 0.84 to 0.86 with vertical error bars. In 2022, two points are plotted near 0.83 to 0.86 with vertical error bars. Has child(ren). The horizontal axis label is 2012, 2017, 2022. The vertical axis label is Predicted ASCOT score, with tick labels 0.65, 0.7, 0.75, 0.8, 0.85, 0.9, 0.95, 1. Two series are shown in a legend: No and Yes. In 2012, two points are plotted near 0.86 to 0.90 with vertical error bars. In 2017, two points are plotted near 0.83 to 0.87 with vertical error bars. In 2022, two points are plotted near 0.80 to 0.85 with vertical error bars, with one error bar extending down to near 0.74. Sees friends regularly. The horizontal axis label is 2012, 2017, 2022. The vertical axis label is Predicted ASCOT score, with tick labels 0.65, 0.7, 0.75, 0.8, 0.85, 0.9, 0.95, 1. Two series are shown in a legend: No and Yes. In 2012, two points are plotted near 0.82 and near 0.89 with vertical error bars. In 2017, two points are plotted near 0.79 and near 0.86 with vertical error bars. In 2022, two points are plotted near 0.79 and near 0.85 with vertical error bars. High financial satisfaction. The horizontal axis label is 2012, 2017, 2022. The vertical axis label is Predicted ASCOT score, with tick labels 0.65, 0.7, 0.75, 0.8, 0.85, 0.9, 0.95, 1. Two series are shown in a legend: No and Yes. In 2012, two points are plotted near 0.81 and near 0.88 with vertical error bars. In 2017, two points are plotted near 0.78 and near 0.85 with vertical error bars. In 2022, two points are plotted near 0.80 and near 0.85 with vertical error bars. High disposable income. The horizontal axis label is 2012, 2017, 2022. The vertical axis label is Predicted ASCOT score, with tick labels 0.65, 0.7, 0.75, 0.8, 0.85, 0.9, 0.95, 1. Two series are shown in a legend: No and Yes. In 2012, two points are plotted near 0.86 and near 0.91 with vertical error bars. In 2017, two points are plotted near 0.84 and near 0.86 with vertical error bars. In 2022, two points are plotted near 0.84 and near 0.86 with vertical error bars. High wealth. The horizontal axis label is 2012, 2017, 2022. The vertical axis label is Predicted ASCOT score, with tick labels 0.65, 0.7, 0.75, 0.8, 0.85, 0.9, 0.95, 1. Two series are shown in a legend: No and Yes. In 2012, two points are plotted near 0.85 to 0.87 with vertical error bars. In 2017, two points are plotted near 0.82 to 0.84 with vertical error bars. In 2022, two points are plotted near 0.82 to 0.84 with vertical error bars.
Having established that the associations between resources and SCRQoL were stable over time, we pool our sample across survey years to investigate these associations by ASCOT domain (while we also analysed changes over time for individual ASCOT domains and found similar results, we present the pooled results here for brevity). To explore variation in the impact of resources across domains, Table 2 displays predicted ASCOT scores per domain for service users with and without resources and differences between them. Only resources that significantly affected SCRQoL within at least one domain are included in the table for reasons of brevity.
Predicted Social Care Related Quality of Life (SCRQoL) by ASCOT domain for service users with and without social and financial resources

Table 2 Long description
Predicted SCRQoL is listed for people with a named social or financial resource and for people without that resource, alongside a difference column and an observations count. Under social resources, cohabits appears for Control with 0.73 with resource and 0.80 without, difference minus 0.06 with three asterisks, observations 1,048. Children appears for Control with 0.78 with resource and 0.84 without, difference minus 0.06 with two asterisks, observations 1,048. Contact with friends includes Safety 0.87 with resource and 0.81 without, difference 0.06 with three asterisks, observations 1,052; Participation 0.80 and 0.67, difference 0.13 with three asterisks, observations 1,047; Occupation 0.79 and 0.73, difference 0.06 with two asterisks, observations 1,011; Accommodation 0.83 and 0.77, difference 0.06 with three asterisks, observations 1,050; and Dignity 0.88 and 0.81, difference 0.07 with three asterisks, observations 999. Under financial resources, high disposable income appears for Participation with 0.84 with resource and 0.75 without, difference 0.09 with two asterisks, observations 1,041. Financially satisfied includes Control 0.80 and 0.74, difference 0.06 with two asterisks, observations 1,010; Food 0.92 and 0.88, difference 0.04 with two asterisks, observations 1,020; Safety 0.88 and 0.79, difference 0.09 with three asterisks, observations 1,027; Participation 0.78 and 0.70, difference 0.08 with three asterisks, observations 1,020; Occupation 0.79 and 0.72, difference 0.07 with two asterisks, observations 985; Accommodation 0.83 and 0.75, difference 0.08 with three asterisks, observations 1,024; and Dignity 0.87 and 0.81, difference 0.05 with two asterisks, observations 973. Asterisks appear only in the Difference column and vary by row.
1 Indicates if the difference between the predicted SCRQoL with and without each resource is statistically significant. * p < 0.05, ** p < 0.01, *** p < 0.001. See Supplementary Material Tables S14–S19 for complete regression models underlying the predicted probabilities presented in this table.
The results for cohabitation and children stand in contrast to our hypothesis (H3a). Cohabitation was only significantly associated with the domain control: we observed a negative difference in that cohabiting individuals experienced less control than those living alone. A similar negative difference for the domain control appeared for individuals with children compared to those without. However, for contact with friends, findings aligned more closely with expectations (H3a), as we found the expected positive association for the domains safety, participation and occupation. Unexpectedly, we also found that frequent contact with friends was positively associated with SCRQoL in the accommodation domain (which we had only hypothesized for partner and children) and in the dignity domain (not included in H3a).
We also found partial support for our hypothesis (H3b) regarding a positive association between financial satisfaction and SCRQoL for selected domains. As expected, financially satisfied service users reported higher SCRQoL within the domains food, accommodation, participation, occupation and dignity. However, the expected positive association for the domain cleanliness was absent, and we unexpectedly found higher predicted SCRQoL among financially satisfied service users for the domains control and safety. Moreover, aside from the hypothesized positive association between high disposable income and participation, we found no differences between service users with and without objective indicators for financial resources, that is, high income or wealth.
Sensitivity analyses
In addition to the preferred specifications that we present here, we conducted a series of supplementary models to assess the robustness of our findings. Specifically, we re-estimated the models shown in Figure 2 under the following conditions: (i) separately for service users with private versus public providers; (ii) separately for service users with few (0−2) versus many (3–6) functional limitations; (iii) excluding the control for assessed care need; (iv) using survey weights (available only for 2017 and 2022) to account for variation in response rates and sampling over time; (v) comparing individuals in the top quartiles of income and wealth, respectively, to those in the bottom quartile (excluding respondents in the middle of the distribution); and (vi) pooling data across all survey years. Last, for the models in Table 2, we examined changes over time in individual ASCOT domains. Our findings and conclusions remained robust across all these supplementary specifications.
Discussion
As a consequence of population ageing, Nordic welfare states have increasingly shifted towards neoliberal principles in LTC services over the past two decades. In Denmark, this shift included the involvement of private providers in municipally financed LTC – a change that facilitated the establishment of a private care market. In parallel, public LTC services declined, leading to more vulnerable older adults receiving fewer hours of publicly financed care services (Foged and Houlberg Reference Foged and Houlberg2023). Against this backdrop, this study asked if inequities in a central outcome of care – Social Care-Related Quality of Life, SCRQoL – between service users with and without social and financial resources have increased over the past decade.
Overall, the evidence for a positive association between financial and social resources and SCRQoL is mixed. Some resources, such as having a partner or child(ren) or high income or wealth, show no consistent association, whereas others – frequent contact with friends and high financial satisfaction – are positively associated with SCRQoL. Physical functioning and health also show strong positive associations, consistent with research linking economic, interpersonal and physical wellbeing across the lifecourse to emotional wellbeing in later life (Mirowsky and Ross Reference Mirowsky, Ross, Scheid and Brown2010).
Inequity in SCRQoL among Danish service users remained limited and stable throughout the study period, yet overall SCRQoL declined across all users. Although we controlled for care needs using a comprehensive set of measures – including age, self-rated health, functional limitations and assessed care need – this decline may reflect worsening health among service users that our data do not capture, deteriorating home-care services or both. While equity – a core feature of universalism – has been maintained, other key features, such as comprehensive coverage and high-quality services, appear at risk (Foged and Houlberg Reference Foged and Houlberg2023; Amilon et al. Reference Amilon, Lauritzen and Christensen2024). These findings suggest that universalism in publicly financed LTC is under pressure in Denmark. Continued erosion of high-quality, widely accessible services could ultimately undermine public support for the model itself (Green-Pedersen and Jensen Reference Green-Pedersen and Jensen2025).
We found little overall evidence that service users drew more heavily on their social and financial resources to offset reductions in publicly financed LTC, with some variation across specific resources.
Focusing on social resources, cohabitation or having children showed no systematic benefits for SCRQoL. Although cross-national comparisons are complicated by differences in samples, measures and policy contexts, existing evidence on the interaction between publicly financed and informal care in broadly comparable welfare states is mixed. For instance, family carers contribute substantially to total care received (from all sources) in Norway (Motel-Klingebiel et al. Reference Motel-Klingebiel, Tesch-Roemer and Von Kondratowitz2005) and have been found to partly offset reductions in public provision in Sweden (Larsson et al. Reference Larsson, Kåreholt and Thorslund2014), whereas in the Netherlands, cuts to publicly financed care have not been compensated by increased informal provision (Abbing et al. Reference Abbing, Suanet and Broese van Groenou2023).
This mixed evidence underscores that the extent to which informal care compensates for reductions in public provision remains an open empirical question. In this context, our findings suggest that, within Denmark, there is limited evidence that access to close family networks translates into higher SCRQoL when public provision declines.
Accordingly, our results suggest that the effectiveness of ‘re-familization’ policies, promoted in several European countries (e.g. the Netherlands, Norway and Finland; Rostgaard et al. Reference Rostgaard, Jacobsen, Kröger and Peterson2022; Abbing et al. Reference Abbing, Suanet and Broese van Groenou2023), is likely to depend on contextual factors, including preferences for formal care and the availability of potential care-givers. In comprehensive welfare states, strong preferences for formal services, combined with limited availability of family carers due to high labour force participation, may constrain the extent to which such strategies can be implemented in practice.
In contrast, frequent contact with friends was positively associated with SCRQoL. Consistent with Forder et al. (Reference Forder, Vadean, Rand and Malley2018), we observed positive associations, particularly for the participation domain. Unexpectedly, we also found positive associations for accommodation and dignity. Given that Danish older adults rarely receive practical or personal care from friends (Amilon et al. Reference Amilon, Casier and Røgeskov2019, 54), these findings likely reflect indirect effects, such as socializing being easier when homes are well maintained and dignity preserved. Nonetheless, the results underscore the broader importance of social contacts for maintaining quality of life in old age.
Considering financial resources, we find that financial satisfaction – but not objective measures of income and wealth – was positively associated with SCRQoL. Subjective financial satisfaction may be a more accurate proxy of consumption potential than income or wealth, since higher-income individuals often face higher expenses and lower replacement rates at retirement. Nevertheless, while financial satisfaction was associated with overall SCRQoL in 2012 and 2017, our hypotheses about domain-specific associations were not supported. Taken together, our findings do not indicate that differences in financial resources translate into higher SCRQoL, which might be expected if service users were systematically supplementing public provision with privately purchased care. Our results align with Abbing et al. (Reference Abbing, Suanet and Broese van Groenou2023), who found no evidence of increasing reliance on privately financed services in the Netherlands, and with research showing that housing wealth does not necessarily translate into higher consumption in old age (Browning et al. Reference Browning, Gørtz and Leth‐Petersen2013).
The absence of differences in SCRQoL by financial resources therefore suggests that older adults may be reluctant to purchase private services. Having lived their lives within a universalistic welfare regime, many perceive LTC to be a state responsibility rather than a private matter (Esping-Andersen Reference Esping-Andersen1990; Anttonen and Sipilä Reference Anttonen and Sipilä1996). Strong egalitarian norms reinforce this perception, as private supplementation may be seen as ‘queue-jumping’ or undermining social solidarity (Szebehely and Meagher Reference Szebehely, Meagher, Szebehely and Meagher2013). Furthermore, the private care market in Denmark is relatively new and underdeveloped (Szebehely and Trydegård Reference Szebehely and Trydegård2012), and older service users may lack both familiarity with and trust in market solutions. A further explanation lies in older adults’ reluctance to draw on assets, driven by precautionary savings motives or the wish to leave an inheritance (De Nardi et al. Reference De Nardi, French and Jones2016).
Finally, consistent with previous research (Malley et al. Reference Malley, D’Amico and Fernandez2019) we find a strong positive association between health, functional capacity and SCRQoL. This highlights the potential of interventions such as reablement, which support functional ability (Buma et al. Reference Buma, Vluggen, Zwakhalen, Kempen and Metzelthin2022), as key strategies for maintaining quality of life even under constrained public resources.
Limitations
This study has six key limitations. First, our analysis relies primarily on survey data, limiting our sample to service users able to participate in a phone or face-to-face interview. This resulted in a relatively modest sample size, reducing statistical precision and producing large standard errors, which may make it more difficult to detect resource-based inequities. However, when observations were pooled across survey years, the results remained consistent, suggesting that resource-based inequities were absent for most resources examined, namely having a partner or child(ren) and belonging to the top quartile of equivalized disposable income or wealth.
Second, as LTC services have increasingly targeted the most vulnerable older adults, a larger proportion of service users was likely excluded from our sample in 2022 compared to 2012. This poses a validity concern: if our sample primarily includes the most resilient service users within an increasingly vulnerable population, we may underestimate the decline in SCRQoL and resource-related inequities. To address this issue, we (i) included a comprehensive set of controls for service users’ care needs, minimizing the risk that changes in sample composition (and in underlying care needs) drive the results, and (ii) conducted a sensitivity analysis using population weights based on comprehensive registry data. Although these weights were only available for the last two waves – where response rates were lowest – this analysis produced similar results. While unobserved differences in functioning and care needs cannot be fully ruled out, these sensitivity analyses suggest that the potential increasing exclusion of the most vulnerable older adults did not significantly bias our findings.
Third, other changes during the study period, such as the Covid-19 pandemic, may have influenced our results. Although all restrictions had been lifted by the time of data collection, the pandemic may have reduced service users’ social interactions and willingness to purchase private services, as this may involve allowing additional care providers into their homes. If so, our analysis may underestimate resource-based inequities.
Fourth, in the absence of Danish preference weights, we relied on UK weights to calculate the total ASCOT score. Relative preferences for the eight domains may differ across cultural contexts, implying that the total score may not fully capture Danish service users’ SCRQoL. However, our primary focus is on comparing SCRQoL between older adults with and without resources. This comparison is less likely to be biased by the use of UK weights as any distortions are likely to affect both groups in a similar manner.
Fifth, the unexpected findings regarding having a partner or children may reflect measurement limitations. We lack information on the partner’s health, which is relevant given that most service users are older women whose partners may also require care – potentially adding strain rather than support (Anker‐Hansen et al. Reference Anker‐Hansen, Skovdahl, McCormack and Tønnessen2018). While children often assist older adults in Denmark (Baureis Hansen and Veliovits Reference Baureis Hansen and Veliovits2024), their support typically involves transportation, finances and administrative tasks (KMD 2018; Amilon et al. Reference Amilon, Casier and Røgeskov2019; Marselisborg Consulting 2023) – assistance not directly captured by the ASCOT domains. Moreover, our measure captures only whether respondents have children, not whether they provide support, limiting its explanatory value.
Sixth, this study focuses exclusively on service users receiving publicly financed LTC. Meanwhile, the group not granted such services has grown and increasingly reports health problems and ADL limitations (Amilon et al. Reference Amilon, Lauritzen and Christensen2024). Examining their SCRQoL – and potential resource-based inequities – remains an important direction for future research.
Conclusions
Current pressures on public LTC systems – including population ageing and recruitment challenges – are expected to intensify in the coming years, creating a systemic trade-off in Denmark and similar welfare states: either continued retrenchment in public provision, with potential declines in SCRQoL, or a greater reliance on individual resources, with a risk of widening inequities.
Against this backdrop, although SCRQoL has declined, we find little evidence of systematic inequities between service users with differing social and financial resources, nor that such inequities have increased over time. Despite being wealthier than previous generations, older adults do not appear to translate financial resources or family networks into higher SCRQoL. Instead, they continue to rely on the universalistic care model.
By contrast, SCRQoL is strongly associated with functional capacity and social contact with friends, suggesting that quality of life in later life is more closely linked to these factors than to income, wealth, or family status. The scope for shifting responsibility towards families or private markets therefore appears limited. Policies that support functional ability, social inclusion and independence are therefore likely to be central to sustaining SCRQoL.
Supplementary material
The supplementary material for this article can be found at https://doi.org/10.1017/S0144686X26101020
Author contributions
Anna Amilon was involved in conceptualization, writing of the original draft as well as review and editing, supervision and project administration. Mads Lybech Christensen was involved in methodology, formal analysis, data curation, review and editing of the draft, and visualization.
Financial support
This research did not receive any specific grant from funding agencies in the public, commercial or not-for-profit sectors.
Competing interests
The author(s) declare none.
Ethical standards
The authors used generative AI tools (ChatGPT version 4) to proofread and edit the language of this manuscript. All suggested changes were carefully reviewed by the authors.