


Most people are unfit for self-governance: Scholars since Thucydides have expressed this fear, and social science has done more to confirm it than to allay it. Two findings seem to especially impeach the public's fitness for democracy. The first is that most people are “awash in ignorance” of politics (Kinder Reference Kinder, Gilbert and Fiske1998, 785–89). Their ignorance of policy is especially acute (Delli Carpini and Keeter Reference Delli and Keeter1996, 79–86; Lewis-Beck et al. Reference Lewis-Beck, Jacoby, Norpoth and Weisberg2008, 177–81). The second finding is that most people conform readily to the wishes of authority figures even when those wishes are extreme (Browning Reference Browning1992; Milgram Reference Milgram1974). This latter finding has a cousin in research showing that party identification powerfully shapes people's views and that its effects are strongest among the best informed (Green, Palmquist, and Schickler Reference Green, Palmquist and Schickler2002, chap. 8, Zaller Reference Zaller1992). Collectively, these findings have helped to give rise to a common claim about the way democracy really works: Even when people know about important attributes of policies, they neglect that knowledge and mechanically adopt the positions of party leaders as their own.
No one believes that this claim holds true for everyone. And some disagree that it holds on average in the American electorate (e.g., Key Reference Key1966; Nie, Verba, and Petrocik Reference Nie, Verba and Petrocik1976). But the modern student of public opinion cannot escape the claim that cue-based processing of messages about policy “predominates” over evaluation of their content (Iyengar andValentino Reference Iyengar, Valentino, Lupia, McCubbins and Popkin2000, 109). Citizens “neglect policy information in reaching evaluations” even when they are exposed to it; instead, they “use the [party] label rather than policy attributes in drawing inferences” (Rahn Reference Rahn1993, 492). And even when “citizens are well informed, they react mechanically to political ideas on the basis of external cues about their partisan implications” and “typically fail to reason for themselves about the persuasive communications they encounter” unless those communications are extremely clear (Zaller Reference Zaller1992, 45). Cohen (Reference Cohen2003) summarizes this view in the title of his article on political decision making: “Party over Policy: The Dominating Impact of Group Influence on Political Beliefs.”
From a normative standpoint, this claim is dour. Facts about policy are the “currency of democratic citizenship” (Delli Carpini and Keeter Reference Delli and Keeter1996, 8–11), and traditionally, the greatest concern about elite influence on public opinion has been that it causes people to hold positions that they would not hold if they knew more facts (e.g., Kuklinski and Hurley Reference Kuklinski and Hurley1994). But if people ignore facts about policy even when exposed to such facts, there is little reason to expect that facts will help them to make better decisions or protect them from manipulation by elites.
In spite of numerous claims about the relative influence of policy attributes and position-taking by party elites, direct evidence is slight because few studies directly compare the effects of these variables. Those that do make such comparisons use policy descriptions that are short and vague—for example, “decrease services a medium amount.” This article presents two studies that permit comparison of party-cue effects to the effects of more substantial policy descriptions. Of course, people often express their views without prior exposure to relevant policy details. But much interest hinges on how party cues and policy details would influence people if they were exposed to more than a few of the latter. Examining that counterfactual condition is the point of this article.
The results suggest that position-taking by party elites affects even those who are exposed to a wealth of policy information. But—contrary to some previous claims—the effects of such position-taking are generally smaller than the effects of policy information. The experiments also include extensive measures of the attention that subjects pay to policy, and they suggest that when people are exposed to both party cues and policy information, the cues do not reduce their attention to the information. If anything, they enhance it. To the extent that party cues have large effects in nonexperimental settings, it may be because citizens often know nothing else about the policies and candidates that they are asked to judge.
I begin by reviewing theory and evidence about the effects of policy information and party cues. The next two sections introduce experiments that permit direct comparison of these effects. The following section revisits previous studies in light of the findings from these experiments. Both previous studies and those reported here are rooted in American politics, and the next section considers what we can learn from relevant research in other countries. The final section concludes with suggestions for future research.
THEORY AND PRIOR EVIDENCE
A cue is a message a datum that people may use to infer other information and, by extension, to make decisions. Party cues come in two forms. They may reveal a party affiliation: “Obama is a Democrat.” Or they may link a party to a stand on an issue: “The Republicans voted for tax cuts.” Policy information is explicitly about the provisions and immediate consequences of policies: “this legislation will loosen Medicaid eligibility standards” or “that bill will increase co-payments for Medicaid recipients.” People often use party cues to make inferences about policies, but party cues are not themselves policy information in the sense intended here.Footnote 1
Many studies have considered the effects of cues and information on voters' views. For example, one line of research asks how general knowledge of politics moderates the connection between values and vote choice (e.g., (e.g., Althaus Reference Althaus2003, pt. 2; Zaller Reference Zaller1992). Another asks whether cues lead voters astray or help them to act as though they were informed (e.g., Cutler Reference Cutler2002; and Quirk 2000; Lau and Redlawsk Reference Lau and Redlawsk2006; Lupia and Kuklinski McCubbins Reference Lupia and McCubbins1998). But research on the specific effects of party cues is relatively rare; I return to this point later in the text. And general political knowledge, while correlated with exposure to descriptions of policy, is a different variable. Most importantly, little of this research speaks directly to the question at hand, which is about the relative effects of party cues and policy descriptions on people who are exposed to both.
That said, there is a prominent generalization about people who are exposed to both types of information: They will be far more affected by party cues. Thus, Rahn (Reference Rahn1993, 492) writes that people “use the [party] label rather than policy attributes” even when exposed to such attributes. Cohen (Reference Cohen2003, 808) contends that even when one knows about important attributes of a policy, one's attitude toward the policy depends “almost exclusively upon the stated position of one's own political party.” McGuire (Reference McGuire, Lindzey and Aronson1969, 198) writes that a citizen is a “lazy organism” who relies heavily on source cues and “tries to master the message contents only when it is absolutely necessary.” And Popkin writes that “the Michigan approach emphasized that no information could be used, even if obtained, when voters identified with a party” (Popkin Reference Popkin1994, 55, emphasis in original). These claims are only weakly qualified: Their scope is typically not limited to particular issues or to particular kinds of people.Footnote 2
But there have always been countervailing claims. Key (Reference Key1966) is adamant that voters are “responsible,” by which he largely means responsive to policy considerations. Erikson, MacKuen, and Stimson (Reference Erikson, MacKuen and Stimson2002) and Ansolabehere, Rodden, and Snyder (Reference Ansolabehere, Rodden and Snyder2008) also mount general arguments about voter responsiveness to policy, while Aldrich, Sullivan, and Borgida (Reference Aldrich, Sullivan and Borgida1989) make the case for responsiveness to policy in foreign affairs. And Butler and Stokes (Reference Butler and Stokes1974, esp. chap. 14) make a qualified argument that party ID itself is influenced by policy preferences. These views imply a public whose policy views are more than adjuncts to partisan feeling. They are hard to reconcile with the claim that people's policy attitudes depend “almost exclusively” on messages from party elites.
Claims about the relative power of party cues and policy information are often grounded in dual-process theories of attitude change. These theories hold that persuasion can occur through “systematic” or “heuristic” information processing (Eagly and Chaiken Reference Eagly and Chaiken1993; see also Petty and Cacioppo Reference Petty and Cacioppo1986). Systematic processing is effortful; it entails checking messages for internal consistency and against one's existing stock of knowledge. Heuristic processing is passive; it occurs through the use of simple decision rules rather than through evaluation of policy content. Dual-process theories imply that heuristic processing is more likely when people lack motivation or ability to scrutinize the messages that they receive. This suggests that party cues will have greater effects on policy attitudes: Cues are widely thought to be processed heuristically (e.g., Kam Reference Kam2005; Rahn Reference Rahn1993), but few people are motivated to scrutinize information about policies, and fewer still possess the knowledge that is typically required to evaluate arguments about policies Converse Reference Converse2000; Delli Carpini and Keeter Reference Delli and Keeter1996).
A further claim is that party cues reduce attention to policy information even among people who have been exposed to it. This claim is consistent with research on cues as “information shortcuts,” but most of that research focuses on whether cues make people less likely to seek information about policy, not on whether cues make people less likely to use information that they already have (e.g., Downs Reference Downs1957, chaps. 11–12; Popkin Reference Popkin1994, chaps. 2–3). Cues might reduce attention to policy—even when people have descriptions of policy in hand—because they permit people to be confident of their views with less effort (Petty and Cacioppo Reference Petty and Cacioppo1986) or because they are clearer guides than policy content to ingroup-consistent views (e.g., Kruglanski and Webster Reference Kruglanski and Webster1996, 264–65; Mackie, Gastardo-Conaco, and Skelly Reference Mackie, Gastardo-Conaco and Skelly1992, 145–46, 150). The implications are the same in either case: Party cues will lead people to be less affected by policy information, and perhaps to be affected in the wrong ways by superficial understandings of policies.
While dual-process models suggest that cue effects may outweigh policy effects, they also suggest that the weight of these influences on any particular person depends on personal characteristics. Notably, the dual-process emphasis on motivation suggests a moderator: “need for cognition,” the extent to which people enjoy thinking. Because need for cognition is a stable disposition, it is a poor measure of cognitive effort in any particular situation. People low in need for cognition sometimes scrutinize messages, and people high in need for cognition often give them little thought. Still, people do vary in their general tendency to think systematically, and need for cognition captures this variation (Cacioppo et al. Reference Cacioppo, Petty, Feinstein and Jarvis1996). The straightforward prediction is that people who are high in need for cognition should be more affected by policy information, which require a modicum of thinking to evaluate. A second hypothesis, somewhat less straightforward, is that people who are high in need for cognition should be less affected by party cues. Later, I consider the evidence for these claims.
In spite of dual-process-based reasons to expect that party-cue effects generally outweigh policy effects, the evidence is equivocal. Exposure to party cues is difficult to measure in nonexperimental studies. And comparing the effects of party cues to those of policy when people are exposed to both requires research designs that expose people to both types of stimuli. Only six published studies (discussed later) fit this description, and they vary on several important dimensions. The most significant variation may lie in their findings: Across the six studies, party cues have average effects on attitudes of between 3% and 43% of the range of the attitude scales. Policy-information manipulations have average effects of between 1% and 28%. Variation this great makes generalization difficult.
That said, there are two important respects in which these studies vary little. One is the amount of policy information provided to subjects. Of the six studies in which both policy and party cues are manipulated, five provide no more than three-sentence descriptions of policies, and the sixth offers one to two short paragraphs. The most typical policy descriptions in these studies are brief and vague: for example, “increase the economic status of women” (Riggle et al. Reference Riggle, Ottati, Wyer, Kuklinski and Schwarz1992, 76) or “decrease services a medium amount” (Tomz and van Houweling Reference Tomz and van Houweling2009, 88). Variation on this dimension is relevant because systematic processing is thought to be more likely when people are exposed to messages that are detailed and unambiguous (Chaiken and Maheswaran Reference Chaiken and Maheswaran1994; Petty et al. Reference Petty, Schumann, Richman and Strathman1993). The relative influence of cues from party elites may therefore depend on variation along this dimension.
A second respect in which prior studies vary little is their reliance on highly indirect measures of depth of processing. For example, subjects in Mackie, Gastardo-Conaco, and Skelly (Reference Mackie, Gastardo-Conaco and Skelly1992) read a message containing a “strong” argument about an issue. If they later agree with the argument, they are assumed to have processed the message systematically. If they disagree, they are assumed to have processed it heuristically. The possibility that subjects might think intently about the argument and yet disagree with it is ruled out by assumption. Similarly indirect inferences about depth of processing are common in political research (Kam Reference Kam2005; Rahn Reference Rahn1993).Footnote 3 But without more direct measures, it is hard to be confident that cognitive effort is affected by exposure to cues.
Measures of stable traits—for example, political sophistication and need for cognition—are more common (e.g., Kam Reference Kam2005; Mondak Reference Mondak1993). But because they are stable, they cannot be used to test hypotheses about short-term variation in depth of processing that might be induced by party cues. Moreover, the record of need for cognition—the best-established measure of the tendency to think systematically—is puzzling. In the only previous test of the connection between need for cognition and party-cue influence, Kam (Reference Kam2005) finds no moderating effects. This result is compatible with Bizer et al. (Reference Bizer, Krosnick, Holbrook, Petty, Rucker and Wheeler2002) and Holbrook (Reference Holbrook2006), whose analyses of American National Election Studies data suggest that need for cognition does not moderate the effects of policy information. But it is difficult to reconcile any of these results with psychological studies suggesting that need for cognition moderates the influence of source cues and other kinds of messages(e.g., Cacioppo et al. Reference Cacioppo, Petty, Feinstein and Jarvis1996).
This article presents two experiments that isolate the effects of both policy descriptions and position-taking by party elites. In each experiment, subjects read about a debate modeled on the heated 2005 debate in Missouri over health care for the poor. Each experiment exposes subjects to substantial policy information and contains direct measures of processing depth. Together, the experiments permit direct evaluation of the claim that party cues outweigh the effects of policy information among people who are exposed to sizable amounts of the latter. They also permit evaluation of the extent to which party cues reduce attention to policy information.
EXPERIMENT 1
Subjects, all partisans, received a detailed newspaper article about health care for the poor in Wisconsin. It contrasted the existing health-care regime with changes that had just been passed by the state House of Representatives. It also offered arguments from supporters and opponents of the changes. The supplemental online Appendix (available at http://www.journals.cambridge.org/psr2011009) includes a summary of the arguments and the text of each version of the article.
The experiment included a manipulation of policy: Subjects were randomly assigned to read that the proposed changes would expand or curtail health-care benefits. It also included a manipulation of party cues: Some subjects received no party cues, while others were told that Democratic legislators either supported or opposed the policy changes. In these last two cue conditions, Republican legislators opposed their Democratic counterparts. Table 1 summarizes the experimental design.
Design of Experiment 1

Note: Experiment 1 had a 3 × 2 factorial design. Each subject read about legislation that would expand or reduce state-provided health-care benefits. In the “Democrats support” condition, Democratic legislators supported the changes while Republican legislators opposed them. In the “Democrats oppose” condition, Democratic legislators opposed the changes while Republican legislators supported them. In the “no cues” condition, subjects read about support for and opposition to the proposed changes, but the positions were not linked to political parties.
Participants, Design, and Procedure
A nonprobability sample of 2,473 subjects who had previously identified as Democrats or Republicans were recruited by Survey Sampling International to participate in a study of reactions to “news media in different states.” Of these, 50% identified with the Democratic Party and 50% with the Republican Party. The study was fielded from December 16, 2008 through December 26, 2008.
The SSI sample appears to resemble the population of U.S. partisans in most respects, including age, gender, and region of residence. (See Figure A1 of the online Appendix.) The outlier, as with most Internet samples, is the proportion of people who report having no post-high-school education: 19% of the sample age 25 or older fit this description, against 41% of American partisans age 25 or older. But the online Appendix shows that subjects' median level of education is identical to the median of all U.S. partisans, and it suggests that low-education subjects are more affected by policy descriptions when exposed to them. (See Figure A2, which also suggests that party-cue effects are approximately equal for low- and high-education subjects.) In short, the sample's nonrepresentativeness on education is not likely to affect the analyses sharply. And to the extent that it does affect them, it probably causes them to understate the power of policy descriptions.
All subjects were presented with a newspaper article and asked to read it carefully, “as most of the questions that follow will be about your reactions to it.”Footnote 4 The article was closely modeled on an Associated Press article about Medicaid cuts that were passed by Missouri's legislature (Lieb Reference Lieb2005). It contained between 627 and 647 words, depending on the condition to which the subject was assigned. This makes it longer than the average article in low-circulation newspapers but shorter than the average article in high-circulation newspapers (Project for Excellence in Journalism 2004).Footnote 5 As with the Associated Press article, much of the article that subjects read was devoted to the policy provisions of the bill that the legislature was considering.
Policy Treatment. The status quo health-care policy was held constant across all versions of the article. It provided coverage for single parents of two if they earned less than $1,334 per month. Under it, Medicaid costs had tripled in the past twelve years, and they accounted for nearly one-third of Wisconsin's budget at the time of the article's publication. The status quo was contrasted with changes that would either restrict or expand health care for the poor. In one condition, changes would reduce coverage for 100,000 of the state's one million Medicaid recipients by tightening eligibility standards. In another, changes would increase coverage for the same number of recipients by loosening eligibility standards. For brevity, these conditions are here labeled the “conservative” and “liberal” policy conditions; they were not so labeled in the articles that subjects read. The article included many more details about the status quo and the proposed alternatives, e.g., details about co-payments and disability coverage. Table A2 of the online Appendix provides an extensive summary.
Party-cue Treatment. In the first paragraph of every article, the proposed changes were said to have passed the House by an 87–71 vote. In one condition, the parties were not identified. In another, 90% of Democratic legislators supported the proposed policy changes, whether liberal or conservative; 90% of Republican legislators opposed the changes. In the final condition, 90% of Democratic legislators opposed the proposed policy changes, whether liberal or conservative; 90% of Republican legislators supported the changes. For brevity, these last two conditions are here labeled “Democrats legislators support” and “Democrats legislators oppose.” They were not so labeled in the articles that subjects read, which gave equal attention to the stands of each party.
Post-treatment measures. After reading the article, subjects reported their attitudes toward the policy changes on a seven-category scale ranging from “disapprove strongly” (coded as 1) to “approve strongly” (coded as 7). They also answered three factual questions about the policy; these questions were designed to test whether subjects had paid attention to the article. Finally, they answered six items designed to measure need for cognition, all derived from similar items that had high factor loadings in the battery developed by Cacioppo, Petty, and Kao (Reference Cacioppo, Petty and Kao1984). These items formed a reliable battery (α =.81) and were summed and rescaled to form an index that ranges from 0 to 1. The text of all items is reported in the online Appendix.
Randomization Checks. By chance, a greater proportion of Democrats than Republicans was assigned to the conservative policy condition (54.9% against 48.1%). Because the effects of party cues and policy are analyzed separately for members of each party, this difference does not affect the results reported in the next section. Success of random assignment to the party-cue condition was gauged by regressing it on assignment to policy condition (liberal or conservative), age, education, gender, and region of residence. Similarly, assignment to the policy condition was regressed on party-cue condition, age, education, gender, and region. The χ2 statistics from these regressions were small, suggesting that the randomizations worked as intended. (Results from each regression are reported in the online Appendix.)
Results
Figure 1 presents the main results. As expected, Democrats were more supportive of liberal policy changes when Democratic legislators supported them (mean attitude rating = 5.15) and less supportive when Democratic legislators opposed them (M = 4.64); the difference is significant at p = .004, one-tailed. (Because there are clear expectations about the directions of cue effects, significance tests for such effects are one-tailed unless otherwise noted.) Similar patterns emerge—in the opposite directions, of course—for Republicans reading about liberal changes. They were less supportive when Republican legislators opposed the changes (M = 3.42); more supportive when Republican legislators supported the changes (M = 4.48). This difference, too, is unlikely to have occurred by chance (p < .001).
Effects of Cues and Policy Direction

The patterns held when subjects read about conservative policy changes. Democrats were more supportive of the conservative changes when Democratic legislators supported the changes (M = 2.45) than when Democratic legislators opposed the changes (M = 2.05). And Republicans were more supportive of the conservative changes when Republican legislators supported those changes (M = 3.42), less supportive when Republican legislators opposed the changes (M = 2.77). These differences, too, are unlikely to have occurred by chance (p = .004 and p < .001, respectively). It appears, then, that party cues affect even those who are exposed to a wealth of information about a specific policy. But how much?
By conventional standards, not much. The largest effect of party cues is depicted in the upper right-hand corner of Figure 1: Republicans reading about liberal policy changes had a mean attitude of 4.48 when Republican legislators supported those changes, 3.42 when Republican legislators opposed those changes. This is a shift of 18% on the 1–7 attitude scale—sizable but not extraordinary. And as the left-hand panel of Figure 2 shows, the average effects of party cues are smaller. The mean absolute attitude change caused by exposing subjects to “Democratic legislators support” cues rather than “Democratic legislators oppose” cues is 0.65 points, or 11% of the range of the seven-point attitude scale. This is substantial, but it is swamped by the average absolute effect of exposing subjects to details about a liberal rather than a conservative policy: 1.68 points, covering 28% of the scale. Note that the average difference caused by changes in policy (1.68) exceeds even the greatest difference caused by a change in cues (4.48 - 3.42 = 1.06).Footnote 6
Mean Attitude Differences by Changes in Party Cues, Party ID, and Policy

The average effects depicted in the left-hand panel of Figure 2 mask differences between Democratic and Republican subjects. Among Democratic subjects, the average effect of exposure to the “Democratic legislators support” cues instead of the “Democratic legislators oppose” cues was 0.45 points on the 1–7 scale; among Republican subjects, it was 0.85 points. The partisan difference in policy effects was starker: 2.64 points for Democratic subjects against 0.71 for Republican subjects. These differences were unexpected; Experiment 1 was not designed to investigate differences between Republicans and Democrats and cannot shed much more light on them. I revisit this finding in the discussion of Experiment 2.
On average, Republicans disapproved of both the liberal and the conservative policies. But they disapproved less of the liberal policy. The right-hand panels of Figure 1 make this clear: Averaging over all cue conditions, the mean Republican attitude toward the liberal policy is 3.79; for the conservative policy, it is 3.09. (For the difference, p < .001, two-tailed.) This result does not speak directly to the influence of party cues or policy information, but in light of Republican opposition to the national health-care plan that was enacted in March 2010, it is striking. I return to it in the discussion of Experiment 2.
Need for Cognition. Although the preceding analyses distinguish between Democratic and Republican subjects, they still conceal much variation in policy attitudes. For example, the median Democratic rating of the “liberal” policy changes was “somewhat approve” when Democratic legislators supported these changes, but fully 21% of Democratic subjects disapproved of the policy. Similarly, the median Republican rating of the policy changes under the same conditions was “slightly disapprove,” but 17% of Republican subjects approved “somewhat” or “strongly.”
To better understand this diversity of responses, I consider the effects of need for cognition by estimating the model

“Policy attitude” is scored from 1 to 7, where higher values indicate more positive attitudes toward the proposed policy changes. “Democratic legislators support,” “Democratic legislators oppose,” and “liberal policy changes” are scored 1 for subjects who were assigned to these conditions, 0 for other subjects. Need for cognition is scaled to range from 0 to 1. And  is a vector of disturbances.
Table 2, which reports OLS estimates of the model, shows that need for cognition moderated party-cue effects only inconsistently (consistent with Kam Reference Kam2005) but that it heavily moderated policy effects. The estimated coefficient of “liberal policy changes × need for cognition” represents the expected effect of a shift from the low to the high extreme of need for cognition among those who read about liberal policy changes, net of the effect that would have been expected under any circumstances from the increase in need for cognition. This effect is stronger among Republicans than among Democrats, but in both cases it is large and of the expected sign: among Democrats, it increases approval of liberal policy changes ( = 0.95, p = .03); among Republicans, it decreases approval ( = −2.27, p < .001).Footnote 7
Need for Cognition Moderates the Effects of Policy in Experiment 1

Note: Each column reports OLS estimates and standard errors for the coefficients in Equation (1). The dependent variable is attitude toward the proposed policy changes, which is measured on a seven-point scale; higher values indicate a more positive attitude. The party-cues variables (“Democratic legislators support” and “Democratic legislators oppose”) and the policy variable (“Liberal policy changes”) are scored 0 or 1. Need for cognition ranges from 0 to 1. The interactions in the last row of estimates suggest that need for cognition strongly moderates the effects of policy. It does not consistently moderate the effects of party cues. These patterns hold under other model specifications: see Table A4 of the online Appendix.
Although need for cognition moderates policy effects for both Democrats and Republicans, it does so in opposite ways. It makes Democrats more responsive to policy: Ceteris paribus, the estimated effect of a change from the conservative to the liberal policy is 2.09 points for Democrats lowest in need for cognition, 3.04 points for Democrats highest in need for cognition. This is the result predicted by dual-process theory. But need for cognition makes Republicans less responsive to policy: The estimated effect of switching from the conservative to the liberal policy is 2.09 points (again) for Republicans lowest in need for cognition but only −0.18 points for those who are highest. Further inspection shows that this result holds across all three cue conditions. (See Table A4 in the online Appendix.) This result was unexpected. Like the finding that Democrats are more responsive than Republicans to policy in Experiment 1, this is a case in which partisan differences in political cognition merit further study.Footnote 8
Moderation of policy effects by need for cognition is consistent with apolitical findings from social psychology (e.g., Cacioppo et al. Reference Cacioppo, Petty, Feinstein and Jarvis1996), but it is at odds with a raft of studies which suggest that the variable plays no role in thinking about politics. For example, Bizer et al. (Reference Bizer, Krosnick, Holbrook, Petty, Rucker and Wheeler2002) argue that need for cognition does not moderate the effect of issue information on candidate preference. Holbrook (Reference Holbrook2006) argues that it does not affect respondents' ability to explain their support for the candidates whom they prefer. And Napier and Jost (Reference Napier and Jost2008) maintain that it does not moderate the effects of liberalism or party ID on happiness (even as they maintain that these effects are substantial). Kam (Reference Kam2005, 175) suggests that need for cognition is too apolitical to play a role in political information processing, a conclusion echoed in part by Holbrook (Reference Holbrook2006, 349–50). Bizer et al. (Reference Bizer, Krosnick, Holbrook, Petty, Rucker and Wheeler2002, 25) infer that “a greater inclination to be thoughtful is not an inspiration for ideal democratic behavior.”
The results presented here suggest a different interpretation: Need for cognition seems more effective in this experiment because it is measured more reliably here. Bizer et al. (Reference Bizer, Krosnick, Holbrook, Petty, Rucker and Wheeler2002), Holbrook (Reference Holbrook2006), and Napier and Jost (Reference Napier and Jost2008) build a need-for-cognition index from only two ANES items, and Cronbach's α for the items is .61 (Bizer et al. Reference Bizer, Krosnick, Holbrook, Petty, Rucker and Wheeler2002, 16). Kam uses the same two items in a study for which α = .48 (Kam Reference Kam2005, 179). But in Experiment 1, the need-for-cognition battery comprises the two ANES items and four others, and α = .81, suggesting that the larger battery is doing a better job of tapping a single dimension. And when the models from Table 2 are reestimated with only the standard two-item measure of need for cognition, its estimated effect declines by 20% for Republican subjects, by more than 50%—and into statistical insignificance—for Democratic subjects.
Depth of Processing. The need-for-cognition results described in the preceding text do not speak to the claim that party cues cause people to think less about policy. Other measures collected in Experiment 1 do speak to the claim. If people pay less attention to policy once they are exposed to cues, they should recall fewer details about policy. And the effects of policy information on attitudes should decline. These patterns do not appear in the data—suggesting that exposure to cues does not limit thinking about policy content among people who have been exposed to such content.
Consider first subjects' ability to recall policy details. Subjects were asked whether the policy would expand or reduce Medicaid benefits, to state the maximum amount that single parents of two would be able to earn while remaining eligible for benefits, and to state the number of Medicaid recipients at the time that the bill was being considered. If cues reduce attention to policy, subjects who received cues should answer these questions less well than subjects who did not. But in this experiment, cues had no obvious effect on recall: The average number of facts recalled was 1.63 out of 3 among uncued subjects, 1.61 among cued subjects (p = .37).
If cues reduced attention to policy, we might also expect them to reduce the effects of policy on attitudes. But inspection of Figure 1 shows that cues did not operate in this manner. Among Democrats, the average effect of a switch from reduction to expansion of health-care benefits was 2.64 points on the seven-category attitude scale among those who received cues, 2.64 points again among those who did not. Among Republicans, the average effect of the same switch was 0.44 points among those who did not receive cues, rising to 0.85 points among those who did receive cues (p = .07, two-tailed). Thus, the data again suggest that cues have little effect on processing of policy content. And if they are affecting it, they are at least as likely to be increasing attention to policy as they are to be reducing it.
Experiment 1 thus indicates that subjects exposed to both party cues and policy descriptions were never “predominated” by the cues. Contrary to bold claims about the relative power of party cues and policy information (see pages 2 and 4), subjects always responded to the policy information that they received. Indeed, Republican subjects were affected almost as much by policy as by party cues, and Democratic subjects were far more affected by policy. Moreover, Experiment 1 suggests that cues do not reduce attention to policy information when people are exposed to such information. That said, these are findings from only one experiment, and they do not show all that one might like. In particular, the policies described in Experiment 1 were very distinct. Policy considerations may matter less when the contrast between policies is smaller. The depth-of-processing measures were also not as direct as one might wish, leaving open the possibility that better measures would show that cues do reduce attention to policy. Experiment 2 speaks to these concerns.
EXPERIMENT 2
Experiment 2 followed the form of Experiment 1, but it included more direct measures of depth of processing, and it varied the extremity of the policies that subjects were asked to consider. The “Democrats support” cue condition was dropped; subjects either received no party cues or “Democrats oppose” party cues. A policy extremity condition was added; subjects were assigned to read about either large or small changes to the health-care status quo. The experiment thus had a 2 × 2 × 2 factorial design: {“Democrats oppose” cues, no cues} × {expand benefits, reduce benefits} × {large changes, small changes}.
Participants, Design, and Procedure
A nonprobability sample of 3,713 subjects who had previously identified as Democrats or Republicans were recruited by Survey Sampling International to participate in a study of reactions to “news media in different states.” None of these subjects participated in Experiment 1. To enhance the statistical power of relevant comparisons, more Republicans than Democrats were recruited: 62% of subjects identified with the Republican Party, 38% with the Democratic Party. The study was fielded from May 17, 2010 through May 28, 2010.
The sample resembles the population of U.S. partisans in most observed respects, including gender, region of residence, and need for cognition. The main outliers are education and age. With respect to education, the sample is more representative than the Experiment 1 sample, but the gap is still sizable: 28% of subjects age 25 or older have no more than a high-school education, against 41% of U.S. partisans age 25 or older. The Experiment 2 sample is also older: 48% of subjects are at least 56 years old, against 32% of U.S. partisans. (See Figure A5 in the online Appendix.) But subjects' median level of education is identical to the median for all U.S. partisans, and Figure A6 suggests that age- and education-based differences between the sample and the population of U.S. partisans are unlikely to sharply affect the analyses.
All subjects received a newspaper article that contrasted a health-care status quo with proposed changes that would expand or reduce benefits. The description of the status quo was unchanged from Experiment 1. Some subjects were assigned to read about large changes to the status quo, and to maximize comparability of results across experiments, these “large-change” policies were the same as the policies described in Experiment 1. But other subjects were assigned to read about small changes to the status quo. For example, the “small-change” policies would directly affect about 10,000 Medicaid recipients rather than the 100,000 affected under the large-change plan, and income cutoffs for Medicaid eligibility would increase 21% under the liberal small-change plan, as opposed to 64% under the liberal large-change plan. The online Appendix provides an extensive summary of policy differences between conditions.
To conserve statistical power, the “Democrats support” cue condition—the weaker cue condition in Experiment 1—was eliminated. Subjects were assigned to either a no-cue condition or a “Democrats oppose” condition.
Post-treatment Measures. Experiment 2 included the post-treatment measures that were used in Experiment 1, and several measures were added to better gauge subjects' attention to the article that they received. The time that each subject spent on the article was recorded. As in laboratory studies, we cannot know how much time subjects actually spent reading the article; the “time spent” measure reflects the time that subjects' web browsers spent displaying the article before subjects advanced to the next page of the survey. This measure has been used before to gauge depth of processing, albeit more often in psychology (e.g., Parker and Isbell Reference Parker and Isbell2010) than in political science.
After indicating their attitudes toward the policy, subjects were given unlimited time to list their “thoughts about the article and the policy changes that it described.” Two coders, working independently and blind to subjects' experimental conditions, read the responses to this prompt. Following Cacioppo and Petty (Reference Cacioppo, Petty, Merluzzi, Glass and Genest1981), they identified specific thoughts in the responses and coded them as positive, negative, or neutral with respect to the proposed health-care policy. Their ratings were reliable (α = .72, .76, and .91, respectively) and were averaged into a single index for each dimension.
Randomization Checks. The success of each random assignment was gauged by regressing it on the other randomizations, age, education, gender, and region of residence. The χ2 statistics from these regressions were small, suggesting that the randomizations worked as intended. (Results from each regression are reported in the online Appendix.)
Results
Comparison of the main results to those from Experiment 1 suggests a slight conservative trend. On average, Democrats approved of a large expansion of benefits as much as they had in Experiment 1, but they were also 0.25 points more approving of a large reduction in benefits (p = .05). Republicans were 0.16 points less approving of a large expansion in benefits, 0.21 points more approving of a large reduction (p = .22 and p = .15, respectively).Footnote 9 In light of what transpired between the two experiments—the White House changed hands and a massive federal health-care bill was enacted—the absence of stronger attitude change may be more striking than any of the changes that were observed.
Comparing Figure 2 to Figure 3 draws out the consistency of patterns across both experiments. The average absolute effect of switching from a liberal to a conservative policy, taken over both large- and small-change conditions, is 1.24 points, or 21% of the seven-category attitude scale. The average absolute effect of switching from “Democrats oppose” to “Democrats support” party cues cannot be directly calculated because Experiment 2 does not have a “Democrats support” condition. But we can estimate this effect by noting that the average effect of switching from “Democrats support” to “Democrats oppose” in Experiment 1 was 55% greater than the effect of switching from an uncued condition to “Democrats oppose.” (See Figure 2.) Multiplying the effect of “Democrats oppose” cues in Experiment 2 by 1.55 yields an estimate of the cue-switching effect: 0.52 points, or 9% of the attitude scale. This is an important effect, but as in Experiment 1, it is much smaller than the average policy effect.
Mean Attitude Differences in Experiment 2 by Changes in Party Cues, Party ID, and Policy

These overall results again mask large partisan differences. As in Experiment 1, the effect of policy swamps the effects of party cues among Democrats (2.19 points against 0.31 points). But for Republicans, the effects of policy are clearly weaker than the effects of party cues: 0.30 points against 0.73 points, p = .003. This finding is not consistent with the claim that party cues have a “dominating impact” on political beliefs—0.73 points is 12% of the range of the attitude scale—but it is the strongest evidence in support of the claim that is to be found in Experiments 1 or 2.
What of the possibility that Experiment 1 produced large policy effects because the policies in that experiment were so different from each other? Experiment 2 strongly suggests that this explanation is incorrect. The evidence appears in Figure 3: For both Democrats and Republicans, attitudes differed little between the large-change conditions and the corresponding small-change conditions. Sharply reducing the distance between policy alternatives did reduce their effect, but not by much. The average policy effect was 1.46 points in the large-change condition, 1.15 points in the small-change condition (p = .01).
This is not to say that small changes always matter nearly as much as large changes. Perhaps even smaller differences in policy would have mattered much less than the ones presented in Experiment 2. Or perhaps the distance between policies matters less when they are on the same side of the status quo: For example, the distance between two benefit-expanding policies might matter less than the same distance between a benefit-expanding and a benefit-reducing policy. Answers to these questions await future research. What is clear is that a sharp reduction in the scope of the policies described in Experiment 1 did little to reduce the effect of policy descriptions.
Need for Cognition. As in Experiment 1, need for cognition proved a strong moderator of policy effects but a modest moderator of party-cue effects. Table 3 reports OLS estimates of a model very similar to that reported in Table 2. The sole difference is that the “Democratic legislators support” predictor in the previous model is now replaced by a “large policy change” predictor. The results show that need for cognition moderates policy effects among Democrats and Republicans, making Democrats more sensitive to policy considerations but making Republicans less sensitive. It only weakly moderates party-cue effects, and moderation of those effects is not statistically significant for members of either party.Footnote 10
Need for Cognition Moderates the Effects of Policy in Experiment 2

This table mirrors Table 2. Each column reports OLS estimates and standard errors. The dependent variable is attitude toward the proposed policy changes, which is measured on a seven-point scale; higher values indicate a more positive attitude. “Democratic legislators oppose,” “liberal policy changes,” and “large policy changes” are scored 0 or 1. Need for cognition ranges from 0 to 1. The estimates in the “Liberal policy changes × need for cognition” row suggest that need for cognition strongly moderates the effects of policy. It seems to moderate the effects of party cues and policy size (small policy changes vs. large policy changes) only modestly and inconsistently. These patterns hold under other model specifications: see Table A8 of the online Appendix.
Because need for cognition again moderates policy effects, the results again suggest that political scientists have been too quick to dismiss its political relevance. And quality of measurement again seems the most likely explanation for the discrepancy between previous findings and those reported here. When the models from Table 3 are reestimated with only the two ANES need-for-cognition items, the estimated moderating effect of need for cognition on policy content is unchanged for Democrats, but it declines 22% for Republicans.
Depth of Processing. Experiment 1 suggested that party cues do not reduce attention to descriptions of policy when people have such descriptions in hand. But one might expect the results to be different in Experiment 2. Perhaps Experiment 1 was simply anomalous. Even if it was not, a highly partisan debate about health care intervened between the two experiments, and it may have sharpened people's associations of the parties with different sorts of policies. Sharper associations might cause people to infer more about policy from party cues and to spend less effort attending to actual descriptions of policy.
We can test the proposition by using the same analyses that were brought to bear in Experiment 1. As Panel 1 of Figure 4 shows, party cues had approximately no impact on subjects' ability to recall policy-related facts. By the same token, cues did not reduce the effects of policy on attitudes. The average policy effect when subjects received cues was actually greater among both Democrats (2.31 points on the 1–7 scale vs. 2.22 points, p = .65, two-tailed) and Republicans (0.44 vs. 0.23, p = .21, two-tailed). But neither difference approached substantive or statistical significance. These results suggest, again, that cues neither inhibited nor promoted attention to policy among the experimental subjects.
No Effect of Cues on Processing of Policy Content in Experiment 2

We need not stop here. Other data were collected in Experiment 2—data that let us look more closely at the extent to which subjects thought about the article that they received. Consider first the time that they spent reading the articles. So long as there is a positive correlation between time spent reading and total cognitive effort, time spent is at least a rough measure of cognitive effort. And here, too, the evidence suggests that cues did not inhibit thinking about policy. Panel 2 of Figure 4 reports 99%-trimmed means of time spent on the article under various conditions. (The means are trimmed because a few subjects spent between 1 and 83 hours on the article—presumably because they walked away from their computers and returned to the study much later.) It shows that the mean time spent on the article was 205 seconds for uncued subjects, 210 for cued subjects. These means change trivially if we restrict them to Democrats (205 and 211), Republicans (204 and 209), or subjects in small-change conditions (205 and 209) or large-change conditions (203 and 212). None of these differences approach statistical significance.
We can go further still. The open-ended thoughts that subjects provided are an indication of depth of processing: Subjects who have fewer thoughts in response to the article are less likely to have thought systematically about it. If cues inhibit systematic thinking, we should observe fewer policy-relevant thoughts among cued subjects. We do not. Panel 3 of Figure 4 provides the evidence: On average, we observe slightly more policy-relevant thoughts among cued subjects (3.81 vs. 3.61, p = .13, two-tailed). The difference holds when we restrict our analysis to Democrats, Republicans, subjects assigned to the large-change condition, or subjects assigned to the small-change condition. In all of these cases, p ≥ .24.
Depth of processing should also cause a stronger correlation between positivity of thoughts and positivity of overall attitudes (e.g., Chaiken and Maheswaran Reference Chaiken and Maheswaran1994, 467–68). And if cues inhibit processing of policy content, we should observe a lower thought–attitude correlation among cued subjects. We do not. Following Chaiken and Maheswaran (Reference Chaiken and Maheswaran1994, 464), I subtracted each subject's negative policy-relevant thoughts from his positive policy-relevant thoughts to create an index of thought positivity. Among uncued subjects, this index was correlated with attitudes at .54. Among cued subjects, the correlation was .55. As Panel 4 of Figure 4 shows, significantly larger differences did not turn up when the analysis was restricted to subgroups of interest.
The results presented in Figure 4 thus offer no support for the assumption that cues reduce attention to policy information when people have that information in hand (e.g., Kruglanski and Webster Reference Kruglanski and Webster1996, 264–65). This finding does much to explain why policy effects in Experiments 1 and 2 do not decline when people are exposed to cues. It is contrary to most that has been written on the subject, but it is consistent with Mackie, Worth, and Asuncion (Reference Mackie, Worth and Asuncion1990, 816) and Cohen Reference Cohen2003, 814, 817). Why party cues do not reduce attention to policy information remains uncertain, but two explanations seem likely. One is that party cues have countervailing effects among partisans: They reduce interest in policy (by permitting partisans to hold their views confidently without learning about policy) but also stimulate interest in policy (because the cues clearly indicate party conflict over policy). A second possibility is that cues do reduce attention to policy information when that information is minimal (e.g., Mondak Reference Mondak1993, 171) or difficult to comprehend, which it was not in the studies reported here. I return to this idea in the next section.
Republican Support for Benefit-expanding Policies. As in Experiment 1, Republicans in Experiment 2 disapproved of both the liberal and the conservative policies, but they disapproved less of the liberal policies. Averaging over the cue conditions and the small- and large-change conditions, the mean Republican attitude toward the liberal health-care policy was 3.71; for the conservative policy, it was 3.58. (For the difference, p = .09.) Finding the same result in experiments conducted with different samples more than a year apart suggests that it is not a chance occurrence. And in light of Republicans' reputation for opposition to expansion of government-provided benefits—reinforced by their objection to the national health-care proposals that were debated in 2009 and 2010—the result is striking. What can explain it?
Begin by noting that Republican support for cutting benefits is often overstated. Analyses by Ellis and Stimson (Reference Ellis and Stimson2011) suggest that fewer than one-third of Republicans consistently stake out conservative positions on benefit spending and other social and economic issues. And the 2008 ANES powerfully attests to Republicans' expansionary preferences over “aid to the poor” when it is framed as such. For example, only 17% of ANES Republicans said that federal spending on “aid to the poor” should be cut, while 43% said that it should be increased. 72% favored complete government coverage of prescription drug costs for poor senior citizens. The benefits described in the experiments were explicitly framed as aid to the poor, and the experiments may therefore have evoked Republican aversion to cutting such aid. By contrast, the national debate about health care that occurred in 2009 and 2010 focused less on aiding the poor than on broad expansion of health-care coverage.
Further comparison of the experimental and the national debates is instructive. Opposition to the national plan hinged on the suggestion that it would reduce quality of care for the already insured, and this suggestion was absent from the experimental articles. Moreover, the experiments described a state-level debate between unknown politicians, while the national debate was conducted by polarizing politicians with national reputations. If the experimental debate had been “nationalized” in these respects, Republican subjects might have approved less of the benefit-expanding policy.
A final possibility remains: Republicans may have approved more of the benefit-expanding policies in these experiments than of national health insurance proposals because they were exposed to more information in the experiments than they encountered during the national debate. Even at the height of the national debate, majorities knew little about the legislation being considered. For example, most Republicans believed that some of the provisions of the legislation that they liked most were not in the legislation at all (Kaiser 2010a, 2010b).Footnote 11 Still more tellingly, Republicans' support for the legislation more than doubled when they were exposed to information about its key provisions (NBC News 2009).Footnote 12 It would go much too far to say that Republican majorities would have liked the legislation if they had learned about all of its major provisions. But the polling data make clear that—as Experiments 1 and 2 suggest—exposure to policy details can substantially affect people's views even when they know where the major parties stand on the policy in question.
In crucial respects, then, Experiment 2 bolsters and extends the findings from Experiment 1. As in Experiment 1, subjects were affected by party cues but more affected—on average—by policy considerations. Partisan differences also reappeared in Experiment 2: Policy effects far outweighed party-cue effects among Democrats but not among Republicans. (Indeed, party-cue effects outstripped policy effects among Republicans, albeit to a much lesser extent than policy effects outstripped party-cue effects among Democrats.) Experiment 2 thus shows that the findings of Experiment 1 were not the product of a particular time. It also shows that the strength of policy effects in these experiments cannot be straightforwardly attributed to the degree of difference between the policies under consideration. And it brings a wealth of evidence to bear on the idea that party cues inhibit processing of policy information. The idea does not hold up well.
REVISITING PREVIOUS FINDINGS
In Experiments 1 and 2, elite position-taking effects are rarely larger than policy effects, and they are sometimes much smaller. These findings are consistent with previous studies—not because all of those studies produced similar results, but because the wide variation among them makes them collectively compatible with many different patterns of findings.
Table A1 of the supplementary online Appendix describes the published studies that involve manipulation of party cues and another factor. Six of the studies involve manipulation of party cues and policy: Arceneaux (Reference Arceneaux2008), Berinsky (Reference Berinsky2009, 118–22), Cohen (Reference Cohen2003), Rahn (Reference Rahn1993), Riggle et al. (Reference Riggle, Ottati, Wyer, Kuklinski and Schwarz1992), and Tomz and van Houweling (Reference Tomz and van Houweling2009). Because these studies involve manipulation of party cues and policy, they are the studies best suited to comparison of the effects of each factor. And their results vary a lot:
• Arceneaux (Reference Arceneaux2008) finds that when a candidate's position on abortion is described, changing his party from Democratic to Republican moves subjects' evaluations of him by 17%, while changing his position moves evaluations by 28%. But when the issue described is environmental regulation instead of abortion, the party-cue effect is 27% and the policy effect is only 4%.Footnote 13
• Berinsky (Reference Berinsky2009, 118–22) asks subjects whether the United States should intervene militarily in a conflict in South Korea. He varies the positions of party elites, likely casualty rates, and reasons for intervention. Changing the parties from united opposition to united support for intervention has effects that range from 12% to 22%, depending on the other factors. Changing the other two factors has effects that range from 5% to 12%.
• Cohen (Reference Cohen2003) finds that changing a welfare policy from “generous” to “stringent” moves evaluations of it by 15% to 21%, but holding the policy constant and reversing the Democratic and Republican parties' stands on it moves evaluations by 25% to 43%.
• In Rahn (Reference Rahn1993), subjects watch a debate between candidates for a seat in the Minnesota legislature. Mentioning their party affiliations changes attitudes toward the candidates by 7%. Changing the candidates' positions on five issues moves attitudes by 11% to 14% when subjects do not learn the candidates' party affiliations, 1% to 6% when they do.
• When subjects in Riggle et al. (Reference Riggle, Ottati, Wyer, Kuklinski and Schwarz1992) read about only one candidate, switching his party from Democratic to Republican moves his approval rating by only 3%, and changing his voting record on six policies moves approval by 23%. But when subjects read about two candidates, the part-cue manipulation has a 10% effect, and the policy manipulation has only a 1–2% effect.
• Party-cue and policy effects for the sixth study, Tomz and van Houweling (Reference Tomz and van Houweling2009), cannot be calculated from the results that the authors report. Their focus is on the effect of ambiguity in candidate position-taking, not on party-cue or policy effects per se.
The variation in these findings defeats most attempts to generalize. In particular, the findings do not collectively sustain claims (see the introduction and Theory and Prior Evidence) about the superior power of party cues among people who are exposed to both party cues and policy information. Of the six studies, only Cohen (Reference Cohen2003) consistently finds that party-cue effects outweigh policy effects. This balance of evidence is consistent with other studies that are suggestive although they do not involve policy manipulations. For example, Malhotra and Kuo (Reference Malhotra and Kuo2008, 129–31) find that party cues affect the extent to which people blame government officials for mishandling the aftermath of Hurricane Katrina in only 5 of 14 cases, and they argue that their results point to the “fragility” of party cues. Feldman and Conover (Reference Feldman and Conover1983, 828–31) find “rather minimal” effects of party cues on issue attitudes. And Dewan, Humphreys, and Rubenson (Reference Dewan, Humphreys and Rubenson2009, 24–25) find that a large effect of voter guides in a Canadian referendum is “entirely due to the arguments used by the campaign, not to the individuals making the case for reform,” even when those individuals are party leaders. All of these studies run counter to the claim that party cues “predominate” over other message content.
But it remains undeniable that party-cue effects are sometimes enormous. In addition to the effects that Cohen finds, Druckman (Reference Druckman2001, 70–72) finds that party cues produce preference reversals of between 40% and 46% in a variation on the Kahneman–Tversky “Asian disease” experiment. And Meredith and Grissom (Reference Meredith and Grissom2010) and Schaffner, Streb, and Wright (Reference Schaffner, Streb and Wright2001) find very large effects of party cues in elections for local and statewide offices. Why are the effects of elite position-taking in these studies so large, and what accounts for the wide variation in findings across studies? Two variables seem especially important: the amount of policy content to which subjects are exposed and the types of issues about which they read.Footnote 14
Message content is thought to be more influential when it is detailed and unambiguous (Chaiken and Maheswaran Reference Chaiken and Maheswaran1994; Petty et al. Reference Petty, Schumann, Richman and Strathman1993; see also Zaller Reference Zaller1992, 47–48). And although shorter policy messages are not always less detailed or less precise than longer messages, they do tend to be. Of the six previous studies in which policy and party cues were manipulated, five provided no more than three-sentence descriptions of policies. The most typical policy content in these studies is a single vague phrase: for example, “increase the economic status of women” (Riggle et al. Reference Riggle, Ottati, Wyer, Kuklinski and Schwarz1992, 76) or “decrease services a medium amount” (Tomz and van Houweling Reference Tomz and van Houweling2009, 88). Cohen (Reference Cohen2003) offered more—one to two short paragraphs—but even this is far less than what readers will find every day in articles from the leading American newspapers (Project for Excellence in Journalism 2004). Studies in which subjects receive minimal policy information may mirror the conditions that citizens often face, but they say little about the extent to which citizens would rely on party cues and policy information if they were exposed to substantial amounts of the latter. Experiments 1 and 2 can say more because they expose subjects to more policy information than any of the six previous studies described here. Heightened exposure to policy information is also likely to account, in large part, for the balance of party-cue and policy effects in those ex- periments.
A second set of considerations is about the issues that subjects face. At the heart of these considerations is the idea that party elites will be less influential, and policy attributes more influential, when people have stronger prior beliefs about the issues or are better able to connect their values to positions on those issues. Thus Arceneaux (Reference Arceneaux2008) finds stronger policy effects than party-cue effects when subjects consider abortion, but the opposite pattern when subjects consider whether states or the federal government should regulate the environment. Carmines and Stimson (Reference Carmines and Stimson1989, 11–12) imply that policy effects should be greater when issues are “easy,” i.e., “understandable with no supporting context of factual knowledge” (see also Coan et al. Reference Coan, Merolla, Stephenson and Zechmeister2008). And Levendusky (Reference Levendusky2010, 120) maintains that it is “all but impossible” to examine cue effects when subjects consider issues about which they have already thought or on which parties have established reputations (see also Gaines, Kuklinski, and Quirk Reference Gaines, Kuklinski and Quirk2007). These arguments suggest that the balance of effects in Experiments 1 and 2 might have been different if subjects had read about a different issue. The policy in these experiments was about health-care benefits that ordinary citizens stand to gain or lose, and such policies are arguably easier for subjects to understand and relate to their values than (say) monetary policy or technical aspects of environmental regulation. That said, this line of reasoning should not be taken too far. Contrary to the claim that it is “all but impossible” to find party-cue effects for familiar issues, Table A1 shows that such effects have been found on multiple occasions when subjects have been asked to consider familiar issues. (See also Campbell et al. Reference Campbell, Converse, Miller and Stokes1960, 135–36 and Slothuus and de Vreese Reference Slothuus and de Vreese2010.) The choice of issues in experiments is likely to affect the balance of party-cue and policy effects, but it is unlikely—by itself—to account for most of the variation in the effects produced by the studies described here.
Learning from Observational Research
Few of the findings described previously are from observational studies. In part, this is because of the difficulties that we face when we try to learn about party cues from such studies—difficulties that do not always arise when we use such studies to learn about other types of variables.
In typical observational studies about party cues, respondents are asked where they stand on issues and where political parties stand on the same issues (e.g., Feldman and Conover Reference Feldman and Conover1983). Those who answer the questions about parties' stances are assumed to have received cues conveying those stances. And if their answers to those questions are correlated with their attitudes, cues are assumed to affect their attitudes. One difficulty with this approach is that many people express views on issues that they have never heard about (e.g., Bishop Reference Bishop2005, chap. 2). Merely answering a question about a party's issue position, then, is no indication that one has received a party cue. A second problem is reciprocal causality: People's own issue stances may influence their perceptions of parties' stances, in which case those perceptions are murky amalgams of party-cue and projection effects (e.g., Jessee and Rivers Reference Jessee and Rivers2009; Page and Brody Reference Page and Brody1972). A third problem is that receipt of cues may be confounded with other variables that are responsible for the observed effects. For example, knowledgeable people are more likely to receive cues and to take their parties' positions, but it may be their knowledge of policy, rather than their receipt of cues, that causes them to take those positions. Of course, one can attempt to control for policy-relevant knowledge and to model the relations between it, receipt of cues, and policy attitudes. But even if one perfectly measures relevant knowledge and other variables, the structure of the model that relates these variables and party cues to attitudes will remain unknown. Experiments can overcome these threats to inference about party-cue effects.
It remains true that good observational studies have long argued that party-cue effects are large and pervasive (e.g., Campbell et al. Reference Campbell, Converse, Miller and Stokes1960, chap. 6). And in spite of the equally longstanding “optimistic” line of observational research (see Theory and Prior Evidence), the observational record is less mixed than the experimental record: Observational research tilts toward finding large party-cue effects. For example, many have argued that mass polarization in support for U.S. wars is due to differences in the positions staked out by party elites (e.g., Berinsky Reference Berinsky2009, chap. 5; Brody Reference Brody1991). Zaller (Reference Zaller1992, chap. 6) and Abramowitz (Reference Abramowitz2010) extend the argument to other issues, including welfare policy and the use of busing to promote racial integration of schools. This divergence of experimental and observational results is instructive: It further highlights the role of policy-specific knowledge, and it casts new light on the importance of the frames in which party cues are almost always couched.
Consider first the role of policy-specific knowledge. Americans know little about policy (Delli Carpini and Keeter Reference Delli and Keeter1996) and especially little about the policies that are taken up in initiatives, referenda, and the contests for low-level office that dominate most American ballots. In these cases, we should not be surprised to find that party cues have large effects on voters' choices. Indeed, some of the largest party-cue effects have been found in precisely these settings (Schaffner, Streb, and Wright Reference Schaffner, Streb and Wright2001). And the finding of large effects in observational studies (in which most subjects are ignorant of policy) and smaller effects in Experiments 1 and 2 (in which subjects were exposed to ample policy descriptions) imply that large party-cue effects in observational studies reflect the policy ignorance of the American electorate. Observational studies cannot easily tell us how large these effects would be if people knew more about policy—for that, we should turn to experiments—but they may tell us about the effects of party cues given current levels of policy knowledge.
Differences between observational and experimental results also suggest the importance of frames that parties use to support their policy positions. In political debate, cues and frames almost always appear together: Party elites rarely take a position without trying to frame it in a way that will garner support for it (Zaller Reference Zaller1992, 13–14, 95–96). Some experiments, including Experiments 1 and 2, stay true to this aspect of politics while still permitting scholars to identify the effects of party cues independent of the frames that party leaders use. But teasing apart party-cue and framing effects is usually beyond the power of observational studies. The large “party-cue” effects that observational studies suggest may therefore really be “party-cue-and-frame” effects.Footnote 15
To see why the large party-cue effects suggested by observational studies may be due partly to the frames in which cues are couched, consider the argument made by Lenz (Reference Lenz2009). Lenz uses panel survey data to argue that campaigns cause voters to learn where parties stand on issues, which in turn leads voters to change their own positions on issues. In 1980, for example, he argues that U.S. voters learned where Reagan and Carter stood on defense spending, and that they subsequently brought their own positions on the issue into line with the position of their preferred candidate. Lenz's data do suggest that this happened. But his data (like almost all survey data) make it impossible to distinguish the effect of learning where parties stand on issues from the effect of learning the frames and arguments that party leaders use to support their stands. In 1980, Reagan seized on concerns about America's military stature to argue for a defense-spending buildup, while Carter maintained that such views showed that Reagan was dangerously keen to use military force. The opinion change that Lenz observes may therefore be due partly to voters learning frames and arguments like these, not just to voters learning whether the candidates favored or opposed an increase in defense spending.Footnote 16
Frames and arguments are unlikely to fully account for the difference between observational and experimental findings, but they probably account for some of it. To account for some of the difference, the frames that politicians use need not be thoughtful or even coherent. They need only be appealing. And the large investment that politicians make in “honing their messages” or “staying on message”—that is, in getting the frames right—further suggests that some of the effects that observational studies attribute to party position-taking may instead be due to the frames that party leaders use to justify those positions (Druckman, Jacobs, and Ostermeier Reference Druckman, Jacobs and Ostermeier2004; Fenno Reference Fenno1978, chap. 5; Jacobs and Shapiro Reference Jacobs and Shapiro2000; Kingdon Reference Kingdon1981, 47–54; Vavreck Reference Vavreck2009).
ELITE INFLUENCE ON POLICY PREFERENCES OUTSIDE THE UNITED STATES
Most of the studies described in the previous section focus on American politics: They consider conflict between the Democratic and Republican parties over issues that are prominent in America but often minor in other countries. This focus is not accidental. Although research on various aspects of partisanship in other countries is increasing, the most relevant research—about the relative influence of elite position-taking and policy descriptions on people's policy choices—remains overwhelmingly American. Even so, it is now possible to make two generalizations about cross-national variation in the effects of party-elite position-taking on citizens' policy views. First, the effects are stronger where parties have clearer reputations and where competitive party systems are better established. Second, and related, the effects seem to be stronger in the United States than in other countries.
A burgeoning body of research suggests that the strength of party cues in other countries depends on the extent to which those countries' party systems are well-developed. For example, Brader and Tucker (Reference Brader and Tucker2009a) conducted party-cue experiments in Great Britain, Poland, and Hungary. They find that party cues change policy attitudes most in Great Britain and least in Poland, with Hungary in between—exactly what we would expect if the strength of party cues depends on the extent to which parties have developed clear reputations. Similarly, Merolla, Stephenson, and Zechmeister (Reference Merolla, Stephenson and Zechmeister2007) find only modest effects of party cues in Mexico, consistent with the recent development of party competition in that country. And both Merolla, Stephenson, and Zechmeister (Reference Merolla, Stephenson and Zechmeister2008) and Dewan, Humphreys, and Rubenson (Reference Dewan, Humphreys and Rubenson2009) find weak-to-nil effects of party cues in Canada. Canada has a long tradition of competitive parties, but for most of their history, the parties have been part of a “brokerage” system in which policy and ideology are deeply subordinated to the task of building winning coalitions (Stevenson Reference Stevenson1987). Tellingly, the largest exception in the Canadian literature is Merolla, Stephenson, and Zechmeister's (Reference Merolla, Stephenson and Zechmeister2008, esp. 688) finding that cue effects are most substantial for the New Democratic Party (NDP), which is the Canadian party in their study that has the most consistent set of positions on social and economic issues.
A major concern about the study of party-elite influence in other countries is that theory and findings on these topics, which are mainly rooted in American politics, will not apply to countries where multiple parties crowd the political landscape and party systems themselves are much younger (Sniderman Reference Sniderman, Lupia, McCubbins and Popkin2000, 83–84). Recent research should temper this concern. Despite large differences in party systems, party-cue effects have been found almost everywhere that they have been sought, and they appear to operate in other countries much as they do in the United States. But recent research also shows that the effects are weaker than those that we often observe in the United States. For example, Brader and Tucker (Reference Brader and Tucker2009a, Reference Brader and Tucker2009b) generally find stronger effects for party cues in Great Britain than in Hungary, Poland, or Russia, but even in Great Britain, the effects are smaller than those that would be typical in the United States.Footnote 17 Results from Merolla, Stephenson, and Zechmeister (Reference Merolla, Stephenson and Zechmeister2007; Reference Merolla, Stephenson and Zechmeister2008) are similar in this respect, with the exception of their findings for cues from the NDP. These results are striking because the authors take pains to study issues that are not very salient and might therefore be expected to exhibit larger cue effects. Slothuus and de Vreese (Reference Slothuus and de Vreese2010) find that party cues can move attitudes about a trade agreement by up to 20% in Denmark, and Sniderman and Hagendoorn (Reference Sniderman and Hagendoorn2007, 117) report similar effects in the Netherlands when they confine their attention to “high-conformity” subjects, but findings of this magnitude are rare outside the United States.
This finding—party labels are more influential in the United States than in other countries—is consistent with the United States having one of the oldest systems of party competition and only two major parties, both of which have relatively well-defined policy reputations (Brader and Tucker Reference Brader and Tucker2009a, 33; Lijphart and Aitkin Reference Lijphart and Aitkin1994, 160–62).Footnote 18 We might therefore expect policy considerations to be relatively more influential outside the United States—not because people in other countries attend more to policy in an absolute sense, but because they are less influenced by party elites.
CONCLUSION
The normative case for democracy loses much of its force if citizens arrive at their political views unthinkingly (see Estlund Reference Estlund2007, esp. chap. 9). Many scholars fear that citizens are doing just this—mechanically adopting the positions of their party leaders even when they have other information on which to base their judgments (e.g., Cohen Reference Cohen2003, 808; Graber Reference Graber1984, 105; Iyengar and Valentino Reference Iyengar, Valentino, Lupia, McCubbins and Popkin2000, 109; Rahn Reference Rahn1993, 492; Zaller Reference Zaller1992, 45). But examining this concern entails isolating the effects of both policy information and position-taking by party elites. Few studies have done this, and their implications have not been clear. The experiments presented here do isolate the effects of party cues and policy, and they suggest an important condition under which the concern does not hold. Party cues are influential, but partisans in these experiments are generally affected at least as much—and sometimes much more—by exposure to substantial amounts of policy information.
These results warrant a measure of optimism about partisans' ability to hold meaningful policy views. To be sure, partisans are rarely exposed to more than meager descriptions of policy. But when they are, the results suggest that they can arrive at policy views that are independent of and even contrary to the views of their party leaders. This research is therefore of a piece with longstanding optimistic arguments about voters' ability to arrive at reasoned policy preferences (e.g., Key Reference Key1966).
The experiments reported here also reveal much individual-level variation in the relative influence of policy details and position-taking by party elites. The role of partisanship is most striking: In both experiments, Democrats were far more affected by policy than by party cues, but Republicans were almost equally affected by these factors in Experiment 1 and slightly more affected by party cues in Experiment 2. Need for cognition also plays a clear role in moderating policy effects, but it is less important as a moderator of party cues. These differences help to explain why the effects of elite position-taking and policy information differ from person to person. That said, they leave intact the experiments' central findings. On average, when people are exposed to both party cues and ample policy information, they are more affected by the latter. And exposure to party cues does not seem to reduce people's attention to policy information when they have those descriptions in hand.
In light of Republican opposition to the Patient Protection and Affordable Care Act of 2010, it is striking that Republicans in these experiments disapproved less of the benefit-expanding policies than the benefit-reducing ones. This finding does not speak directly to the influence of policy details or elite position-taking. But, consistent with contemporaneous poll results, it does further suggest that exposure to descriptions of policy can have important effects.
Nothing about these results was obvious or foreordained. For example, prior research suggests that exposure to source cues may “short-circuit” the processing of policy descriptions, thereby limiting their effect (Kruglanski and Webster Reference Kruglanski and Webster1996, 265, 270–71). It also suggests that need for cognition has little place in the study of politics (e.g., Holbrook Reference Holbrook2006, 349–50). Above all, some well-known prior work suggests that even when partisans know about the attributes of policies, their views will be influenced less by that knowledge than by party cues. Those claims are inconsistent with the results reported here, and they are hard to reconcile with the mixed results of the most relevant previous studies.
To a large extent, the discrepancies may be explained by differences in research design. Most claims about a “short-circuiting” effect of cues are based on apolitical studies that do not involve party cues or measures of depth of processing. The accumulating nonfindings about need for cognition may well be driven by measurement error. And two variables may account for much of the between-study variation in party-cue and policy effects: the amount of policy content to which people are exposed and the salience of the issues that they consider.
In addition to sharpening our understanding of the determinants of policy attitudes, Experiments 1 and 2 suggest many avenues for future research. Three stand out:
1. Exploring cognitive differences between Republicans and Democrats. Political scientists know much about attitude differences between members of different parties, but partisans' thinking about politics may differ in more basic respects, and this possibility has received little attention. Experiments 1 and 2 produced two unexpected results in this vein: Republicans were less influenced than Democrats by policy considerations, and while need for cognition made Democrats more responsive to policy, it made Republicans less responsive. More research is required to determine whether these results reflect basic differences between members of different parties. And in general, the possibility of basic partisan differences in political cognition deserves much more attention than it has received. (Some authors have already made a start: e.g., Druckman Reference Druckman2001, 72n11; Iyengar et al. Reference Iyengar, Hahn, Krosnick and Walker2008, 195; and Jost et al. Reference Jost, Glaser, Kruglanski and Sulloway2003.)
2. Examining the roles of issue salience and the amount of policy information to which people are exposed. When coupled with the other studies discussed in this article, Experiments 1 and 2 suggest that salience and amount of content are among the most important moderators of elite influence on public opinion. But stronger inferences will require experimental manipulation of these variables in studies that can also identify party-cue and policy effects.
3. Understanding the sense in which party cues are “cognitive shortcuts.” The most important political psychology idea of recent decades may be that cues are “cognitive shortcuts” that help people to conserve effort when making decisions. There are two senses in which cues may be shortcuts: They may reduce information seeking or information processing. Experiments 1 and 2 suggest that party cues are not “shortcuts” in the second sense because they do not reduce processing of policy information when people have that information in hand. Whether they make people less likely to seek information about policy at all is a separate question. Lau and Redlawsk (Reference Lau and Redlawsk2006, 239–40) suggest that they do not, but research on this question has only begun. It will be striking if party cues do not prove to be shortcuts in either sense of the term—but that is the direction in which the experimental evidence is tending.
One of the most common concerns about elite influence on mass opinion is that it causes people to neglect what they know about relevant policies. But the studies reported here show that the effects of position-taking by party elites can be more modest than we often imagine, and that the effects of policy considerations can be much greater. The ability of political elites to mislead citizens is correspondingly limited, at least when citizens have other information on which to base their judgments. This is not cause for unbridled optimism about citizens' abilities to make good political decisions, but it is reason to be more sanguine about their ability to use information about policy when they have it.
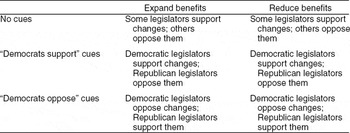
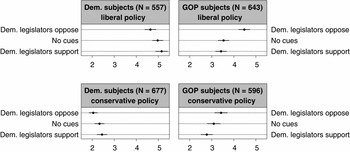
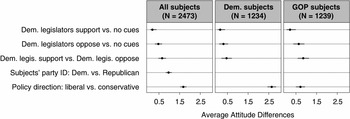
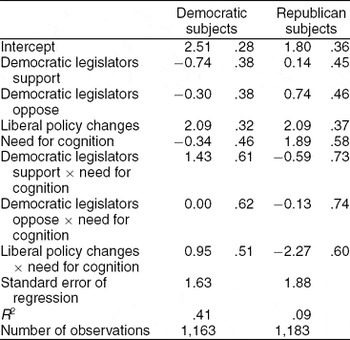
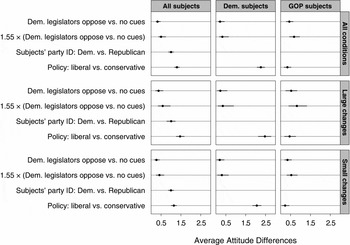
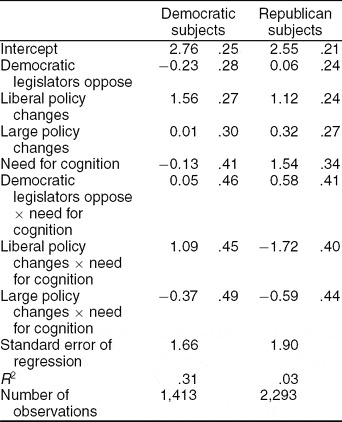
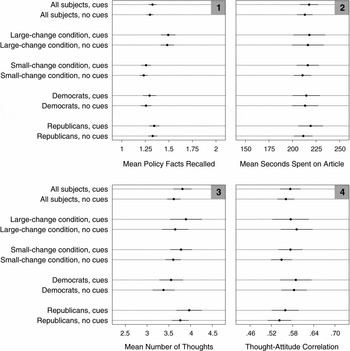




Comments
No Comments have been published for this article.