In the 1940s the average real weekly wages of black women nearly doubled, thereby narrowing the racial wage gap among nonfarm, working women by a full 15 percentage points.1
The figures are calculated using the wage income variable of Ruggles et al., Integrated Public Use Microdata Series (hereafter IPUMS), and using the consumer price index for deflation. Sample restrictions are described in the notes to Figure 1. The average weekly wage for black women rose from $13 to $24 (1950 dollars). The black-white ratio increased from 0.44 to 0.59. See Figure 1 notes for sample restrictions. Cunningham and Zalokar, “Economic Progress,” report results of a similar magnitude (0.44 to 0.64) for estimates of hourly wages. Ad hoc adjustments for cost of living differences between metropolitan areas and nonmetropolitan areas (discounting metro area income by 20 percent) have little effect on the magnitude of the wage gains. And, as discussed later, the bulk of the absolute and the relative gains were not driven by selection into the labor force.
For the sake of brevity, we use the term “formal sector” to denote all occupations outside agriculture and private household service.
Previous research has focused on the decade's significance in spurring the labor-force participation of white women and wage growth among black men.3
Goldin, “Role”; Maloney, “Wage Compression”; and Margo, “Explaining Black-White Wage Convergence.”
See Blau and Beller, “Black-White Earnings”; and Neal, “Measured,” for examinations of more recent trends in the racial wage gap among women.
By developing a detailed ecology of black women's labor market experiences in the 1940s and setting it in contrast to previous and subsequent decades, this article contributes to a central theme in American economic history: the story of how race, gender, and labor markets interacted over the course of the turbulent twentieth century. Our argument is twofold. First, we claim that the 1940s were a watershed decade for African-American women's integration into formal sector employment and marked a turning point in the growth path of their wages relative to those of white women. The labor market gains during the 1940s were not continuations of pre-existing trends, and the relative wage gains in the 1940s are comparable to those achieved during the 1960s and commonly associated with the Civil Rights Movement.5
Changes in black women's wages were larger in absolute terms during the 1940s than the 1960s, but the gains relative to white women were approximately the same in each decade. We offer a detailed comparison later in the article. The black-white wage gap continued to narrow in the 1970s, which we do not capture in our comparison. But because the 1940s gains were almost certainly concentrated in the 1941 to 1945 period, we think it is useful to compare them with the gains achieved in a similar five-year period following the 1964 Civil Rights Act.
Second, using a semiparametric decomposition methodology pioneered by John DiNardo, Nicole Fortin, and Thomas Lemieux, we quantify the importance of changes in the wage structure after accounting for changes in black and white women's productive and personal characteristics and in their representation across jobs and locations.6
DiNardo, Fortin, and Lemieux, “Labor Market Institutions.”
The large net flow of black women into formal sector jobs (which is not explained by changes in their observable characteristics) coupled with pervasive increases in black women's wages relative to those of white women (even in the occupations black women were leaving) is consistent with a substantial increase in the relative demand for their labor in the formal sector. Previous work has shown that wartime labor demand, complemented by institutional and policy changes, permitted many black workers to attain better-paying jobs and compressed the American wage structure.7
See Goldin and Margo, “Great Compression,” for a thorough discussion of the wage structure's compression. See Reed, Seedtime; and Collins, “Race” and “Labor Market Impact,” on government anti-discrimination policies during the war. See Moreno, Black Americans, on unions.
In subsequent decades, African-Americans built upon their wartime economic advances. They increased their presence in jobs that were in urban areas and covered by formal contracts and benefits, minimum wage legislation, and collective bargaining. This better positioned them to organize and advocate for Civil Rights, to take advantage of formal-sector networks of employment and information, and to gain employment in previously racially exclusive firms.8
Membership in the National Association for the Advancement of Colored People (NAACP) skyrocketed during World War II (Tushnet, NAACP's Legal Strategy, p. 135). Reed characterizes the period as Seedtime for the Civil Rights Movement. See Whatley, “Getting a Foot,” on the importance of employers' changing hiring practices during World War I.
For example, in the 1950 microdata sample (Ruggles et al., IPUMS), school enrollment rates were significantly higher for blacks residing in metropolitan areas than for those in nonmetro areas, particularly at relatively young (under seven) and old (over 14) ages. Despite the Supreme Court decision in Brown v. Board of Education in 1954, most southern schools remained segregated until the mid 1960s (Clotfelter, After Brown), and the South historically lagged the non-South in its commitment to public education (Nicholls, Southern Tradition; and Wright, Old South).
BLACK WOMEN'S WAGES AND JOB MOBILITY: THE 1940S IN HISTORICAL CONTEXT
The importance of the 1940s in the economic history of racial disparities is highlighted by abrupt and pervasive changes in African-American women's labor market outcomes. First, our estimates of the black-white ratio of mean nonfarm wages among women from 1909 to 1969 indicate that the 1940s marked a turning point. As we discuss below, accounting for potential sample selection or measurement error does not greatly alter the magnitude of mean wage convergence in the 1940s. Second, the wage gains were widespread. Black women's wages increased throughout the wage distribution and throughout the country, both in absolute terms and relative to white women's wages. Part of this was due to their movement into higher paying occupations, yet even within occupational groups, black women's wages increased faster than white women's. Third, the timing of the wage gains for black women corresponds to sharp changes in their occupational distribution. Later in the article, we argue that this combination of findings is consistent with strong demand-side shifts that signaled the start of a long-run, though episodic, decline in labor market discrimination against black women. Due to data constraints, we focus our examination of wages on samples of wage and salary workers employed in nonfarm occupations (as described in Appendix 1), but our examination of the occupational redistribution of women incorporates farm sector employees.
Changes in Mean Wages, 1909–1969
Prior to 1940, the census did not collect information on workers' wages, and other sources of wage information are either unrepresentative of the national labor force or not race-specific (or both). Nonetheless, one can estimate the black-white nonfarm wage gap for earlier years using three sources of wage and labor force data: first, the 1940 sample of the Integrated Public Use Microdata Series (henceforth IPUMS) allows the calculation of mean wages for women by race-industry-region cells in the previous year; second, the IPUMS samples for earlier years (1910, 1920, and 1930) reveal the distribution of female workers across race-industry-region cells in each census year; and third, the industry-level average wage series from Historical Statistics of the United States indicate how the interindustry wage structure changed over time.10
Ruggles et al., IPUMS. For simplicity, we often refer to the census year when discussing wage gains, though the census income question always pertains to the previous calendar year. U.S. Department of Commerce, Historical Statistics, pp. 166–67. To maintain a reasonable number of observations per race-industry-region cell in 1940, we used two-digit industry categories (rather than the more detailed three-digit codes). We distinguish workers by industry categories (rather than occupations), because the long-run wage series reported in Historical Statistics are industry-based. See the notes to Figure 1 for more information. This approach is similar in spirit to that taken in Smith, “Race.” We extend his idea, however, by allowing geographic redistribution and industry-level wage fluctuations to affect the estimated black-white wage gap for women.
Specifically, we calculate the average black-white wage gap in a given year as

where Ni, r, t denotes the number of women observed in industry i, in region r, at time t (and Nt = Σ i, rNi, r, t) using the 1910, 1920, or 1930 IPUMS sample, and

denotes a race-specific mean wage computed for women within industry-region cells using the 1940 IPUMS. The superscripts, B or W, indicate black or white respectively. The ratio,

, denotes the average wage in industry i in year t relative to the average wage in industry i in 1939 as reported in Historical Statistics.
11For example, we can calculate the average wages of black women in the South who worked in household service in 1940 and then extend a series backwards using the wages for domestic servants reported by U.S. Department of Commerce, Historical Statistics. Then, we can assign a wage to each southern, black, domestic servant in the 1910, 1920, and 1930 IPUMS. We can do the same for every other race-region-industry category, and then, by averaging across all female workers (by race) in a particular year we can obtain an estimate of the black-white wage ratio.
The estimated series, therefore, incorporates changes in the representation of black and white women across regions and industries, Ni, r, t, and changes in industry-level wages,
. Because the wage series from Historical Statistics are not specific to sex, race, or region, the estimates implicitly assume that within industries the relative wage gaps across these groups remained stable over time.
12For example, southern black domestic servants are assumed to have the same wage changes (in percentage terms) as northern white domestic servants, although they are allowed to have different wage levels. The dearth of race-specific wage data for women in the early twentieth century makes this assumption difficult to support, but the existing fragmentary evidence suggests that it is plausible. Wright cites a 25 percent racial gap in median wages for women in Virginia manufacturing establishments in 1907 (textiles for whites, tobacco for blacks) (Old South, p. 183). The IPUMS data suggest a nearly identical racial gap in median wages in nondurable manufacturing in Virginia (and the entire South Atlantic region) in 1939. Moreover, it is reassuring that when extended forward to 1950, the estimated series captures 80 percent of the actual increase in blacks' relative wages (the actual ratio changes from 0.44 to 0.59, and the estimated ratio changes from 0.44 to 0.55).
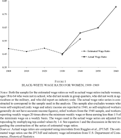
Under these assumptions, Figure 1 suggests that the 1940s marked a dramatic break with the past—black women's relative wage gains were large and most likely unprecedented in the twentieth century. Rather than being a continuation of previous trends, it appears that the 1940s may have reversed a slight, downward trend in black women's relative wages from 1909 to 1939. From a different empirical perspective (and cognizant of the scarcity of race-specific wage data for women before 1940), Claudia Goldin argues that the black-white wage ratio for women probably declined from 1900 to 1940: “… if the 1940 ratio of white to black female earnings … is applied to the data for white earnings in 1890 or 1900, the resulting black female earnings are far too low. This implies that the ratio of black to white earnings must have decreased from 1890 to 1940, an inference that is consistent with the formidable restrictions on black women's employment during the period.”13
Goldin, Understanding the Gender Gap, p. 249. Anderson, “Last Hired,” points out that despite the observed gains, discrimination against black women was still very common in the 1940s.

FIGURE 1 BLACK-WHITE WAGE RATIO FOR WOMEN, 1909–1969
Comparing wage convergence during the 1940s to that in later decades is more straightforward because the decennial census surveyed workers about both their annual wages and the intensity of their work (for example, weeks of work in the previous year or hours of work in a recent week).14
Because actual weeks worked are not reported in the 1960 and 1970 census, we divide annual wages by the mean number of weeks worked by individuals in a given interval using information on the distribution within intervals from the 1950 census. When undertaking the decomposition analysis we also account for changes in reported hours of work. We did not attempt to calculate an hourly wage because the census hours variable does not pertain to the previous year (whereas income and weeks worked do).
See, inter alia, Freeman, “Changes”; Brown, “Black-White Earnings”; Smith and Welch, “Affirmative Action”; Donohue and Heckman, “Continuous versus Episodic Change”; Card and Krueger, “School Quality”; Chay, “Impact”; and Neal, “Measured Black-White Wage Gap.”
Selection and Measurement Issues
To be sure, changes in the composition of our samples (selection) or changes in the composition of total earnings may have influenced changes in the observed black-white wage gap among women. One might hypothesize, for example, that the increase in white women's labor force participation could increase the proportion of white workers with few skills, or that in-kind payments to black domestics could skew the measures of earnings. Here, we assess the potential influence of differential changes in labor force participation, differential changes in labor market experience (an unobservable characteristic in the census), and in-kind payments to servants.
First, it seems unlikely that a disproportionate increase in the number of relatively low-skilled white workers is artificially driving the observed wage convergence among nonfarm workers. It is true that the fraction of white women (from ages 18 to 64) in the labor force increased from 28 to 32 percent from 1940 to 1950 and that the fraction of black women working remained relatively stable at approximately 43 percent. But at the same time, the proportion of black, female workers in agriculture declined from 15 to 8 percent, suggesting that a large number of relatively unskilled black women transitioned into our sample of nonfarm wage workers. Additionally, although it is not possible to identify “new entrants” to the labor force in the census data, the decompositions presented later in the article explicitly take account of changes in a number of observable personal characteristics. In general, these decompositions suggest that changes in age, marital status, child-at-home, and hours of work explain little of the overall racial convergence.
A hypothetical calculation further demonstrates that the scope for sample selection's effect on the black-white mean wage ratio is narrow. For example, increasing the sample size of white women in 1940 by 4 percentage points (to simulate the change in the participation rate from 28 to 32 percent) and assigning all of the additional workers the wage we observe for white women at the twenty-fifth percentile would raise the black-white ratio from 0.44 to only 0.46. Assigning each additional worker a wage we observe at the tenth percentile for white women would raise the black-white ratio to only 0.48. To drive the entire increase from 0.44 to 0.59, we would have to assign the additional workers large negative incomes. These simple calculations take no account of general equilibrium effects on the wage structure, but the point is clear: even extreme assumptions about the unobserved skill of additions to the white labor force do not account for the strong pattern of convergence at the mean.
Differential changes in labor-market experience among black and white workers during the war may also confound measures of wage convergence. A unique collection of retrospective work histories collected in the 1951 “Palmer Survey” allows an evaluation of this issue for more than 4,000 female workers residing in Chicago, Los Angeles, New Haven, Philadelphia, San Francisco, and St. Paul.16
Gladys Palmer directed the study, which collected work histories for men and women in 1951 if they were in the work force. It is also known as the “Six-City Survey.” See Palmer, “Labor Mobility”; Goldin, “Role”; and Collins, “African-American Economic Mobility.” The women's transcription cards (and most of the men's) remain in the archives of the University of Pennsylvania. We thank Claudia Goldin for sharing the data for women with us.
Pre-1940 experience cannot be ascertained. With city fixed effects and controlling for age (quadratic), marital status, and years of education, black entrants had 46 months less experience during the 1940s than nonentrants; white entrants had 45 months less experience than white nonentrants. Although not nationally representative, the proportions of entrants in the samples for white and black women are nearly the same: 41 percent of blacks in the sample in 1951 were entrants and 42 percent of whites were.
Yet another concern is that unobserved payments in-kind to domestic servants might lead to an overstatement of the actual earnings gains, because black women disproportionately moved out of jobs with potentially high levels of unobserved compensation. To investigate this, we inflated all household servants' weekly wages by 20 percent in the 1940 and 1950 samples (a figure that approximates the gap in earnings between black workers in household service and those in other forms of service after adjusting for observable characteristics) to gauge the effect on the wage distributions and measures of inter-racial convergence. Although the levels of the black-white wage ratios at the mean and at the twenty-fifth percentile are raised by the adjustment (in both 1940 and 1950), as one would expect given the concentration of black women in household service, the characterization of relative wage changes during the 1940s is not greatly affected. The ratio of average wages increases by 0.14 in the 1940s with the ad hoc adjustment for potential in-kind payments, whereas the increase is 0.15 without the adjustment.18
At the twenty-fifth percentile, the black/white ratio increased by 0.12 with the adjustment and by 0.11 without it. By 1940, live-in servants were rare. Only about 5 percent of all household servants (black and white) appear to reside with their employers (using the “related” variable in the 1940 IPUMS sample to identify “domestic employees”).
THE CHANGING DISTRIBUTION OF WAGES IN THE 1940S
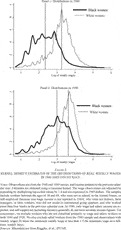
To widen the perspective on wages, Figure 2 plots the full distributions of the log of real weekly wages in 1939 and 1949. Vertical lines mark the distributions' medians.19
See the notes to Figure 2 for a description of the sample. Distributions of hourly wages exhibit similar patterns. Later in the article, we pay careful attention to changes in the number of hours worked when decomposing the wage gains.

FIGURE 2 KERNEL DENSITY ESTIMATES OF THE DISTRIBUTIONS OF REAL WEEKLY WAGES IN 1940 AND 1950 BY RACE
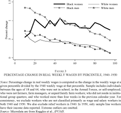
Figure 3 plots the percentage increase in real weekly wages at several percentiles in the income distributions for black and white women and for men. For the sake of brevity and consistency with other studies of wage convergence, the figure follows convention and compares wage gains across groups at particular percentiles in each group's distribution.20
For comparison see Margo, “Explaining Black-White Wage Convergence”; Gottschalk, “Inequality”; and Autor and Katz, “Changes.”
Nonetheless, readers might find other comparisons to be of interest. For example, as just noted, the median wage level of blacks in 1939 was approximately the same as that for whites at the tenth percentile, but the median wage value for blacks increased substantially more than the wage at the tenth percentile for whites (0.66 versus 0.49 log points). Such cross-percentile views are possible in the tables presented later in the article, though our discussion emphasizes the conventional “same percentile” comparisons.

FIGURE 3 PERCENTAGE CHANGE IN REAL WEEKLY WAGES BY PERCENTILE, 1940–1950
Each plot in Figure 3 rests well above zero, which reflects the dramatic real wage gains throughout the distribution for all four groups. At the medians, blacks' weekly wages (for both men and women) increased at nearly twice the rate of those for whites. Another notable feature is the absence of wage compression among black women. Whereas the rate of wage gains among black women was large and fairly uniform across percentiles, the strong downward trend in the other plots is indicative of wage compression within those groups.22
There is compression in the sense that the percentage change in income is larger below the median than above it, although absolute dollar gains need not have the same pattern.
The absence of compression among black women may reflect two factors. First, even workers at the high end of the black women's wage distribution often worked in low-skill jobs in 1940. There were many more household servants above the seventy-fifth percentile of the black distribution than there were operatives or school teachers (the highest paying jobs commonly held by black women). The compression between skill groups emphasized by Goldin and Margo, therefore, might not have impinged on the top end of the black women's distribution.23
Goldin and Margo, “Great Compression.”
See Rockoff, Drastic Measures, for a history of price and wage controls.
Changes in the Occupational Wage Structure
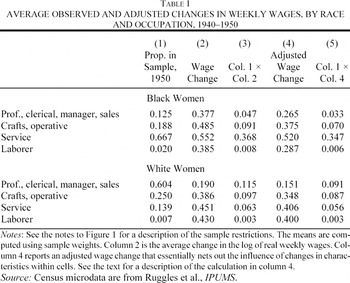
Table 1 provides an occupation-based perspective on the changing wage structure. In one important sense the changes in the wage structure were similar for black and white women—specifically, service wages increased relative to wages in other fields. But because black and white women were distributed so differently across occupations, the changes in the occupational wage structure had different implications for the overall wage gains of black and white women. Moreover, even within occupational categories, the wage gains for blacks were often larger than for whites.

The first column of Table 1 simply lists the proportion of black or white female workers in four broad occupational categories in 1950. The second column reports the average change in the log of real weekly wages for women in a particular category (by race) from 1939 to 1949. The third column is the product of the first two. Large within-category wage changes carry more weight if they occur in categories that include a large proportion of workers. Because the change in wages within occupational categories could reflect not only “pure” changes in occupational wages but also in the characteristics of those in the occupation cell (such as marital status, educational attainment, and region of residence), we have also calculated an “adjusted wage change.” For women in each occupational group (separately by race), we make the adjustment by regressing the log of real wage in the 1940 and 1950 samples on observable characteristics and a year dummy for observations from the 1950 sample.25
The regressions control for a set of age, education, hours, and region of residence dummy variables as well as binary indicators for marital status, metropolitan residence and the presence of a child at home.
Wage gains were pervasive across occupational categories in the 1940s, with the largest gains occurring in service jobs. Black women were heavily concentrated in service jobs, and despite the large wage gains, this was the only nonfarm employment category with a declining share of black women's employment. Although wage gains in the service category for white women were also large, the effect on the overall white wage structure was comparatively small due to the low representation of white women in service. Rather, white women were highly concentrated in the professional, clerical, and sales category, the job category experiencing the smallest increase in wages. These broad patterns remain even after adjusting for observable characteristics (column 4). Complementing the effect of differential wage gains across occupations, it is evident that within each category (except the “laborer” category, where very few women worked) the wage gains were larger for black women than for whites.26
An earlier version of this article included partitions by region and educational category. Wage gains by southern blacks exceeded those of blacks elsewhere, and within every region, black wage gains far exceeded those of whites. Nonetheless, the importance of the differential wage growth in the South should not be overstated: assigning southern black women the percentage wage gains that occurred elsewhere (rather than the southern increase) would lower the national average wage gain by only a few percentage points.
Changes in Occupational Distributions, 1910–1970
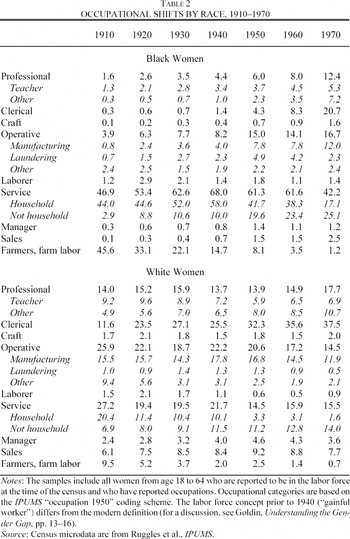
The extraordinary demands of wartime production and the conscription of men for the armed services induced a significant redistribution of women across occupations in the 1940s. The sharpness of the break in the 1940s is evident in Table 2, which documents the occupational distributions of black and white women from 1910 to 1970. Through most of the twentieth century, white women were much more likely than black women to be employed in professional, clerical, sales, and operative jobs. In contrast, black women were much more likely to be employed in household service and agriculture.

Between 1940 and 1950, the representation of black women in household service declined rapidly, a clear departure from the steady increases from 1910 to 1940. At the same time, the proportion of black women working as operatives almost doubled. Although the proportion of white women employed in household service also declined (from a relatively low base), the proportion working as operatives remained fairly constant. Instead, white women's representation in the clerical sector increased by almost seven percentage points. The transitions among white and black women appear especially large given the gradual nature of changes before 1940 (and in the 1950s). In fact, a simple dissimilarity index calculated across broad occupational categories (similar to those in Table 2) for each census year is essentially flat from 1910 to 1940 (approximately 0.61) before declining in the 1940s (to approximately 0.53).27
The dissimilarity index indicates the proportion of a group (for example, black women) that would have to switch occupations to match the occupational distribution of another group (for example, white women). We calculate it with broad occupational groupings similar to those in Table 2, using only the “main row” figures for professional and operative jobs (not the subcategories) and the subcategory rows for service jobs.
Wolfbein, “War,” p. 2.
It is possible that changes in observable characteristics, such as educational attainment and region of residence, may account for the striking racial differences in occupational sorting among women.29
The impact of educational attainment on wages is a major theme in the literature on racial wage convergence among men, especially post-1960 (Smith and Welch, “Black Economic Progress”; Margo, Race; and Card and Krueger, “School Quality”), but less is known about the long-run implications for women's labor market outcomes.
The census reports literacy until 1930. To maintain a consistent specification over time, we assume that those who finished at least second grade are literate by census standards (see Margo, Race, for justification of this threshold).
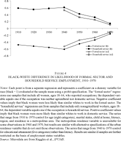
Figure 4 plots the estimated coefficients on the race dummy variable. Three important points are immediately clear. First, the racial differences were large even when controlling for observable characteristics. At mid-century, measures of educational background and geographic location do not explain the crowding of black women in domestic service. Second, there was little change in the association between race and the likelihood of employment in the formal sector or domestic service from 1910 to 1940. During the 1940s, however, there was a sharp decline in the likelihood of black women being household servants. Closely related is the abrupt increase in the conditional likelihood of employment in the formal sector, which reflects movement out of both agriculture and household service. Finally, there was no reversion after the 1940s. The estimated race coefficients continued on the path set in the 1940s.

FIGURE 4 BLACK-WHITE DIFFERENCE IN LIKELIHOOD OF FORMAL SECTOR AND HOUSEHOLD SERVICE EMPLOYMENT, 1910–1970
Such measures are, of course, indirect and imperfect indicators of discriminatory practices in hiring, but they suggest a retreating color line in some areas of the formal sector. Just as black women were much more likely to work as household servants than would be predicted on the basis of their observable characteristics in 1940, they were far less likely to work in operative and clerical jobs. Nonetheless, during the 1940s, the magnitude of the race coefficient (from similar probit regressions) fell from −0.16 to −0.08 for operative workers.31
The underlying sample for this calculation includes farm workers, whereas in Figure 4 we calculated the household service regressions for samples that exclude farm workers.
See Cunningham and Zalokar, “Economic Progress”; and Sundstrom, “Servants,” on long-run occupational change.
DECOMPOSING WOMEN'S WAGE GAINS IN THE 1940S
To quantify the importance of changes in workers' personal characteristics, in workers' geographic distribution, in the overall wage structure, and in the wage structure for black women relative to white women, our decompositions employ a semiparametric technique pioneered by DiNardo, Fortin, and Lemieux (henceforth “DFL”).33
DiNardo, Fortin, and Lemieux, “Labor Market.”
Blinder, “Wage Discrimination”; and Oaxaca, “Male-Female Wage Differentials.” See Acemoglu, Autor, and Lyle, “Women,” on the potential effects of changes in women's labor supply on wage inequality during the 1940s.
In the next step, we carry this decomposition further by estimating the race-specific changes in the labor market returns to worker characteristics during the 1940s. We use these estimates to distinguish between the changes in black women's wage structure that were in common with those among white women and the changes that accrued specifically to blacks. Both steps of the decomposition provide a rich characterization of changes across the full range of the wage distribution, while relaxing assumptions about the wage structure that are implicit in Blinder-Oaxaca decompositions.35
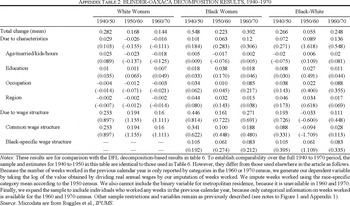
See Barsky et al., “Accounting,” for a discussion of potential problems associated with standard parametric assumptions and the strengths of this technique in the context of decomposing the inter-racial wealth gap. See Appendix Table 2 for Blinder-Oaxaca decompositions.
Accounting for Changes in Worker Characteristics
Let W be a random variable denoting the log of weekly wages, X denote the vector of individual characteristics, and tw and tx be binary random variables that indicate the year (1940 or 1950) in which either W or X, respectively, is observed. For example, an observation on an individual sampled in the 1950 census could be written (W, X, tw = 50, tx = 50). We assume that wages and characteristics have the joint distribution, F(w, x, tw, tx). Thus, the joint distribution of wages and attributes in 1950, for instance, can be written as F(w, x| tw = 50, tx = 50). Using Bayes' rule, the marginal density of wages in 1950 can be written as the expected value of the conditional density of wages given the vector of characteristics, X, in 1950, or

Supposing that workers' characteristics had remained distributed as they were in 1940 and that the changes in characteristics over the 1940s did not affect the wage structure, the counterfactual wage distribution may be written as a weighted function of the actual 1950 density,

where

is a counterfactual “reweighting function” that is applied to the 1950 wage density. This function is simply the ratio of the probability mass in 1940 to that in 1950 for the realization of a specific set of characteristics, X. For instance, a woman observed in 1950 whose characteristics are less likely to be observed in 1940 receives less weight in the counterfactual distribution, whereas a woman in 1950 with characteristics more likely to be observed in 1940 receives more weight. In this manner, the counterfactual density is obtained by reweighting every individual observed in 1950 such that the distribution of characteristics in 1950 resembles the distribution of Xs in 1940.
This high-dimensional reweighting function can be transformed into a simple estimation problem by again applying Bayes' rule and the definition of discrete probability functions

We estimate the first ratio of the final expression and use the ratio of the count of observations in 1950 to the count in 1940 for the second ratio. After obtaining estimates of ψx for each individual in 1950, the empirical distribution and the weights are used to compute the counterfactual wage distribution. More details on our implementation of this method are available in Appendix 2.
Accounting for Changes in the Wage Structure
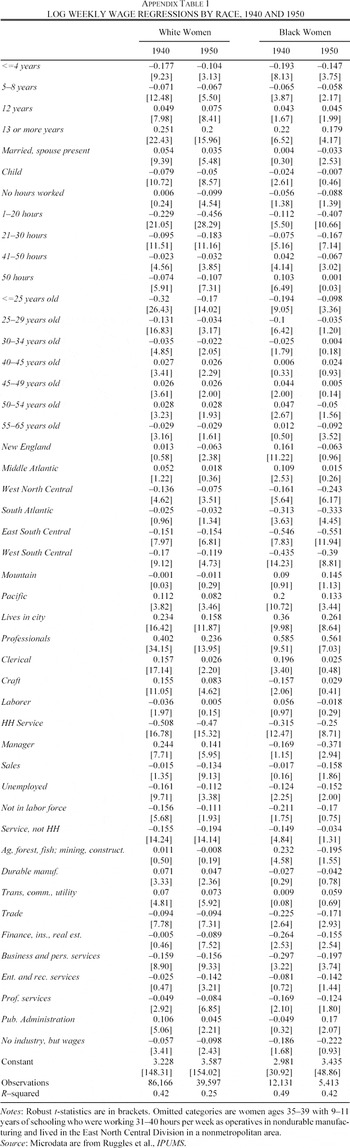
To incorporate the influence of the changing structure of wages into the decomposition framework, we estimate separate wage regressions for white and black women in 1940 and 1950, including controls for age, education, region, occupational and industrial categories, marital and child status, and metropolitan residence

where r indexes race and y indexes the year. Based on the estimates of β from these regressions, we predict a counterfactual 1940 wage for each woman observed in the 1950 sample using the equation

This adjustment simulates the 1940 wage distribution by adjusting the estimated returns to various observable characteristics in 1949 to those prevailing in 1939. Wage structure changes for black women can be further decomposed into two parts: a part attributable to changes in the “common wage structure” (that is, changes that parallel those for white women); and a part attributable to differential changes in the labor market returns for black women relative to white women. Thus, the simulated 1940 wage for a black woman observed in 1950 can be written as

In equation 7, the second term,

, captures the change in the common wage structure. The last term,

, represents differential changes in the wage structure for black women relative to white women. In combination with the procedure that reweights the 1950 observations to simulate the 1940 distribution of characteristics, the final counterfactual distribution approximates the full 1940 wage distribution.
36We adjust the prices after reweighting 1950 characteristics to reflect those observed in 1940. Thus, after obtaining the estimates from equation 7, we use the distribution generated by

(where θi denotes the sample line weight assigned to individual i in 1950) to decompose the prices.
Decomposition Results: Women's Absolute Wage Gains
In the context of this article's investigation, it is useful to partition the vector of individual characteristics, X, into four subsets presented here in the order they enter the decomposition: a set of individual attributes including eight age categories, eight hours-worked categories, and indicator variables for marital status and the presence of a child at home; a set of five dummy variables denoting levels of educational attainment; a set of 11 occupational and ten industrial categories; and a set of location dummies, including nine census region categories and an indicator variable for metropolitan residence. We provide more detailed definitions of each of these variables in Appendix 1 and present Blinder-Oaxaca decomposition results for comparison in Appendix Table 2. Because we are especially interested in the fraction of the total change in wages attributable to occupational upgrading and the changing compensation structure after accounting for personal (age, marital status, child present in home, hours worked) and productive (education) characteristics, these characteristics enter first in the decomposition sequence.37
This is similar in spirit to correcting for selection on observable worker characteristics. For a discussion of the potential importance of selection on unobservables for the ratio of mean wages, see the text.
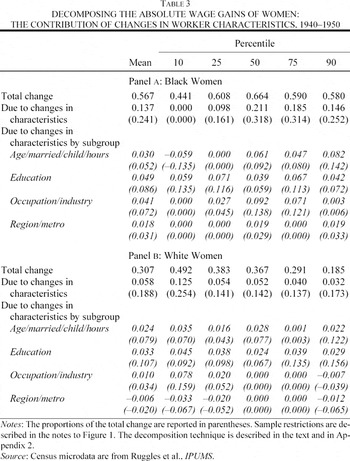
Table 3 presents the results for black (panel A) and white (panel B) women. Taken together, changes in observable characteristics (second row of panel A) account for an increase of 0.14 log points at the mean of the black women's distribution, or about one-quarter of their average wage gains during the decade. However, at different points in the wage distribution, changes in characteristics account for different proportions of the wage gains. At the tenth percentile, for example, observable characteristics account for none of the gains among black women. For white women, the total wage increase at the mean is much smaller than for blacks, as is the contribution of changes in observable characteristics (0.06 log points, or 19 percent of the total gain at the mean).

Table 3 also breaks down the results into the four detailed subcomponents described above. For black women, changes in the basic composition of the work force (age, marital status, child at home, and hours supplied) tended to raise weekly wages by the most at and above the median. In contrast, the influence of these characteristics is smaller for white women throughout the distribution.38
The nature of the decomposition, which adjusts for personal characteristics simultaneously, makes it difficult to infer precisely what drives this result. A Blinder-Oaxaca decomposition at the means suggests that no single component of these characteristics is responsible.
It is possible, of course, that nonpecuniary aspects of their jobs improved.
After accounting for occupational and industrial changes, the remaining influence of geographic shifts is small for both black and white women. A narrow interpretation of this finding is that locational shifts per se were not major factors in racial wage convergence in the 1940s (for example, movements of domestic servants from the South Atlantic to the Mid-Atlantic census regions did not contribute much if the migrants remained domestic servants). A broader interpretation is that the geographic redistribution of black workers out of the rural South and into cities coincided with their occupational and industrial mobility. The implication is that the Great Migration's influence on black women's wages in the 1940s was inextricably linked to the job changes that migration facilitated.
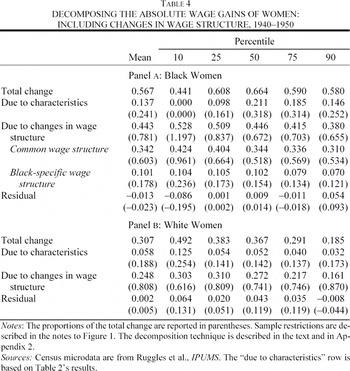
Table 4 decomposes changes in the wage structure. Panel A breaks the absolute real wage gains for black women into four components: the influence of changing characteristics (as reported in Table 3), the influence of changes in the common wage structure for women, the influence of differential changes in the wage structure for black women (relative to whites), and a residual. At the median and mean, the contribution of wage structure changes is more than twice that of changes in characteristics. In other words, near the center of the distribution, changes in characteristics account for one-quarter to one-third of black women's absolute wage gains, whereas changes in the wage structure account for the other two-thirds to three-quarters. Differential changes in the wage structure for black women (in the row labeled “black-specific wage structure”) account for roughly 15 percent of the absolute wage gains. Panel B of Table 4 reports analogous results for white women.40
Because we designate the wage structure for white women as the “common wage structure” in equation 7, there is no distinction between “common” and “race-specific” changes for white women (panel B).

More detailed wage structure decompositions are difficult to interpret and potentially misleading, because they hinge crucially on the choice of a comparison group to represent the “baseline” wage increases.41
The mean changes in unobservable characteristics as well as those characteristics in the omitted categories of dummy variables are captured in the regression intercept. See Jones, “On Decomposing the Wage Gap.” The interpretation of the baseline wage changes and, by extension, the magnitude of changes attributed to changes in other “price” components is ambiguous.
These results are available from the authors upon request.
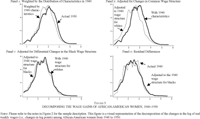
The implications of changes in worker characteristics and in the wage structure for the wage distribution of black women can be seen in Figure 5. Each panel shows how the distribution changes during one step of the decomposition process. Panel A moves from the actual 1950 wage distribution to a counterfactual with 1940's worker characteristics (but with the 1950 wage structure). Panel B starts with the previous panel's counterfactual distribution and shows how adjusting the common wage structure affects the distribution's shape and location—the new counterfactual distribution is much further to the left because of the large baseline wage gains in the 1940s. The change in Panel C reflects differential changes in the black wage structure. The influence appears to be small in terms of percentage change in absolute wage levels, but the black-specific wage adjustment is significant in terms of narrowing the black-white wage gap. The last panel simply graphs the counterfactual distribution from panel C against the actual 1940 wage distribution. The differences between the two are reported in Table 4 (panel A) as residuals.

FIGURE 5 DECOMPOSING THE WAGE GAINS OF AFRICAN-AMERICAN WOMEN, 1940–1950
Decomposition Results: Wage Convergence between Black and White Women
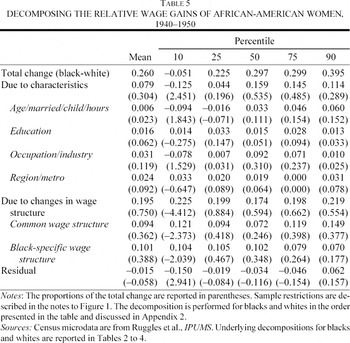
Table 5 distills the implications of the decomposition analysis for wage convergence. First, the median of the black real wage distribution increased by 0.30 log points more than the median of the white distribution. At other points in the distribution, however, the difference between blacks' and whites' gains differed, as implied by Figure 3. Wages at the tenth percentile of the black women's distribution declined relative to those at the tenth percentile of the white distribution, and the wage gap widened. Elsewhere in the distribution, gains among blacks were larger than among whites. The unevenness of the relative gains over the percentiles reflects, among other things, the strong compression of wages among white women (for example, slow wage growth at the ninetieth percentile compared to the tenth) and the lack of compression in the distribution for black women that we noted above.

Second, the “due to characteristics” section of Table 5 combines the information from each panel of Table 3 to highlight the contributions of changes in characteristics to wage convergence between white and black women. Black workers' educational gains contributed to convergence at every percentile, though the magnitude is not large. Occupational and industrial shifts appear to have been more important factors for racial convergence, especially from the fiftieth to seventy-fifth percentiles. These shifts together with geographic relocation made an economically significant and direct contribution to the narrowing of the race gap among women, especially above the twenty-fifth percentile.
Third, changes in the wage structure made even larger contributions to wage convergence than changes in characteristics throughout the percentile distribution. These contributions were roughly evenly split between the “common” and “black-specific” changes in the wage structure, averaging approximately 0.10 log points each. Thus, there was a great deal of catch-up for black workers “within categories,” and rapid wage growth in occupations and industries that employed large shares of the black workforce reinforced this convergence.
Comparing the 1940s Wage Gains with Those in the 1950s and 1960s
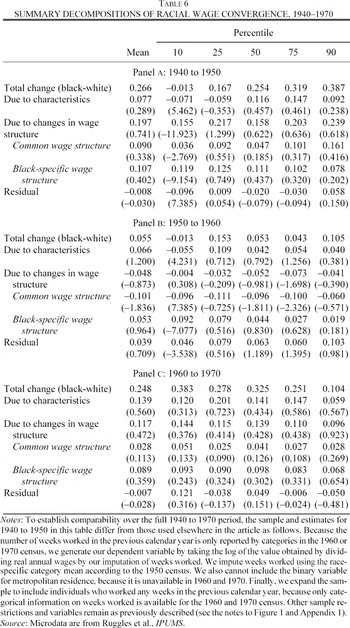
Table 6 places the 1940s in comparative perspective by applying the same decomposition methods to racial wage convergence in the 1950s (panel B) and 1960s (panel C).43
For comparison with the DFL-based decomposition results, readers can find Blinder-Oaxaca decompositions (at the means) in Appendix Table 2.

The pace of income convergence was much faster during the 1940s than during the 1950s. This was true despite the continuing migration of blacks from the rural South, the continuing decline in household service employment, and the continuing improvements in workers' educational attainment. Each of these factors is reflected in the positive figures in the “due to characteristics” row of panel B. Overall, black workers' wages increased by approximately 5 percent relative to white workers at both the means and medians of the distributions in the 1950s, approximately one-fifth of the size of the relative increase during the 1940s. The “black-specific wage structure” line indicates that black workers in the 1950s continued to gain relative to whites within categories, but changes in the common wage structure more than offset the black-specific improvements. Thus, an important difference between the 1940s and 1950s is that changes in the wage structure tended to raise the relative wages of black women in the 1940s but not in the 1950s.
In contrast, the narrowing of the mean wage gap between black and white women during in the 1960s was comparable in magnitude to that in the 1940s. However, the gains were spread differently across the percentiles of the distribution. In the 1960s, relative wage gains were large at the tenth percentile (but not in the 1940s), and they were small at the ninetieth percentile (but large in the 1940s). The differing results in the 1940s and 1960s at the tenth percentile are closely connected to changes in worker characteristics. In the 1940s, changes in worker characteristics tended to widen the wage gap at the tenth percentile (see Table 3), but in the 1960s the gains associated with occupational and educational attainment were larger for black than for white women. At the ninetieth percentile, changes in the common wage structure in the 1940s that dampened wage growth at the top of the white wage distribution, but not at the top of the black distribution, account for a large share of the differing results between the 1940s and the 1960s.
In both the 1940s and the 1960s, changes in black workers' characteristics, locations, and jobs, in addition to black-specific changes in the wage structure made large contributions to black-white wage convergence. In the 1960s, however, changes in the common wage structure had a smaller impact on convergence than in the 1940s. Thus, wage convergence in the 1960s was overwhelmingly a story of race-specific factors: black women got better jobs (breaking through into clerical work), and within job categories, black women's wages increased much faster than white women's.
INTERPRETATION AND CONCLUSION
This article's emphasis on the 1940s as a break from past experience places recent research on racial wage convergence in a broader historical perspective and provides a natural and essential point of departure for the study of more recent labor market trends. The literature's disproportionate emphasis on men in the post-1964 period obscures labor market developments that favored both African-American workers and women well before the era of Civil Rights and Equal Rights. Moreover, understanding the distinctions between black and white women's experiences informs a deeper understanding of the influence of race and gender in labor markets over the course of the twentieth century.
The wartime economy, though exceptional and temporary, had an extensive and sustained impact on the economic status of African-American, female workers. Job and geographic mobility, strong wage growth in jobs that employed many black women, and large increases in the compensation of black women relative to whites within job categories propelled large gains in black women's weekly wages. At the mean, changes in black women's observable characteristics, especially occupational upgrading, account for about one-third of the 1940s' racial wage convergence. Apart from the occupational redistribution, changes in the general wage structure account for another third of racial wage convergence. The remaining third of wage convergence is associated with wage gains among black women than exceeded those of observationally similar whites.
The movement out of household service jobs and, even more importantly, wage gains within service jobs are central to this story. The economics literature has rarely studied household service occupations despite George Stigler's observation that “in 1939 there were as many domestic servants as employees of the railroads, coal mines, and automobile industry combined.”44
Stigler, “Domestic Servants,” p. 2. See also Anderson and Bowman, “Vanishing Servant.”
This interpretation is consistent with contemporary observations. For example, based on a wartime survey in New Orleans, Harlan Gilmore and Logan Wilson report that “the principal complaints coming from full-time employers [of servants], however, were that the better types of servants were going into war industry” and that part-time employers “blamed rising wages and the shortage of really competent Negro women” on the defense boom. “As one housewife expressed it: ‘To tell you the truth, I think they're [black women] making too much money…. I hope I'll live to see the day when they'll be glad to work for you again.’”45
Gilmore and Wilson, “Employment,” pp. 321–22.
That day never arrived. Even during the economy's postwar reconversion, black women did not typically return to domestic service or farm occupations. Based on information collected by the Census Bureau, Seymour Wolfbein reports a slight decline in both domestic service and farm shares of black female employment between April 1944 and April 1947.46
Wolfbein, “Postwar Trends,” p. 664.
The 1940s were not the last decade of dramatic racial wage convergence among women, but they were the first in the twentieth century. A number of plausible, and perhaps complementary, explanations for this turning point warrant further exploration. The sharp increase in demand for workers during the war, in combination with a sharp decline in the availability of new immigrants, might have led employers to seek out black workers.47
Kryder, Divided Arsenal; and Collins, “When the Tide.”
Klinkner and Smith, Unsteady March.
Reed, Seedtime; Kersten, Race; and Collins, “Race” and “Labor Market Impact.”
Northrup, Organized Labor. See also Moreno, Black Americans.
Appendix 1: Data and Sample Description
The 1940 and 1950 data samples are drawn from the IPUMS. We exclude a number of workers to maintain consistent samples over time. The samples include workers between the ages of 18 and 64, who were not in school, in the Armed Forces, or self-employed (because nonwage income is not reported in 1940); who were not farmers, farm managers, or farm workers; who did not reside in institutional group quarters; and who worked more than four weeks in the previous calendar year.
For the decomposition analysis, the age categories group individuals as follows: 18 to 24, 25 to 29, 30 to 34, 35 to 39, 40 to 44, 45 to 49, 50 to 54, and 55 to 64 years old. The hours categories are no hours in the previous week (but with reported income for the previous year), 1 to 14 hours, 15 to 29, 30 to 34, 35 to 39, 40, 41 to 48, 49 to 59, and 60 or more hours. Categories for educational attainment pertain to those with less than five years, five to eight, nine to 11, exactly 12 years, and more than 12 years of schooling. Occupational groups are professionals, operatives, laborers, household workers, other service workers, managers, sales persons, clerical workers, crafts persons, or newly employed (without an occupation in the previous year). Industrial groups are agriculture/forestry/fishing/mining/construction, durable manufacturing, nondurable manufacturing, transportation/communication/utilities, trade, finance/insurance/real estate, business and personal services, professional services, entertainment/recreation services, and public administration. In the regressions, we omit the category of unmarried women ages 35 to 39 with 9 to 11 years of schooling, who worked as nondurable manufacturing operatives for 31 to 40 hours in the week before the census and lived in the East North Central census division.
Appendix 2: Obtaining Counterfactual Wage Distributions
In equation 2, we illustrate how to construct a counterfactual wage distribution by setting all individual attributes to 1940 levels simultaneously. In the context of this article's investigation, it is useful to partition the vector of individual characteristics, (X, tx), into four subsets, (Z, tz; E, te; O, to; M, tm) and sequentially apply new weights to the 1950 wage distribution. Let Z be a vector of individual attributes including eight age categories, six hours categories, and indicator variables for marital status and the presence of a child at home; E a set of five dummy variables for educational attainment; O 11 occupational and 10 industrial categories; and M a set of indicator variables for the nine census regions and metropolitan residence. As before, t denotes a binary random variable for the year of observation (either 1940 or 1950) and the subscript indicates its relevance to each subset of characteristics.
Beginning with the observed 1950 wage distribution, we reweight each set of characteristics to reflect the distribution of those characteristics observed in 1940. We, first, reweight the distribution of personal characteristics, Z; then the distribution of years of educational attainment, E; then the distribution of occupations and industries, O; and finally the regional and metropolitan distribution of workers, M. At each step in this sequence, the new counterfactual distribution allows us to assess how changes in a subset of characteristics transformed the overall distribution of wages. The sequence of adjustments matters quantitatively because each subcomponent's contribution is measured in relation to the counterfactual distribution generated in the previous step and because we estimate the reweighting functions, which vary slightly depending upon the particular combination of variables included. We selected this particular sequence with the idea that we are first adjusting for changes in the worker's basic characteristics and education level (loosely speaking, these are “premarket factors”), and then for how workers are sorted once in the labor market (occupationally, industrially, and geographically).
Using the same procedure as outlined in equation 2, we reweight the 1950 wage distribution using the following reweighting function

Similarly, we generate the counterfactual density of wages that would have prevailed if individual attributes and education were distributed as in 1940 by estimating the reweighting function

and applying these estimates in conjunction with those for ψz to each observation in 1950. In the same manner, the counterfactual wage distribution that would have prevailed if individual attributes, education and occupation were observed as in 1940 can be obtained using estimates of the reweighting function

Finally, the counterfactual wage distribution that would have prevailed if individual attributes, education, occupation, and geographic distribution had remained as in 1940 can be obtained using estimates of the reweighting function

Thus, we estimate probits with successively fewer variables by race to obtain a weight for each individual observation in the 1950 distribution. We first apply the estimates of ψz to each observation in 1950 to obtain the first counterfactual density; then we apply the product of ψz and ψe; then the product of ψz, ψe, and ψo; and finally, the product of ψz, ψe, ψo, and ψm. Notice, this last product is mathematically equivalent to ψx in equation (3). The reweighted empirical distribution is used to estimate the counterfactual percentiles (presented in Tables 2, 3, 5, 6, and 7) at each stage in the sequence.
Appendix 3: Estimates
Appendix Tables 1 and 2 present the log weekly wage regressions by race, 1940 and 1950, and the Blinder-Oaxaca decomposition results, 1940–1970, respectively.


Bailey gratefully acknowledges support from the Economic History Association, the University of Illinois Foundation's Rovensky Fellowship, the Robert Wood Johnson Foundation, and Vanderbilt University. Collins recognizes support from the National Science Foundation (0095943) and the Brookings Institution's Model-Okun Fellowship. Jeremy Atack, Emily Boleman, Yanqin Fan, T. Aldrich Finegan, Price Fishback, Gillian Hamilton, Thomas Maloney, Robert A. Margo, anonymous referees, and NBER and Economic History Association conference participants made many helpful suggestions. Claudia Goldin kindly provided data from the Palmer Survey.