1 Introduction
It is well known that transition from a laminar to a turbulent regime in wall-bounded low speed flows is delayed if the viscosity of the fluid decreases near the solid surfaces, while early transition results from the opposite variation of viscosity. Experimental evidence was provided since the late 1940s by using heated plates in boundary layer flows of air, for which the viscosity increases with temperature. In such a flow configuration transition to turbulence occurs earlier, as compared to the unheated case (Liepmann & Fila Reference Liepmann and Fila1947). On the contrary, an increase of the critical Reynolds number for transition of up to an order of magnitude was reported in flows of water, for which the viscosity decreases with temperature, over heated surfaces of various geometries (Strazisar, Reshotko & Prahl Reference Strazisar, Reshotko and Prahl1977; Strazisar & Reshotko Reference Strazisar and Reshotko1978; Barker & Gile Reference Barker and Gile1981; Lauchle & Gurney Reference Lauchle and Gurney1984). The physical interpretation often invoked to explain this effect is that lower viscosity close to the wall results in a fuller mean velocity profile, which is less susceptible to showing an inflectional point.
Linear stability analysis of the incompressible Navier–Stokes equations with a non-uniform temperature field has been so far the main tool adopted to shed light on how property variations influence transition to turbulence. Several authors have focused on canonical flows, such as boundary layers or channel flows, and demonstrated the strong stabilising effect of lower viscosity close to the wall on the least damped eigenvalue, as compared to cases with constant properties at the same Reynolds number (Schäfer & Herwig Reference Schäfer and Herwig1993; Wall & Wilson Reference Wall and Wilson1996, Reference Wall and Wilson1997). Govindarajan, L’vov & Procaccia (Reference Govindarajan, L’vov and Procaccia2001) showed that the mechanism responsible for the stabilisation of the laminar profile is a reduced intake of energy from the mean flow by the perturbation velocity field, which reduces the production term in the perturbation kinetic energy (PKE) balance. This effect is maximised when the viscosity variation is localised at the critical layer.
The mentioned studies are based on eigenvalue analyses, thus they provide information on the flow behaviour for long evolution times. However, transition to turbulence can occur in a subcritical scenario at significantly lower Reynolds numbers than the critical value predicted by the linear theory. Transient amplification of PKE in linearly stable flows due to the non-normality of the linearised operator offers a possible mechanism to trigger secondary instabilities and, eventually, transition to turbulence (Schmid & Henningson Reference Schmid and Henningson2001). Chikkadi, Sameen & Govindarajan (Reference Chikkadi, Sameen and Govindarajan2005), Sameen & Govindarajan (Reference Sameen and Govindarajan2007) have demonstrated that a non-uniform mean viscosity distribution in the direction normal to the walls only marginally affects the maximum transient growth in a plane channel. This conclusion was reversed by Nouar, Bottaro & Brancher (Reference Nouar, Bottaro and Brancher2007), who accounted for the interaction between viscosity and velocity fluctuations in studying the stability of shear-thinning fluids. They showed that a viscosity contrast is, indeed, a viable solution to delay transition as the transient energy growth of small perturbations is strongly reduced as the consequence of the interaction between the fluctuating fields. Further discussion on instabilities of viscosity stratified flows is reported in the review by Govindarajan & Sahu (Reference Govindarajan and Sahu2014).
Despite the relevance of the large potential for transient growth of perturbations in wall-bounded shear flows, transition is a predominantly nonlinear phenomenon, whose manifestation depends on the existence of attracting solutions of the Navier–Stokes equations other than the laminar state (Waleffe Reference Waleffe1995). In the last decade, new momentum to understanding subcritical transition in linearly stable shear flows has been given by approaching the problem from a fully nonlinear perspective rooted in dynamical systems theory. In a state space representation the laminar flow regime is an attractor while turbulence is generally understood as a saddle. Experimental and numerical investigations of transition in pipe flows, which are linearly stable to any small perturbations, showed that turbulence is only a transient phenomenon if the Reynolds number is low. Localised patches of turbulence, also called puffs, eventually decay towards a laminar state at a rate that decreases super-exponentially with the Reynolds number (Hof et al. Reference Hof, Westerweel, Schneider and Eckhardt2006; Eckhardt et al. Reference Eckhardt, Schneider, Hof and Westerweel2007; Hof et al. Reference Hof, De Lozar, Kuik and Westerweel2008). Similar observations were documented in Couette flow, where the lifetime of turbulent spots increases with the Reynolds number, but remained finite (Schneider et al. Reference Schneider, De Lillo, Buehrle, Eckhardt, Dörnemann, Dörnemann and Freisleben2010a ). At sufficiently high Reynolds numbers and in large domains puffs start to proliferate at a rate which outpaces the decay rate of the single puff and quickly fill the domain bringing the flow to a sustained turbulent state (Avila et al. Reference Avila, Moxey, De Lozar, Avila, Barkley and Hof2011). This scenario changes in small domains, such as the minimal flow unit object of the present study, where turbulent spots do not have enough space to split and expand. There, turbulence is a saddle even at high Reynolds numbers, however the probability of relaminarisation rapidly drops, becoming negligible as this parameter increases. Regardless of the formal definition of turbulence, a stable manifold exists that separates flow trajectories that relaminarise from the ones that become turbulent, which is commonly referred to as the edge of chaos (Skufca, Yorke & Eckhardt Reference Skufca, Yorke and Eckhardt2006; Schneider, Eckhardt & Yorke Reference Schneider, Eckhardt and Yorke2007). There is now ample evidence that attracting solutions embedded in the manifold, so-called edge states, play a crucial role as mediators and harbingers of transition. These solutions represent minimal self-sustained perturbations that never decay nor become turbulent.
Extensive documentation of edge states is available for several canonical flows, see for example Duguet, Pringle & Kerswell (Reference Duguet, Pringle and Kerswell2008a
), Duguet, Willis & Kerswell (Reference Duguet, Willis and Kerswell2008b
) for pipe; Cherubini et al. (Reference Cherubini, Palma, Robinet and Bottaro2011), Duguet et al. (Reference Duguet, Schlatter, Henningson and Eckhardt2012), Kreilos et al. (Reference Kreilos, Veble, Schneider and Eckhardt2013), Khapko et al. (Reference Khapko, Kreilos, Schlatter, Duguet, Eckhardt and Henningson2013, Reference Khapko, Kreilos, Schlatter, Duguet, Eckhardt and Henningson2016) for boundary layers; Schneider et al. (Reference Schneider, Gibson, Lagha, De Lillo and Eckhardt2008), Duguet, Schlatter & Henningson (Reference Duguet, Schlatter and Henningson2009), Duguet et al. (Reference Duguet, Monokrousos, Brandt and Henningson2013) for Couette; and Toh & Itano (Reference Toh and Itano2003), Zammert & Eckhardt (Reference Zammert and Eckhardt2014a
,Reference Zammert and Eckhardt
b
) for channel flows. Edge states typically appear in the form of travelling waves, relative periodic orbits or chaotic objects, and exhibit low-dimensional dynamics of the fluctuating velocity field. A common feature to all the known solutions is the strong three-dimensional spatial localisation in sufficiently wide and long domains. On the other hand, in narrow and short domains, such as the minimal flow unit, the localisation is only in the wall-normal direction, see for example the asymmetric flow structures documented in Xi & Graham (Reference Xi and Graham2012), Zammert & Eckhardt (Reference Zammert and Eckhardt2014a
). In such domains, the fluctuating velocity field is reminiscent of turbulence in minimal flow units, where the turbulent fluctuations can be transiently confined to one half-channel only, leaving the other relatively undisturbed (Jiménez & Moin Reference Jiménez and Moin1991). Confining the flow to the minimal flow unit inevitably imposes the spanwise wavelength of the structures and constrains their spatial extent in the
 $z{-}y$
plane. Exact coherent states calculated in wider and longer domains may show different vertical localisation, possibly symmetric, as it is the case for the lower-branch travelling waves and relative periodic orbits documented in Zammert & Eckhardt (Reference Zammert and Eckhardt2014b
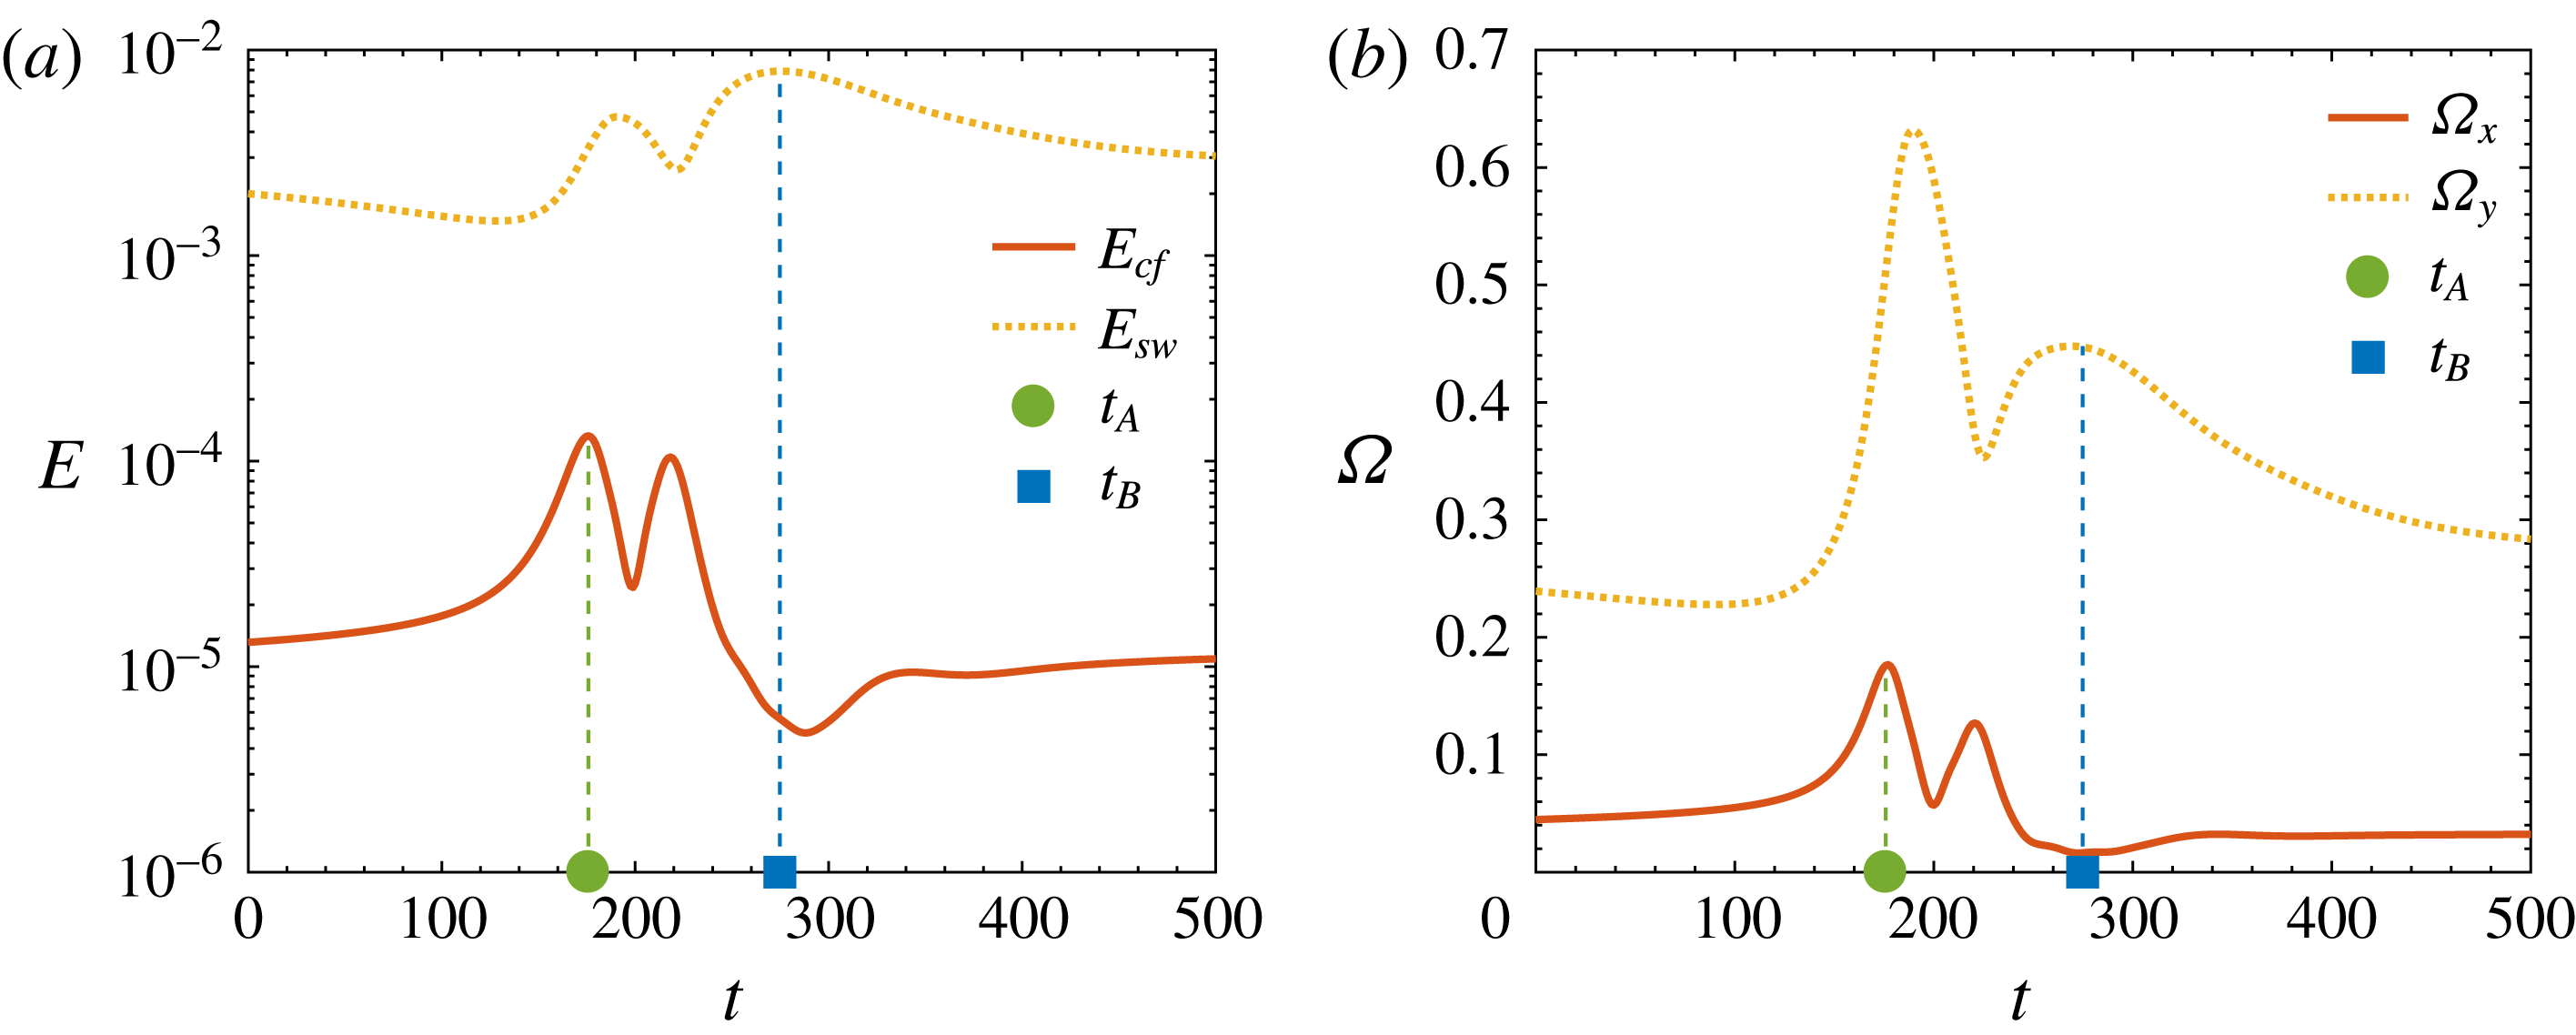
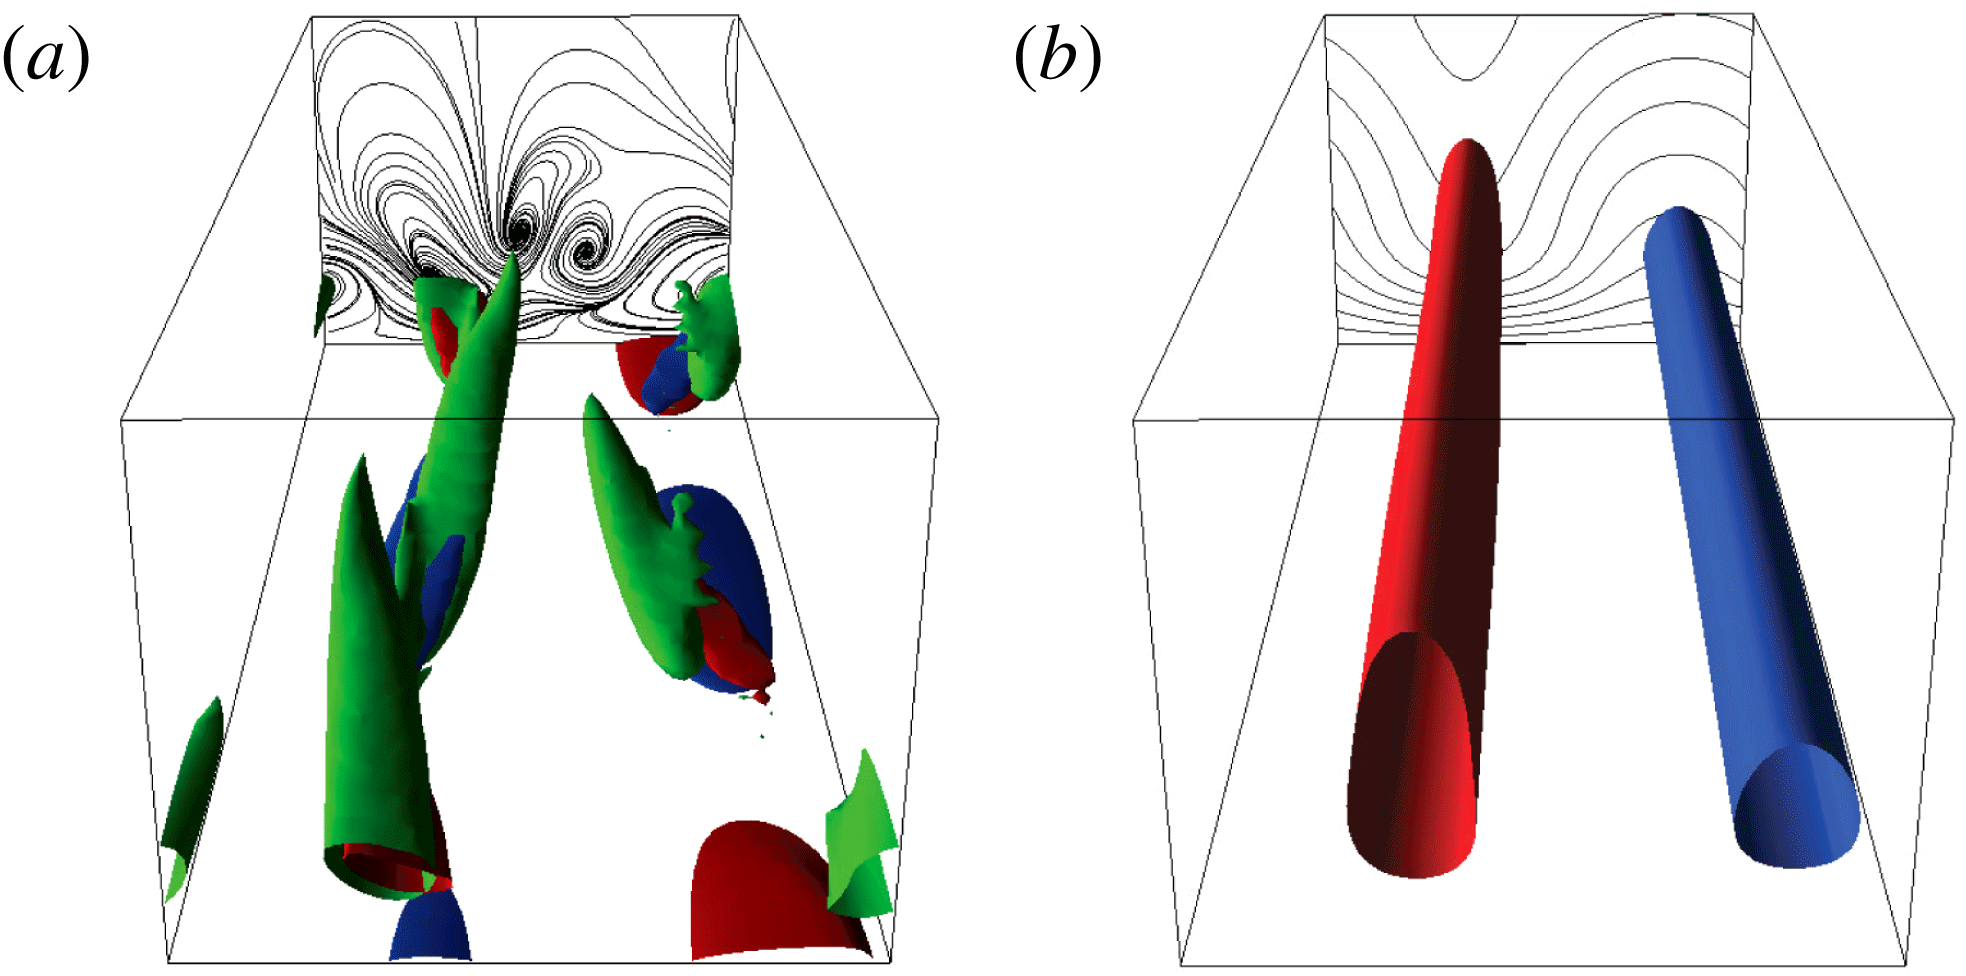
). Despite the lack of localisation in the horizontal directions of edge states in small domains, the active core is qualitatively the same as the one observed in large flow units, see for example Khapko et al. (Reference Khapko, Kreilos, Schlatter, Duguet, Eckhardt and Henningson2013, Reference Khapko, Kreilos, Schlatter, Duguet, Eckhardt and Henningson2016). It consists of flow structures that evolve in a self-sustained cycle closely resembling the one advocated in Hamilton, Kim & Waleffe (Reference Hamilton, Kim and Waleffe1995), Waleffe (Reference Waleffe1997) and the cycle of wall turbulence (Jiménez & Pinelli Reference Jiménez and Pinelli1999). Three main steps are identified, namely (i) formation of streamwise low and high speed streaks; (ii) instability of the two-dimensional velocity profile; (iii) streak breakup and formation of quasi-streamwise vortices responsible for generating new streaks. This is exemplified in figures 1 and 2 for a nearly minimal channel flow unit at the subcritical Reynolds number
 $Re=2608$
. In this configuration the edge state is a relative periodic orbit with period
 $T=1660$
. Projections on the time–energy and time–vorticity planes and snapshots of the perturbation velocity with respect to the mean profile highlight the mentioned steps of the self-sustained process. In particular, the time at which the streaks reach their maximum amplitude is indicated by
 $t_{B}$
and the time at which the intensity of the quasi-streamwise vortices is highest is indicated by
 $t_{A}$
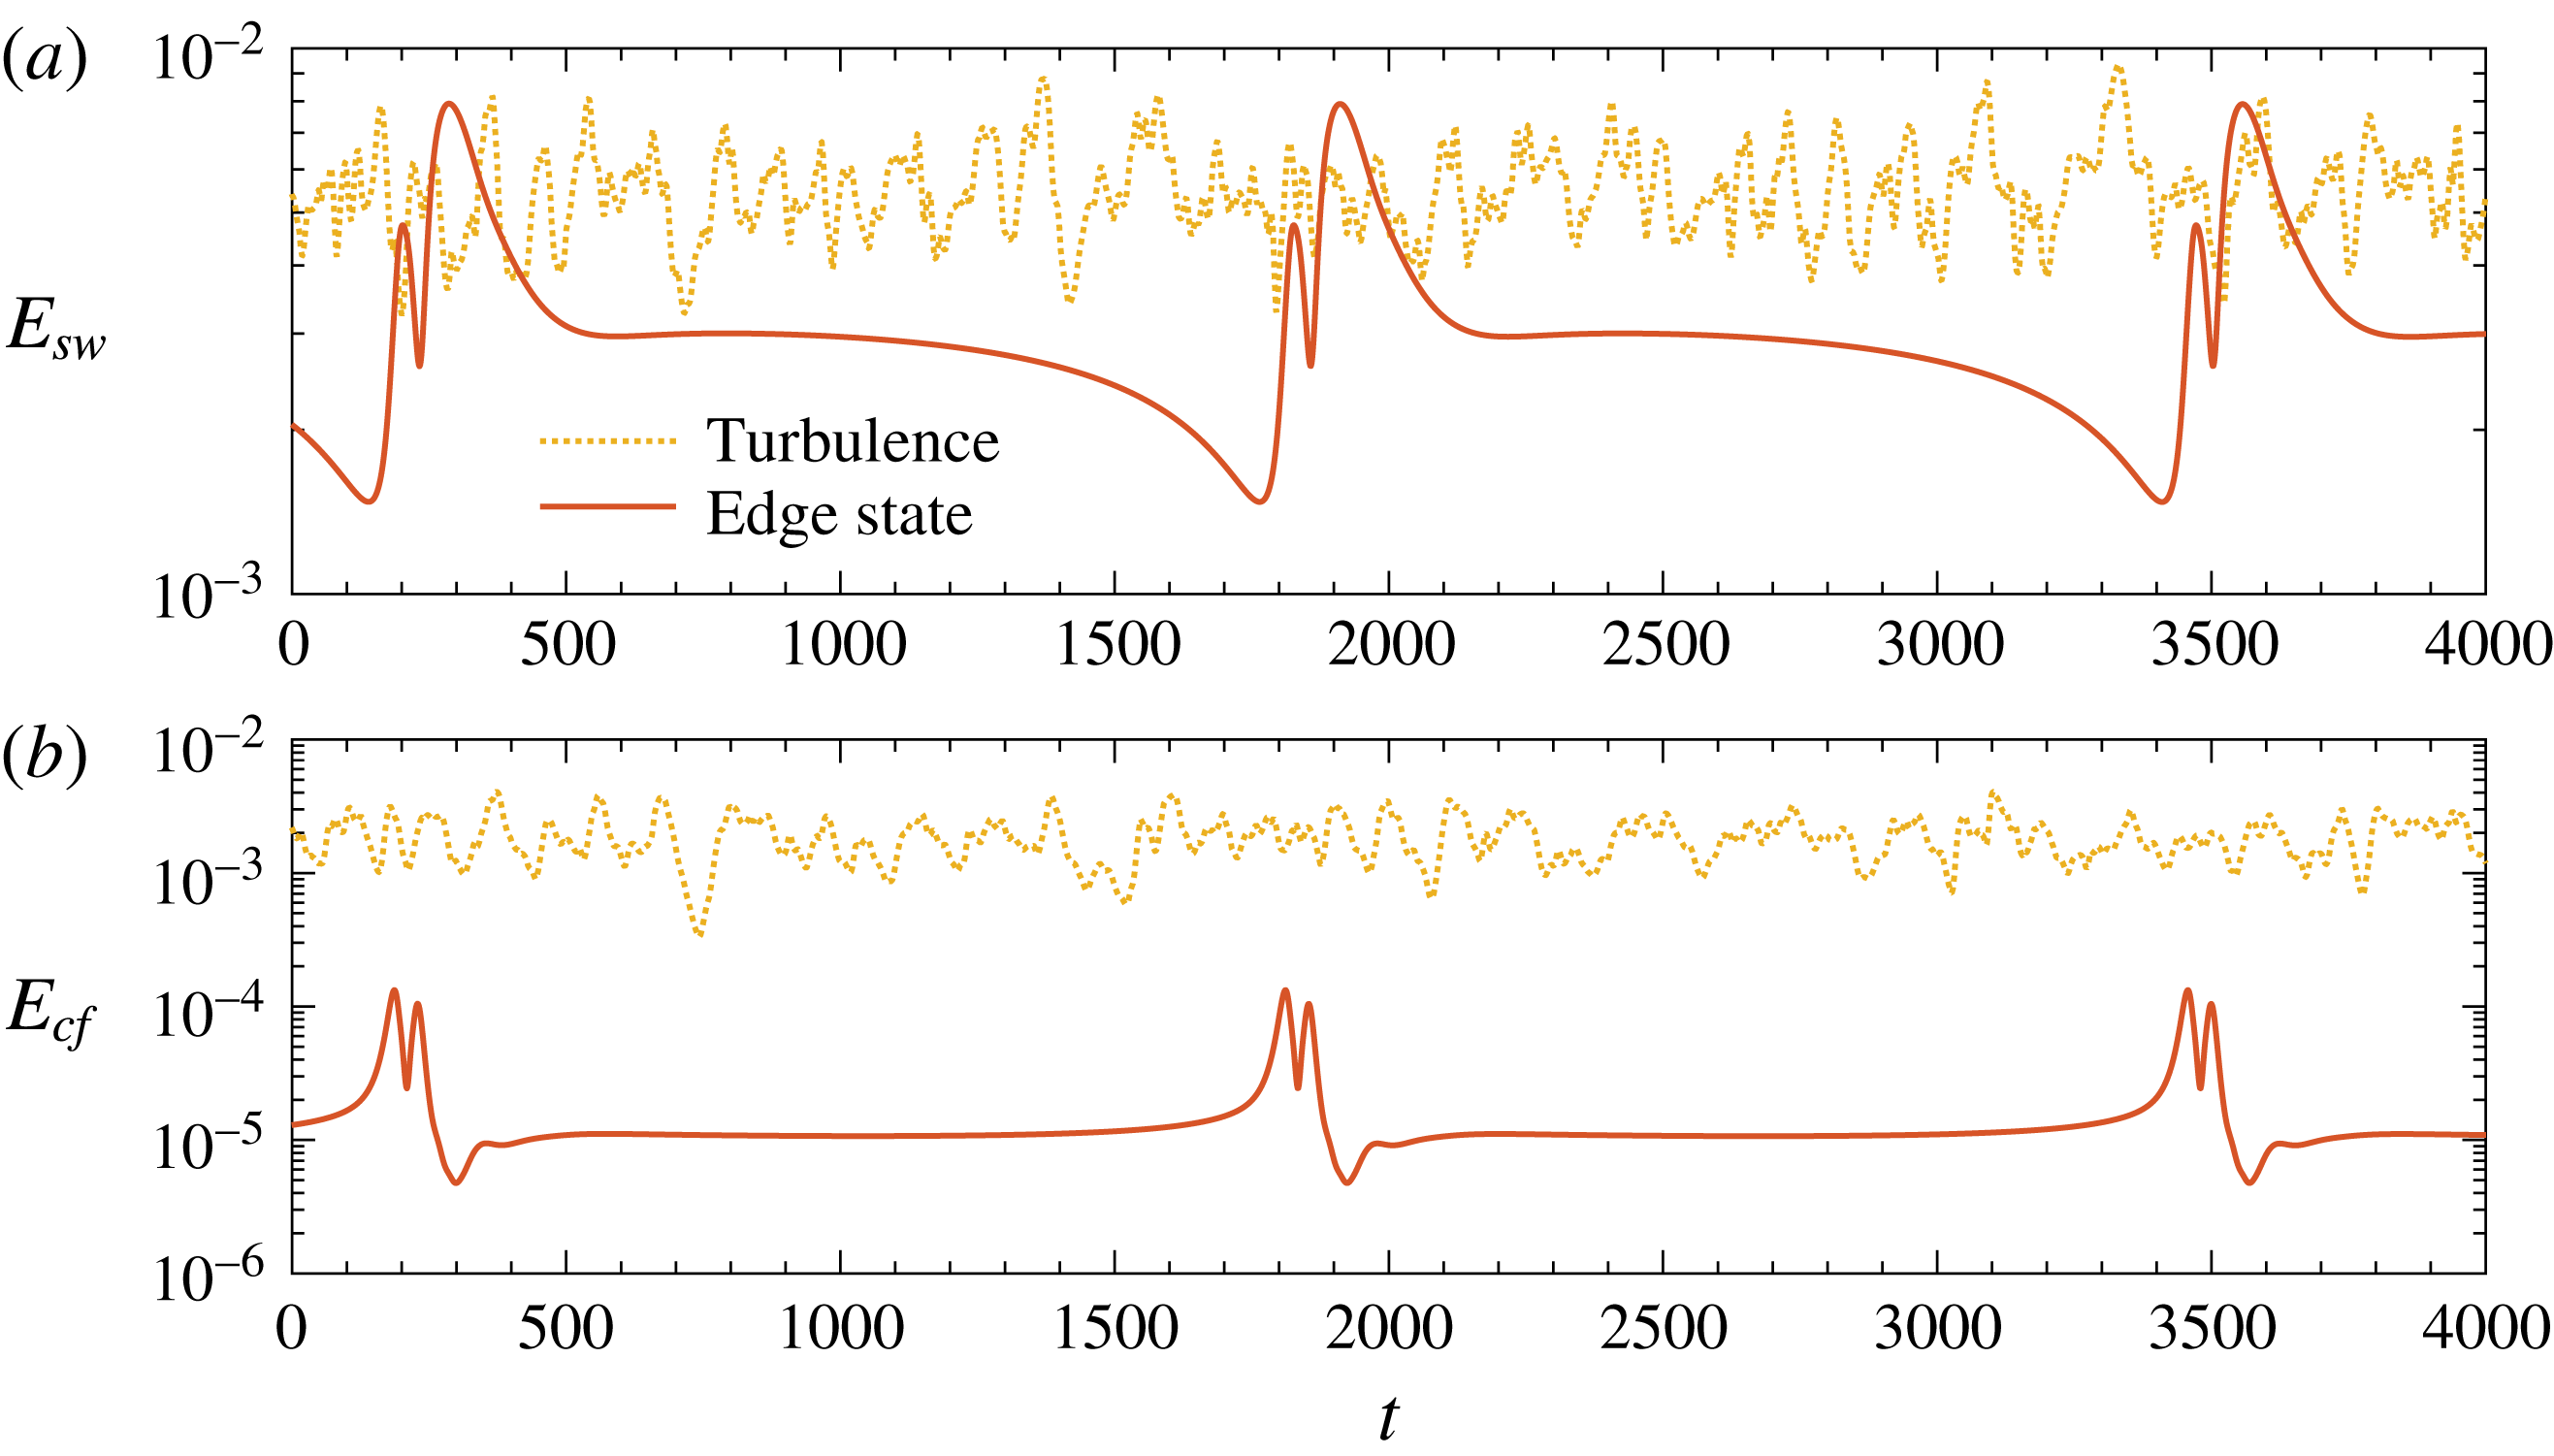
. The time evolution of the streamwise and cross-flow perturbation kinetic energy of the edge state regeneration cycle at
 $Re=2608$
is compared to a turbulent orbit at the same Reynolds number in figure 3. While the intensity of the streamwise component is comparable between the two regimes, the cross-flow energy of the edge state is on average 2 orders of magnitude smaller.
Time evolution at
 $Re=2608$
of (a) the streamwise and cross-flow perturbation kinetic energy,
 $E_{sw}$
and
 $E_{cf}$
, and of (b) the streamwise and wall-normal vorticity,
 $\unicode[STIX]{x1D6FA}_{x}$
and
 $\unicode[STIX]{x1D6FA}_{y}$
;
 $t_{A}$
and
 $t_{B}$
indicate the times at which the highest peaks in
 $E_{cf}$
and
 $E_{sw}$
occur, respectively, and are the same in (a) and (b). At this Reynolds number, the edge state is a relative periodic orbit with period
 $T=1660$
. The definitions of perturbation kinetic energy and vorticity are given in § 2.

Snapshots of the flow field at
 $Re=2608$
at times (a)
 $t_{A}$
and (b)
 $t_{B}$
as defined in figure 1. The edge state is asymmetric and localised in the vertical direction, close to the lower wall, hence only the lower half of the channel is shown. The solid wall is at the bottom and the streamwise flow direction enters the paper in both images. Contours and lines indicate (a) red/blue
 $\unicode[STIX]{x1D714}_{x}=\pm 1$
, green
 $\unicode[STIX]{x1D706}_{2}=-0.1$
and black lines the streamtracers of the in-plane velocity components,
 $v$
and
 $w$
; (b) red/blue
 $u-u_{mean}=\pm 0.2$
and black lines the streamwise velocity profile iso-contours spaced by
 $\unicode[STIX]{x0394}u=0.11$
.

Time evolution of the streamwise (a) and cross-flow (b) perturbation kinetic energy of the edge state regeneration cycle and of a turbulent trajectory at
 $Re=2608$
. The definition of
 $E_{sw}$
and
 $E_{cf}$
is given in § 2. The energy of the turbulent flow is calculated using the root-mean-square components of the velocity.

Transitional flows have been repeatedly shown to approach edge states before crossing the manifold and eventually becoming turbulent (Duguet et al. Reference Duguet, Schlatter and Henningson2009; Schneider & Eckhardt Reference Schneider and Eckhardt2009; Schneider, Marinc & Eckhardt Reference Schneider, Marinc and Eckhardt2010b ; Avila et al. Reference Avila, Mellibovsky, Roland and Hof2013; Khapko et al. Reference Khapko, Kreilos, Schlatter, Duguet, Eckhardt and Henningson2016), and on the path to relaminarisation from a turbulent state (De Lozar et al. Reference De Lozar, Mellibovsky, Avila and Hof2012; Park & Graham Reference Park and Graham2015). However, the latter scenario does not constitute the only possible path for relaminarisation (Chantry & Schneider Reference Chantry and Schneider2014). Edge states can be regarded as critical nuclei for transition (Schneider et al. Reference Schneider, Marinc and Eckhardt2010b ) and, being low-branch states, are naturally associated with a threshold in perturbation amplitude (Schneider et al. Reference Schneider, Gibson, Lagha, De Lillo and Eckhardt2008). This conceptual framework was recently used to model the spot nucleation in transitional boundary layers (Kreilos et al. Reference Kreilos, Khapko, Schlatter, Duguet, Henningson and Eckhardt2016). Note that, despite their low energy, edge states do not constitute the minimal possible perturbation that triggers transition, also referred to as the minimal seed, which is identified in the state space by the shortest distance between the laminar attractor and the manifold (Pringle & Kerswell Reference Pringle and Kerswell2010). Nonetheless, edge states provide relevant indications on the transition process for perturbations that evolve in their proximity in the state space. These are not limited to small finite amplitude perturbations carefully generated within a boundary layer, but additionally include a more general scenario of boundary layer receptivity to random noise and spot nucleation (Khapko et al. Reference Khapko, Kreilos, Schlatter, Duguet, Eckhardt and Henningson2016).
In this paper, we present theoretical arguments stemming from a fully nonlinear framework that explain the known modified threshold for transition to turbulence for fluid flows with temperature-dependent viscosity. As opposed to most previous literature concerned with linearised flow models, we achieve our goal by investigating the modulating effect of an imposed temperature-dependent viscosity profile on edge states, specifically on the perturbation kinetic energy level of their flow structures and on the recurrence of the self-sustained cycle. Our study follows a similar spirit as Roland, Plaut & Nouar (Reference Roland, Plaut and Nouar2010), who showed that in shear-thinning fluids the critical Reynolds number for the appearance of nonlinear travelling wave solutions in a pipe is substantially increased, therefore indicating a stabilisation of the flow. The relevance of our results is in a transition scenario where edge states act as mediators, and hence excludes strong perturbations to the flow which possibly bypass their role. There, a more relevant question is how variable viscosity affects the position and characteristics of the turbulent saddle, which goes beyond the scope of this paper. The flow configuration considered is the plane channel with a frozen wall-normal symmetric temperature distribution in the absence of gravity, which allows us to isolate the effect of viscosity on the flow. The validity of the frozen temperature profile for the particular flow case under study is substantiated with a priori and a posteriori arguments.
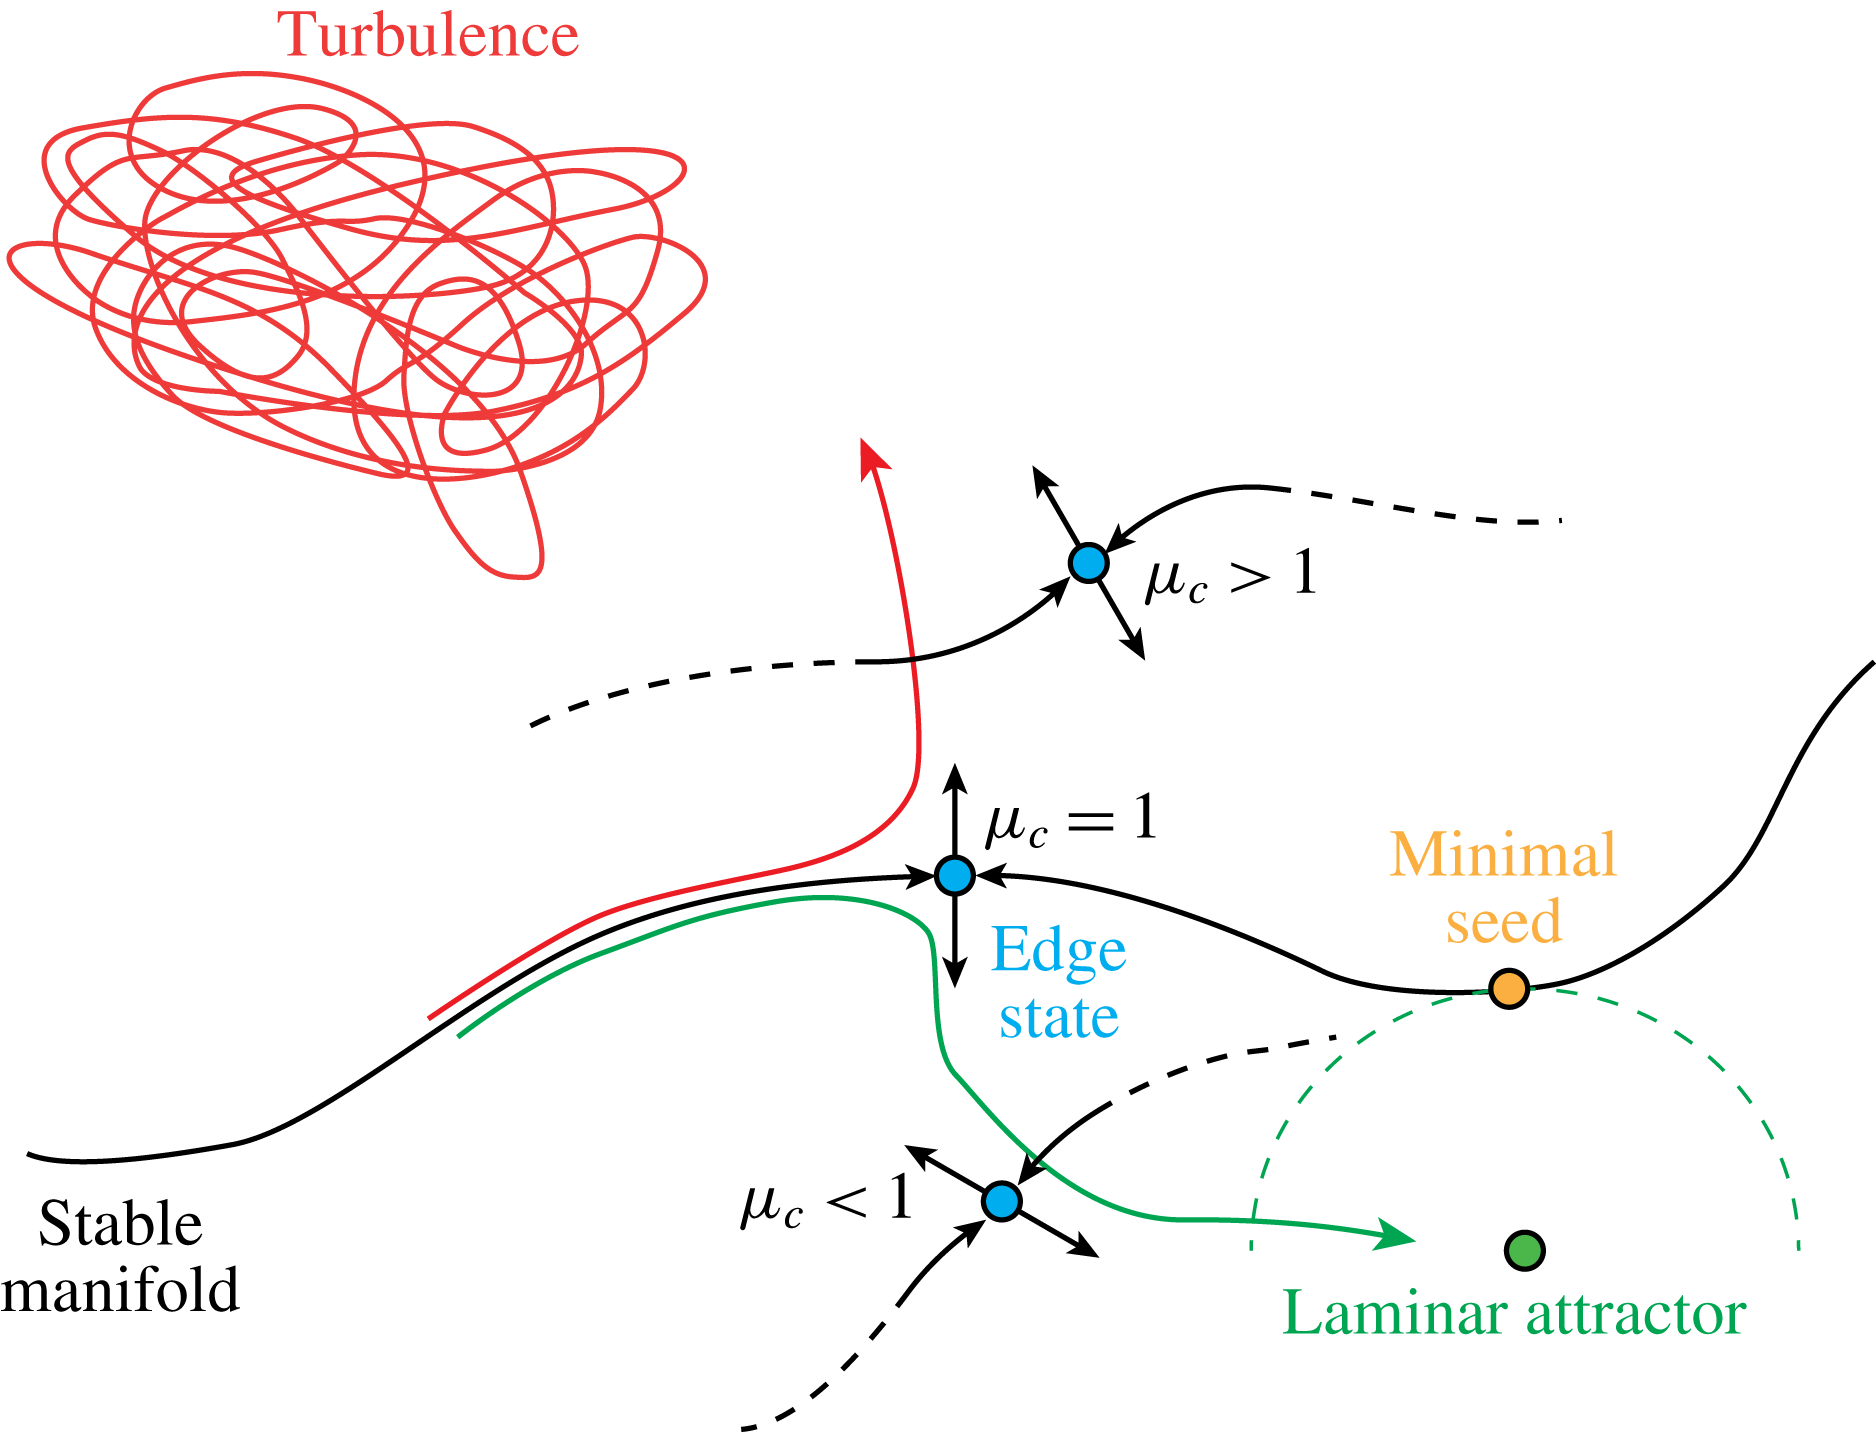
Sketch of the state space for a channel flow with unitary non-dimensional reference viscosity at the walls and viscosity at the centreline indicated by
 $\unicode[STIX]{x1D707}_{c}$
. The variation of viscosity is monotonic towards the centreline according to the constitutive relation given in § 2. The red and green arrows denote two flow trajectories that become turbulent or relaminarise, respectively. The present results indicate that the position of the edge state shifts away from the laminar attractor, if
 $\unicode[STIX]{x1D707}_{c}>1$
, or towards it, if
 $\unicode[STIX]{x1D707}_{c}>1$
. As a consequence, the stable manifold in the vicinity of the edge state is modulated accordingly. This study does not provide a characterisation of the effect of viscosity on the manifold farther away from the edge state (dashed black line). The turbulent saddle is also affected by viscosity.

We anticipate the results discussed later by presenting a sketch of the modified state space in figure 4. Smaller viscosity near the walls and larger viscosity at the centre of the channel,
 $\unicode[STIX]{x1D707}_{c}>1$
in the figure, result in a shift of the position of the edge state away from the laminar attractor and, as a consequence, in a modulation of the stable manifold in its vicinity. There, perturbations need to reach larger amplitudes to overcome the local threshold for transition. The opposite results if viscosity is larger at the walls and smaller at the centreline,
 $\unicode[STIX]{x1D707}_{c}<1$
. The described effect is consistent with the behaviour observed in experiments with wall heating or cooling, although it should be noted that the transition scenario taking place in experiments might differ from the one discussed here depending on the specific perturbations applied.
The structure of the paper is as follows. Section 2 describes the set-up of the problem and the numerical method used in this study. The main features of edge state solutions in minimal unit channels with constant viscosity are introduced in § 3. The effect of viscosity is discussed in § 4. Conclusions are presented in § 5.
2 Flow configuration and numerical set-up
2.1 Navier–Stokes equations for a flow with non-uniform mean viscosity
The configuration studied in this paper is the incompressible flow of a variable viscosity fluid with constant mass flux in a plane channel, for which the dynamics is governed by the Navier–Stokes equations. In non-dimensional form they read
 $$\begin{eqnarray}\displaystyle & \displaystyle \frac{\unicode[STIX]{x2202}u_{i}}{\unicode[STIX]{x2202}x_{i}}=0, & \displaystyle\end{eqnarray}$$
 $$\begin{eqnarray}\displaystyle & \displaystyle \frac{\unicode[STIX]{x2202}u_{i}}{\unicode[STIX]{x2202}t}+u_{j}\frac{\unicode[STIX]{x2202}u_{i}}{\unicode[STIX]{x2202}x_{j}}=-\frac{\unicode[STIX]{x2202}p}{\unicode[STIX]{x2202}x_{i}}+\frac{1}{\overline{Re}}\frac{\unicode[STIX]{x2202}}{\unicode[STIX]{x2202}x_{j}}(2\unicode[STIX]{x1D707}\unicode[STIX]{x1D61A}_{ij}). & \displaystyle\end{eqnarray}$$
In the above expressions
 $x_{i}$
indicates the spatial coordinates (
 $x$
streamwise;
 $y$
wall normal;
 $z$
spanwise),
 $u_{i}$
is the
 $i$
th component of the velocity (
 $u$
streamwise;
 $v$
wall normal;
 $w$
spanwise),
 $p$
is the pressure and
 $\unicode[STIX]{x1D61A}_{ij}=(1/2)(\unicode[STIX]{x2202}u_{i}/\unicode[STIX]{x2202}x_{j}+\unicode[STIX]{x2202}u_{j}/\unicode[STIX]{x2202}x_{i})$
is the strain rate tensor. The non-dimensional dynamic viscosity of the fluid is
 $\unicode[STIX]{x1D707}=\unicode[STIX]{x1D707}_{w}+\unicode[STIX]{x1D707}_{d}$
, with
 $\unicode[STIX]{x1D707}_{d}=\unicode[STIX]{x1D707}_{d}(y)$
indicating the local deviation from the value at the wall,
 $\unicode[STIX]{x1D707}_{w}$
. The Reynolds number is defined as
 $\overline{Re}=\unicode[STIX]{x1D70C}_{w}^{\ast }h\overline{U}_{c}/\unicode[STIX]{x1D707}_{w}^{\ast }$
, with
 $\overline{U}_{c}$
denoting the centreline velocity,
 $h$
the half-channel height and
 $\unicode[STIX]{x1D70C}_{w}^{\ast }$
and
 $\unicode[STIX]{x1D707}_{w}^{\ast }$
the dimensional density and viscosity reference values, taken as the ones attained at the wall. Due to the choice of the reference viscosity scale,
 $\unicode[STIX]{x1D707}_{w}=1$
. The constitutive relation for the temperature-dependent viscosity mimics that of a liquid, namely
 $$\begin{eqnarray}\unicode[STIX]{x1D707}(y)=\frac{1}{\unicode[STIX]{x1D6E9}(y)}.\end{eqnarray}$$
We impose a symmetric temperature profile that qualitatively resembles the one resulting from a volumetric or wall heating/cooling of a laminar flow with constant thermal conductivity
 $$\begin{eqnarray}\unicode[STIX]{x1D6E9}(y)=1+(\unicode[STIX]{x1D6E9}_{c}-1)(1-y^{2}),\end{eqnarray}$$
with
 $\unicode[STIX]{x1D6E9}_{c}$
the centreline value and
 $y=[-1,1]$
. Temperature is kept frozen in all simulations, this corresponds to assuming that the interaction between the fluctuating velocity field and the temperature fluctuations is negligible. This assumption is discussed in more detail in § 2.2.
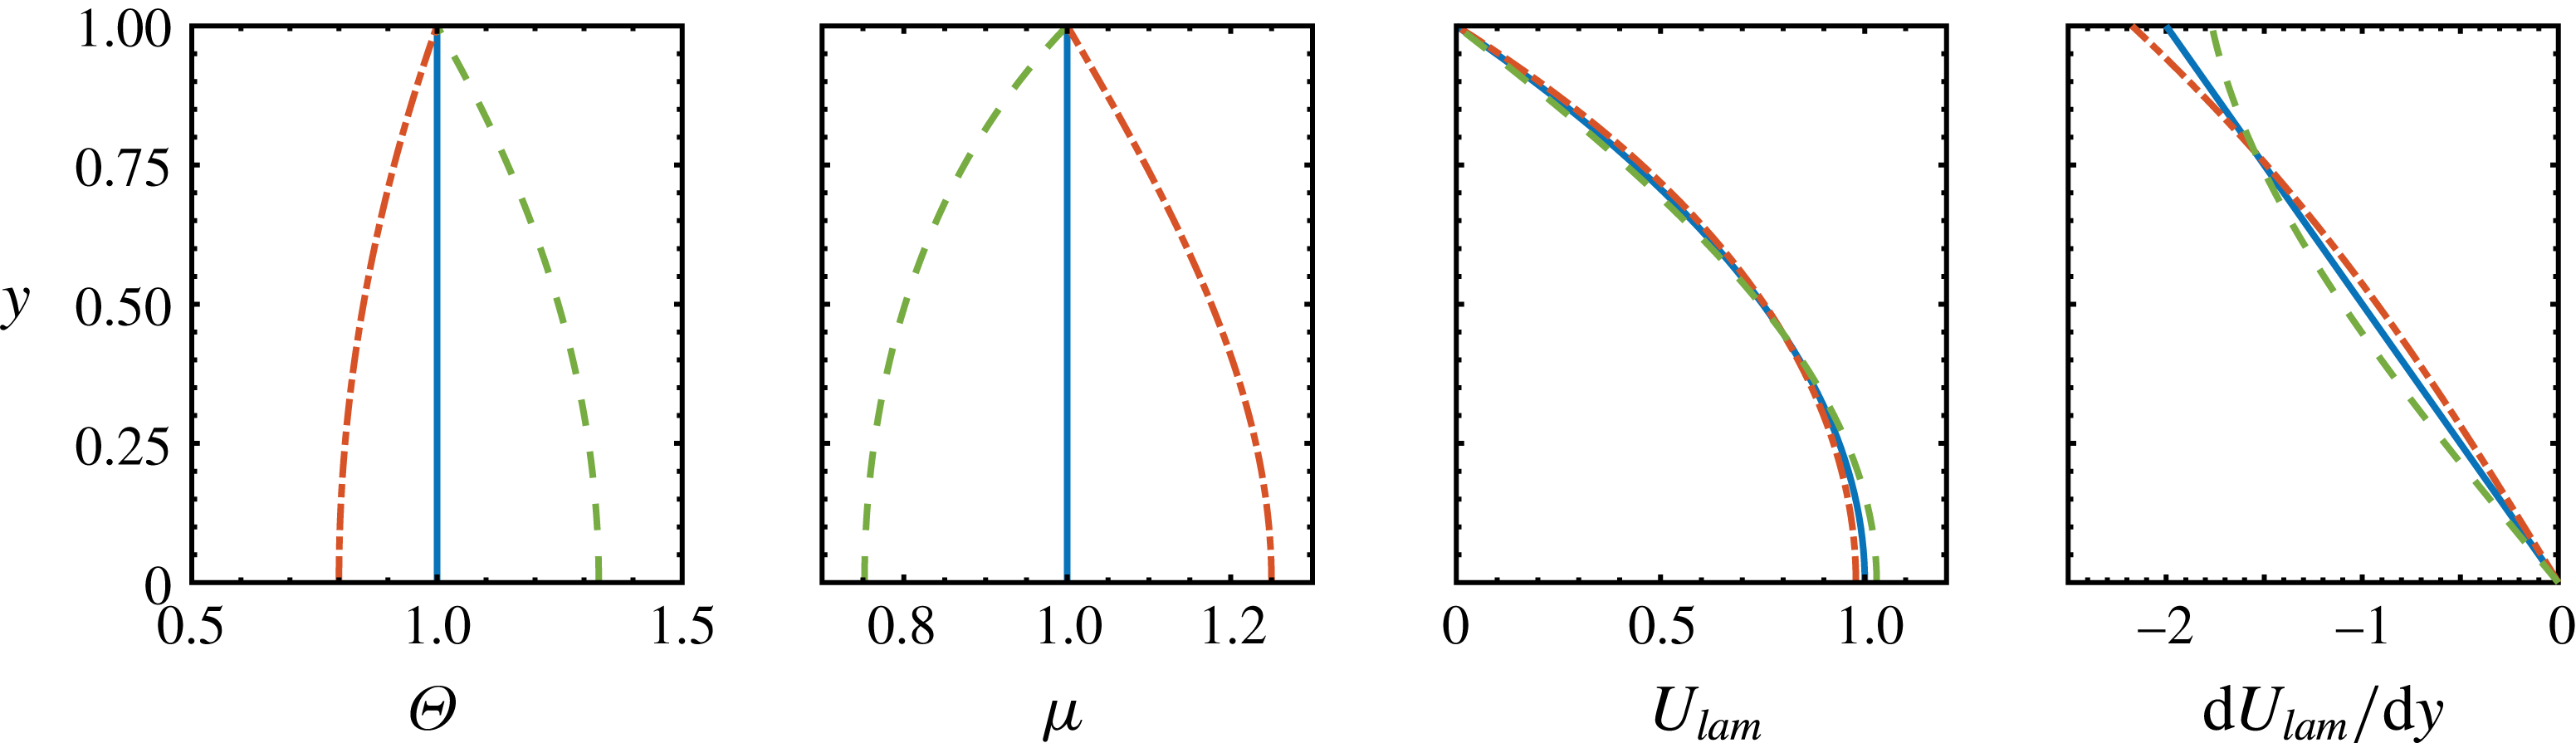
Exemplary temperature distributions and resulting viscosity, velocity and velocity gradient profiles. Due to symmetry (only
 $\text{d}U_{lam}/\text{d}y$
is anti-symmetric), only the upper half-channel is shown. The wall is located at
 $y=1$
and the centreline at
 $y=0$
. Lines correspond to
 $\unicode[STIX]{x1D707}=\text{const.}$
, or
 $\unicode[STIX]{x1D707}_{c}=1$
(solid);
 $\unicode[STIX]{x1D707}_{c}=0.75$
(dash);
 $\unicode[STIX]{x1D707}_{c}=1.25$
(dash-dot). Line patterns are consistent in the four panels.

Equation (2.3) allows us to integrate analytically the streamwise momentum equation and get the following non-dimensional laminar velocity
 $$\begin{eqnarray}U_{lam}(y)=-\frac{10}{4\unicode[STIX]{x1D6E9}_{c}+6}\left(\unicode[STIX]{x1D6E9}_{c}y^{2}+\frac{1-\unicode[STIX]{x1D6E9}_{c}}{2}y^{4}-\frac{1+\unicode[STIX]{x1D6E9}_{c}}{2}\right),\end{eqnarray}$$
which was made non-dimensional using the centreline velocity at constant temperature
 $U_{c}=-(1/2)(\text{d}P/\text{d}x)h^{2}$
and where the factor
 $(4\unicode[STIX]{x1D6E9}_{c}+6)/15$
was used to transform bulk to centreline units. Figure 5 shows some exemplary temperature, viscosity, laminar velocity and velocity gradient profiles. The latter is denoted as
 $\text{d}U_{lam}/\text{d}y$
. Increasing viscosity towards the centreline (dash-dot lines) results in a velocity profile that is fuller and linearly more stable as compared to the one of a fluid with constant viscosity. This is confirmed by a larger (in magnitude) velocity gradient near the walls and a smaller gradient in the central part of the channel. The opposite effect results from decreasing viscosity towards the centreline (dash lines). Note that the changes in viscosity reported in the figure and discussed throughout the paper can be achieved with moderate heating or cooling in practical applications. For example, an increase or decrease of viscosity of water by
 $\pm 25\,\%$
from a reference condition of
 $\unicode[STIX]{x1D6E9}_{ref}=15\,^{\circ }\text{C}$
is obtained with a decrease or increase of temperature by
 $\unicode[STIX]{x0394}\unicode[STIX]{x1D6E9}=-8.5\,^{\circ }\text{C}$
or
 $\unicode[STIX]{x0394}\unicode[STIX]{x1D6E9}=12^{\circ }\,\text{C}$
, respectively. Temperature gradients can be significantly larger in real life problems, and so can the variations in viscosity.
In the proceeding of the paper, flow cases with different viscosity distributions, which will be later identified by the centreline value
 $\unicode[STIX]{x1D707}_{c}$
only, will be compared at constant Reynolds number based on (i) wall viscosity (
 $\overline{Re}$
); (ii) average viscosity across the channel height
 $$\begin{eqnarray}Re=\frac{2}{\displaystyle \int _{-1}^{1}\unicode[STIX]{x1D707}\,\text{d}y}\frac{\unicode[STIX]{x1D70C}_{w}^{\ast }h\overline{U}_{c}}{\unicode[STIX]{x1D707}_{w}^{\ast }}=\frac{1}{\unicode[STIX]{x1D707}_{av}}\overline{Re}.\end{eqnarray}$$
For a constant viscosity flow
 $\overline{Re}=Re$
and
 $\overline{U_{c}}=U_{c}$
. Definition (2.6) allows us to filter out the bulk effect of having locally larger or smaller viscosity with respect to the reference value at the walls (Wall & Wilson Reference Wall and Wilson1996; Sameen & Govindarajan Reference Sameen and Govindarajan2007). On the other hand, in the context of shear-thinning fluids, it has been shown by Nouar et al. (Reference Nouar, Bottaro and Brancher2007) that the correct viscosity scale for the definition of the Reynolds number is the one at the wall. Choosing a different reference value might yield qualitatively wrong conclusions on the effect of viscosity on the stability of the flow. For this reason, we will carry out comparisons using both
 $\overline{Re}$
and
 $Re$
in order to confirm that our discussion does not depend on the specific choice of the reference viscosity. In the following, all quantities are made non-dimensional using the semi-channel height,
 $h$
, and the centreline velocity of the flow at constant viscosity,
 $U_{c}$
. The ratio between the centreline velocities for variable and constant viscosity cases when compared at constant
 $Re$
is given by
 $\overline{U}_{c}/U_{c}=\overline{Re}/Re=\int \unicode[STIX]{x1D707}\,\text{d}y/2$
. We introduce the following definitions of volume averaged perturbation kinetic energy (PKE) based on the streamwise and cross-flow components of the velocity field,
 $E_{sw}$
and
 $E_{cf}$
, that will be used in the discussion of the results
 $$\begin{eqnarray}\displaystyle & \displaystyle E_{sw}=\frac{1}{2}\frac{1}{L_{x}L_{z}}\int _{0}^{L_{z}}\int _{0}^{L_{x}}\int _{-1}^{1}\left(u(x,y,z)-u_{mean}(y)\right)^{2}\text{d}y\,\text{d}x\,\text{d}z, & \displaystyle\end{eqnarray}$$
 $$\begin{eqnarray}\displaystyle & \displaystyle E_{cf}=\frac{1}{2}\frac{1}{L_{x}L_{z}}\int _{0}^{L_{z}}\int _{0}^{L_{x}}\int _{-1}^{1}v^{2}(x,y,z)+w^{2}(x,y,z)\,\text{d}y\,\text{d}x\,\text{d}z. & \displaystyle\end{eqnarray}$$
The total perturbation energy is
 $E_{tot}=E_{sw}+E_{cf}$
. Additionally, we define volume averaged vorticity
 $$\begin{eqnarray}\unicode[STIX]{x1D6FA}_{i}=\frac{1}{2}\frac{1}{L_{x}L_{z}}\int _{0}^{L_{z}}\int _{0}^{L_{x}}\int _{-1}^{1}|\unicode[STIX]{x1D714}_{i}|\,\text{d}y\,\text{d}x\,\text{d}z.\end{eqnarray}$$
2.2 Validity of the frozen temperature profile assumption
We assess the validity of assuming a frozen temperature profile by means of a priori and a posteriori arguments. This assumption corresponds to entirely neglecting the interaction between the fluctuating velocity and temperature, hence viscosity, fields. Depending on the flow case under consideration, this can be a crude approximation that has been shown to yield wrong conclusions in the context of the linear stability of shear-thinning fluids (Nouar et al. Reference Nouar, Bottaro and Brancher2007).
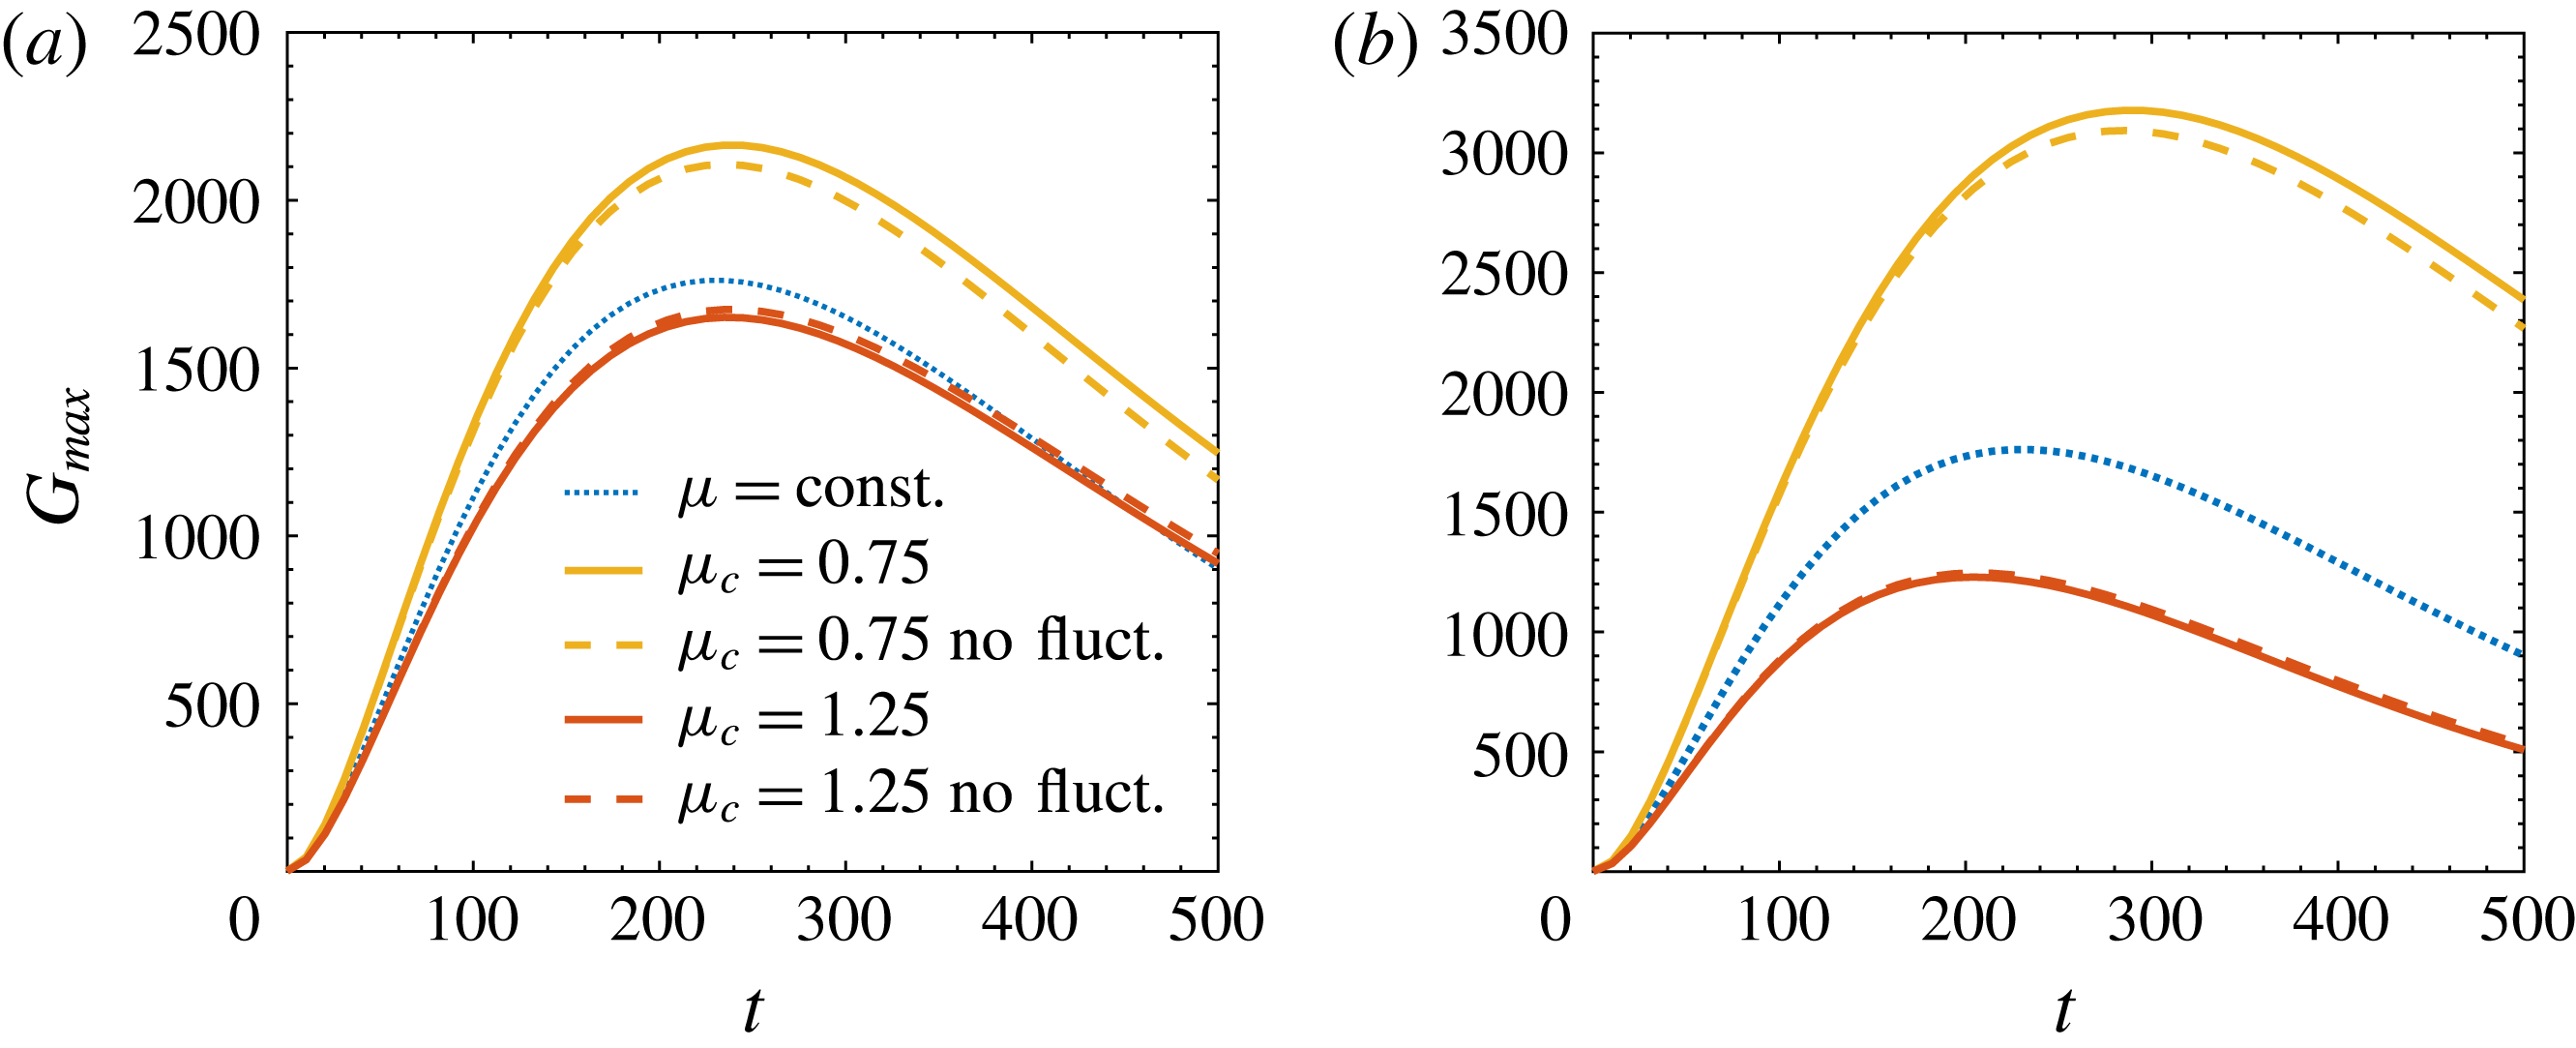
Time evolution of transient energy growth function
 $G_{max}$
for
 $Pr=7$
,
 $\unicode[STIX]{x1D6FD}=2$
,
 $Re=3000$
(a) and
 $\overline{Re}=3000$
(b).

The a priori check is performed using the linearised Navier–Stokes and energy equations for a fluid with temperature dependent viscosity. For the sake of brevity, the equations are not reported here and the reader is referred to Wall & Wilson (Reference Wall and Wilson1996), Sameen & Govindarajan (Reference Sameen and Govindarajan2007) for details. Similarly to Nouar et al. (Reference Nouar, Bottaro and Brancher2007), we have calculated the energy growth function,
 $G_{max}$
, which represents the maximum possible linear amplification in time of small initial perturbations (Reddy & Henningson Reference Reddy and Henningson1993), and compared the results obtained including and neglecting the temperature fluctuation terms in the momentum equations. The laminar velocity and temperature profiles used for the linearisation are those of equations (2.5) and (2.4). Figure 6 displays the calculated growth functions for Reynolds
 $Re=3000$
and
 $\overline{Re}=3000$
, Prandtl number
 $Pr=\unicode[STIX]{x1D707}/\unicode[STIX]{x1D70C}\unicode[STIX]{x1D705}=7$
(water), where
 $\unicode[STIX]{x1D705}$
is the thermal diffusivity of the fluid. The perturbation is assumed to be streamwise independent and to have a spanwise wavenumber
 $\unicode[STIX]{x1D6FD}=2$
. Three viscosity profiles are considered, namely
 $\unicode[STIX]{x1D707}=\text{const.}$
,
 $\unicode[STIX]{x1D707}_{c}=0.75$
and
 $\unicode[STIX]{x1D707}_{c}=1.25$
. Differently to what was found for shear-thinning fluids, results for a fluid with temperature-dependent viscosity confirm that the error committed by excluding the temperature fluctuation terms in the momentum equations is negligible.
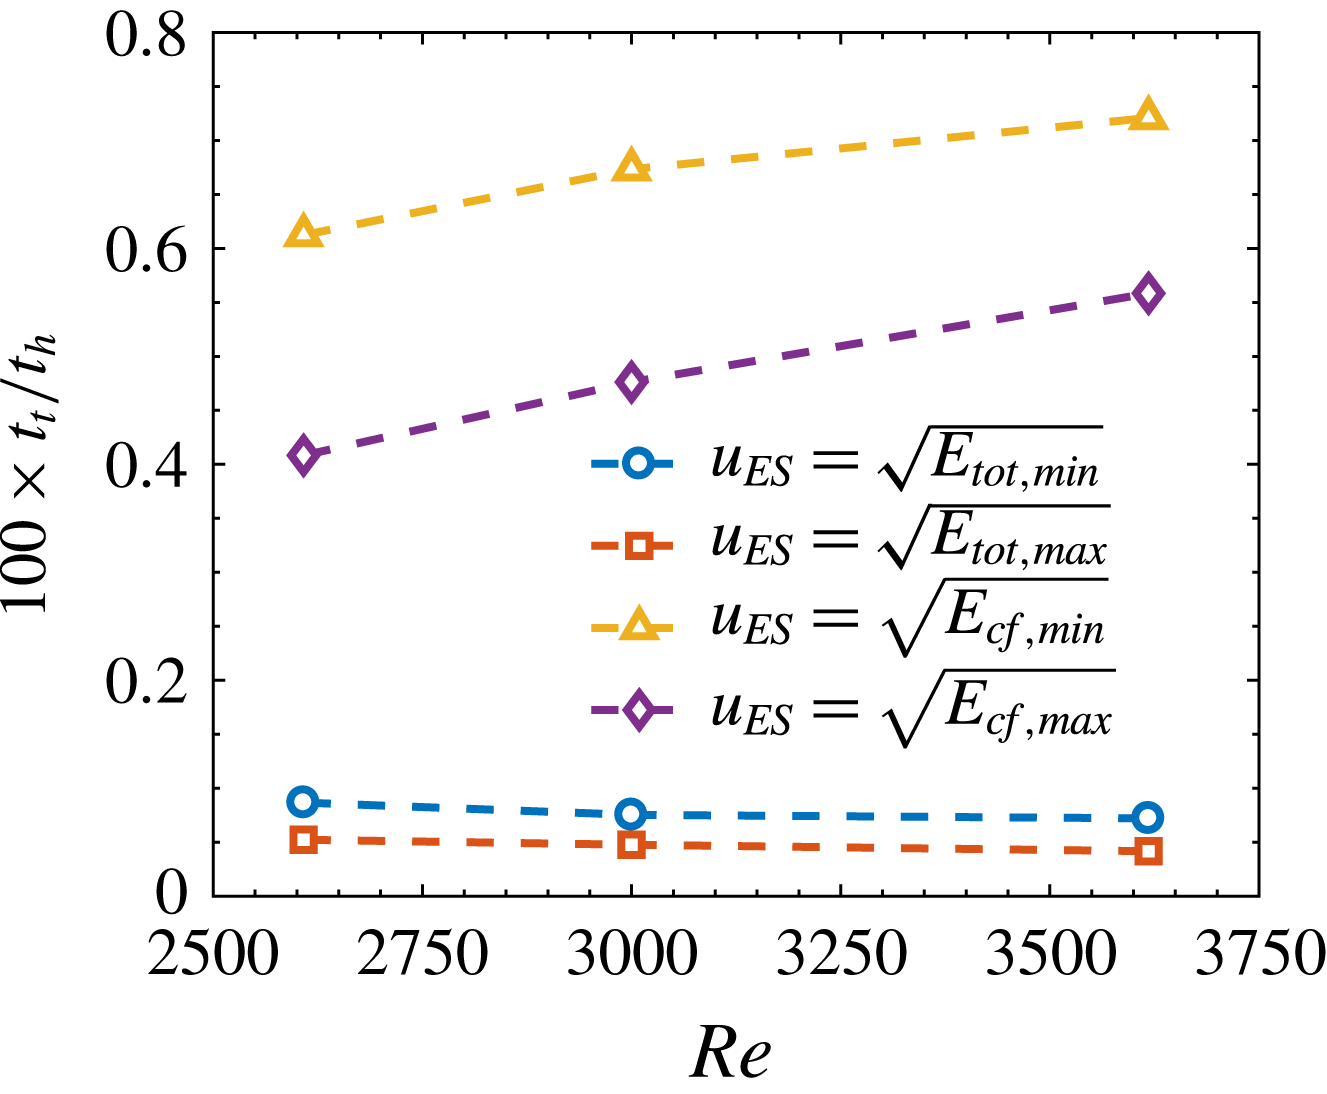
Ratio of time scales between the ‘turbulent mixing’,
 $t_{t}$
, and of heat diffusion,
 $t_{h}$
. The values of the energy are taken from figure 15 and
 $Pr=7$
.

The a posteriori verification of the validity of the assumption on the temperature profile is based on the estimation of the time scales of the ‘turbulent mixing’,
 $t_{t}$
, and of heat diffusion,
 $t_{h}$
, namely
 $$\begin{eqnarray}t_{t}=\frac{h}{u_{ES}^{\ast }},\quad t_{h}=\frac{h^{2}}{\unicode[STIX]{x1D705}},\quad \frac{t_{t}}{t_{h}}=\frac{1}{u_{ES}\,Pr\,Re},\end{eqnarray}$$
with
 $u_{ES}^{\ast }$
and
 $u_{ES}$
a characteristic velocity scale of the edge state fluctuating field in dimensional and non-dimensional form, respectively, and
 $Pr=7$
. The ratio of time scales for three Reynolds numbers,
 $Re=2608,3000,3618$
, is shown in figure 7. Four reference velocity scales are considered. They are calculated as the square-root of the maximum and minimum values of the kinetic energy over one period of the edge state. The used values of
 $E_{tot}$
and
 $E_{cf}$
are those reported in § 4, figure 15. Results show a prominent separation of the time scales associated with the fluid dynamic mixing and the diffusion of heat, which supports the assumption that changes in the temperature profile are slow and cannot be seen by the fluctuating velocity field.
As a final note on the strength and role of viscosity fluctuations on the velocity field, we refer to recent studies of heat transfer in turbulent channel flows in the low Mach number limit with strong mean property variations (viscosity and density). It has been found by Patel et al. (Reference Patel, Peeters, Boersma and Pecnik2015), Patel, Boersma & Pecnik (Reference Patel, Boersma and Pecnik2016) that the turbulent viscosity fluctuations are less than
 $10\,\%$
of the mean values, even when the variation of the mean viscosity reaches a factor 2, and that the largest effect on turbulent structures and statistics is due to the mean gradients.
2.3 Discretisation and edge state identification
All the simulations are performed using the spectral code SIMSON (Chevalier et al.
Reference Chevalier, Schlatter, Lundbladh and Henningson2007) on a nearly minimal box sized
 $\unicode[STIX]{x03C0}\times 2\times 0.4\unicode[STIX]{x03C0}$
. The flow is driven by an adaptive pressure gradient that ensures a constant laminar bulk Reynolds number. The velocity components are expanded in
 $N_{x}$
and
 $N_{z}$
Fourier modes along the horizontal directions and in
 $N_{y}$
Chebyshev polynomials in the wall-normal direction. A resolution of
 $N_{x}\times N_{y}\times N_{z}=48\times 97\times 48$
was found sufficient to fully resolve the flow for each Reynolds numbers considered. Dealiasing is performed using the
 $3/2$
rule.
In order to track edge state solutions we apply a standard bisection algorithm (Skufca et al.
Reference Skufca, Yorke and Eckhardt2006) on the amplitude of the initial perturbation velocity field. The flow is evolved in time and the integrated root-mean-square value of the wall-normal velocity,
 $v_{rms}$
, is used to discern whether the flow is laminar or turbulent. The simulation is stopped if
 $v_{rms}$
reaches predefined threshold values, typically set to
 $v_{rms,lam}=2\times 10^{-4}$
and
 $v_{rms,tur}=2.5\times 10^{-2}$
, respectively. The tolerance on the scaling coefficient for the initial perturbation velocity field is set to
 $2\times 10^{-14}$
. In order to remain on the manifold and avoid departures due to numerical errors, the bisection step is repeated at a constant interval
 $\unicode[STIX]{x0394}t=500$
. As a consequence, the relative difference between the energies of the trajectories that relaminarise and become turbulent changes at each restart. We have verified that relative values remain small for all simulations. Typically, at restart
 $\unicode[STIX]{x0394}E_{cf}=(E_{cf,tur}-E_{cf,lam})/E_{cf,lam}=10^{-5}$
; occasional peak values reach
 $\unicode[STIX]{x0394}E_{cf}=10^{-3}$
. For each combination of Reynolds numbers and centreline viscosity the edge state is tracked in time for at least
 $30\,000$
non-dimensional time units, unless earlier convergence to a relative periodic orbit is achieved.
3 Edge states in minimal channels with constant viscosity
We start the discussion of the results by introducing the main features of edge states solutions in minimal boxes for canonical channel flows with constant viscosity. For such flow configuration edge states break the vertical symmetry of the channel and localise close to one of the two walls, while extending in the streamwise and spanwise directions (Xi & Graham Reference Xi and Graham2012; Zammert & Eckhardt Reference Zammert and Eckhardt2014a
). Our main reference in validating the results for
 $\unicode[STIX]{x1D707}_{c}=1$
is Zammert & Eckhardt (Reference Zammert and Eckhardt2014a
), who performed edge tracking on the same box size and in the same range of Reynolds numbers. The typical time evolution of an edge state trajectory is shown in figure 1 in terms of cross-flow and streamwise energy (figure 1
a) and streamwise and wall-normal vorticity (figure 1
b). Bursting events occurring at
 $t=t_{A}$
are responsible for generating quasi-streamwise vortices that produce low and high speed streaks by the lift-up mechanism. The streaks reach a maximum PKE at the subsequent time
 $t=t_{B}$
, when the cross-flow motion has been dissipated. It is possible to look at this two-step process in terms of vorticity. The bursting events correspond to peaks in the volume averaged streamwise vorticity
 $\unicode[STIX]{x1D6FA}_{x}$
, which is a measure of the strength of the quasi-streamwise vortices. The peaks in streaks intensity as measured by
 $E_{sw}$
correspond to peaks in wall-normal vorticity
 $\unicode[STIX]{x1D6FA}_{y}$
, which reduces to the shear
 $\unicode[STIX]{x2202}u/\unicode[STIX]{x2202}z$
when the streaks are streamwise independent. Snapshots of the bursting event at
 $t_{A}$
and of the maximum amplitude streaks at
 $t_{B}$
are displayed in figure 2. The final step that makes the edge state dynamics self-sustained is an instability of the two-dimensional streaky profile of figure 2(b) that results in a new burst of the streaks.
Based on the features discussed in figures 1 and 2, we classify edge state orbits into periodic and aperiodic ones using as measure of the periodicity the time between two consecutive maximum peaks in the cross-flow kinetic energy, which will be indicated as
 $T$
. In the following we will use the terms aperiodic and chaotic interchangeably when discussing the nature of the edge state orbit.
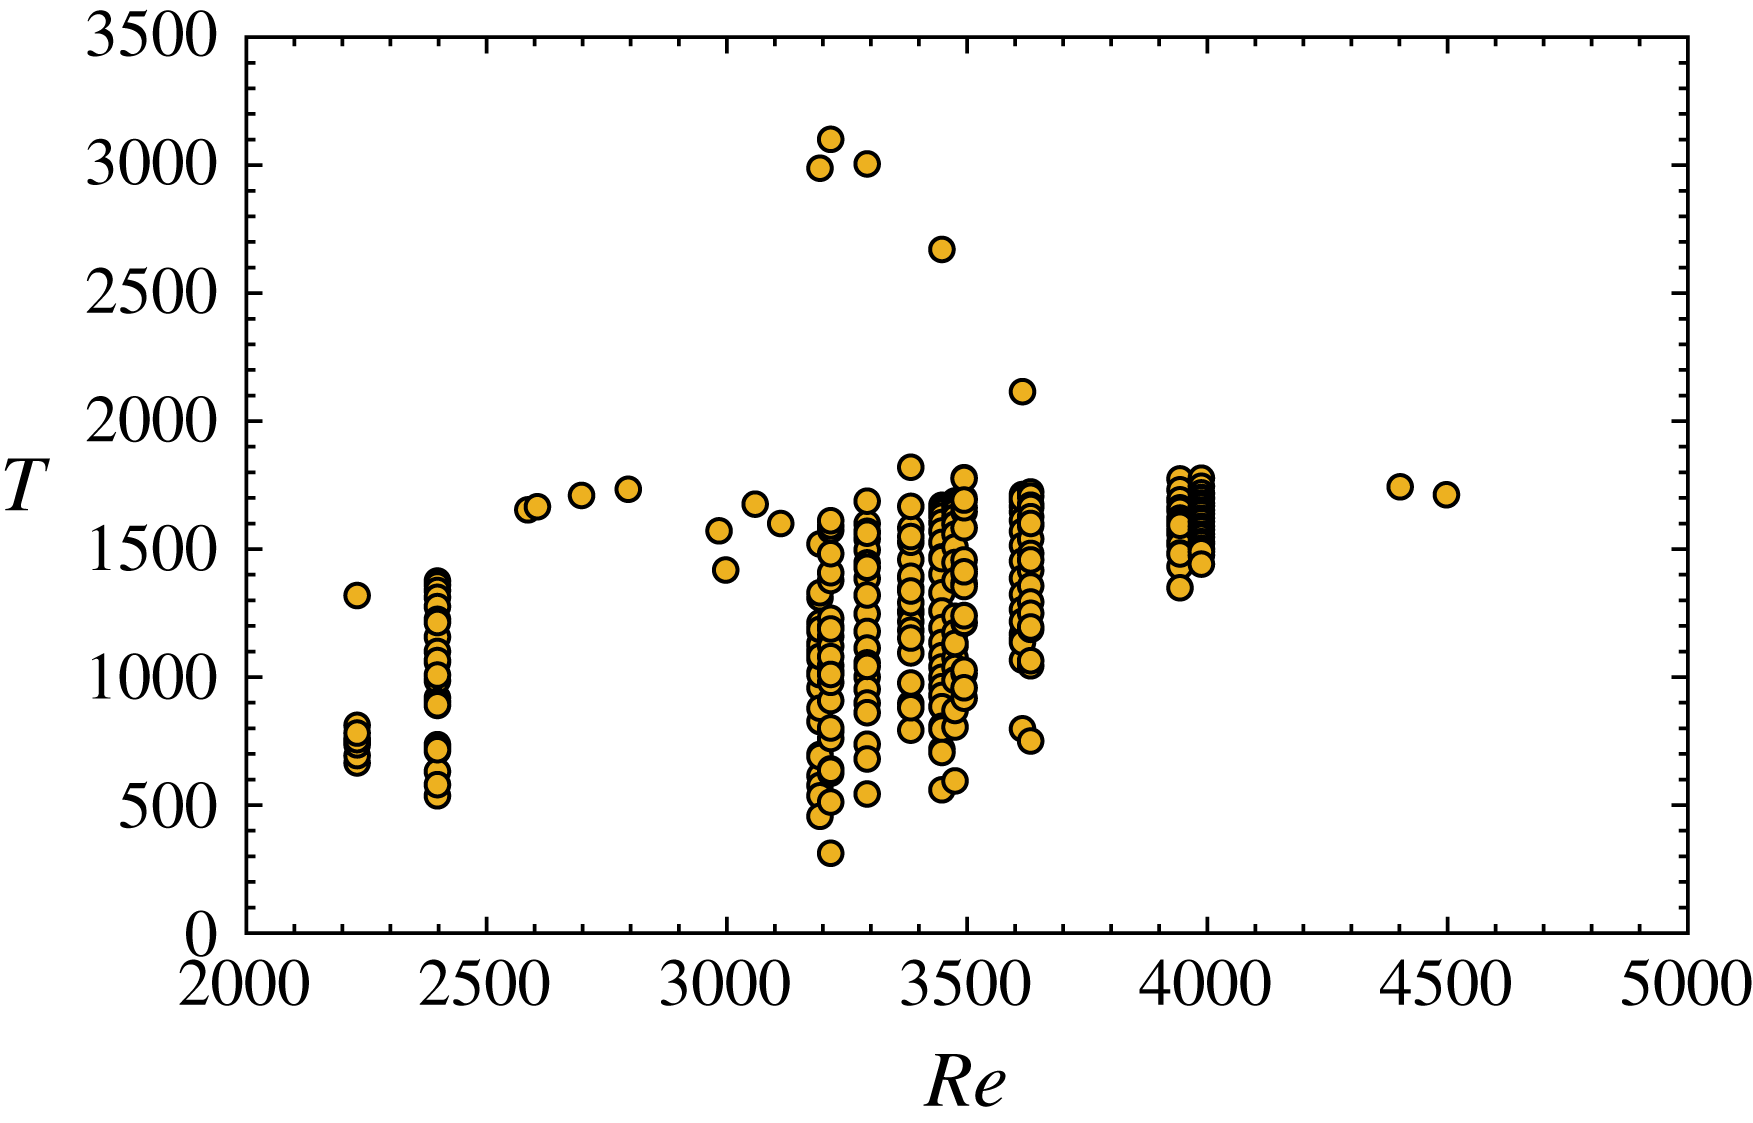
Bifurcation diagram of the inter-burst period
 $T$
as function of
 $Re$
for channel flows with constant viscosity,
 $\unicode[STIX]{x1D707}_{c}=1$
. Multiple symbols at a given
 $Re$
indicate that the state is aperiodic.

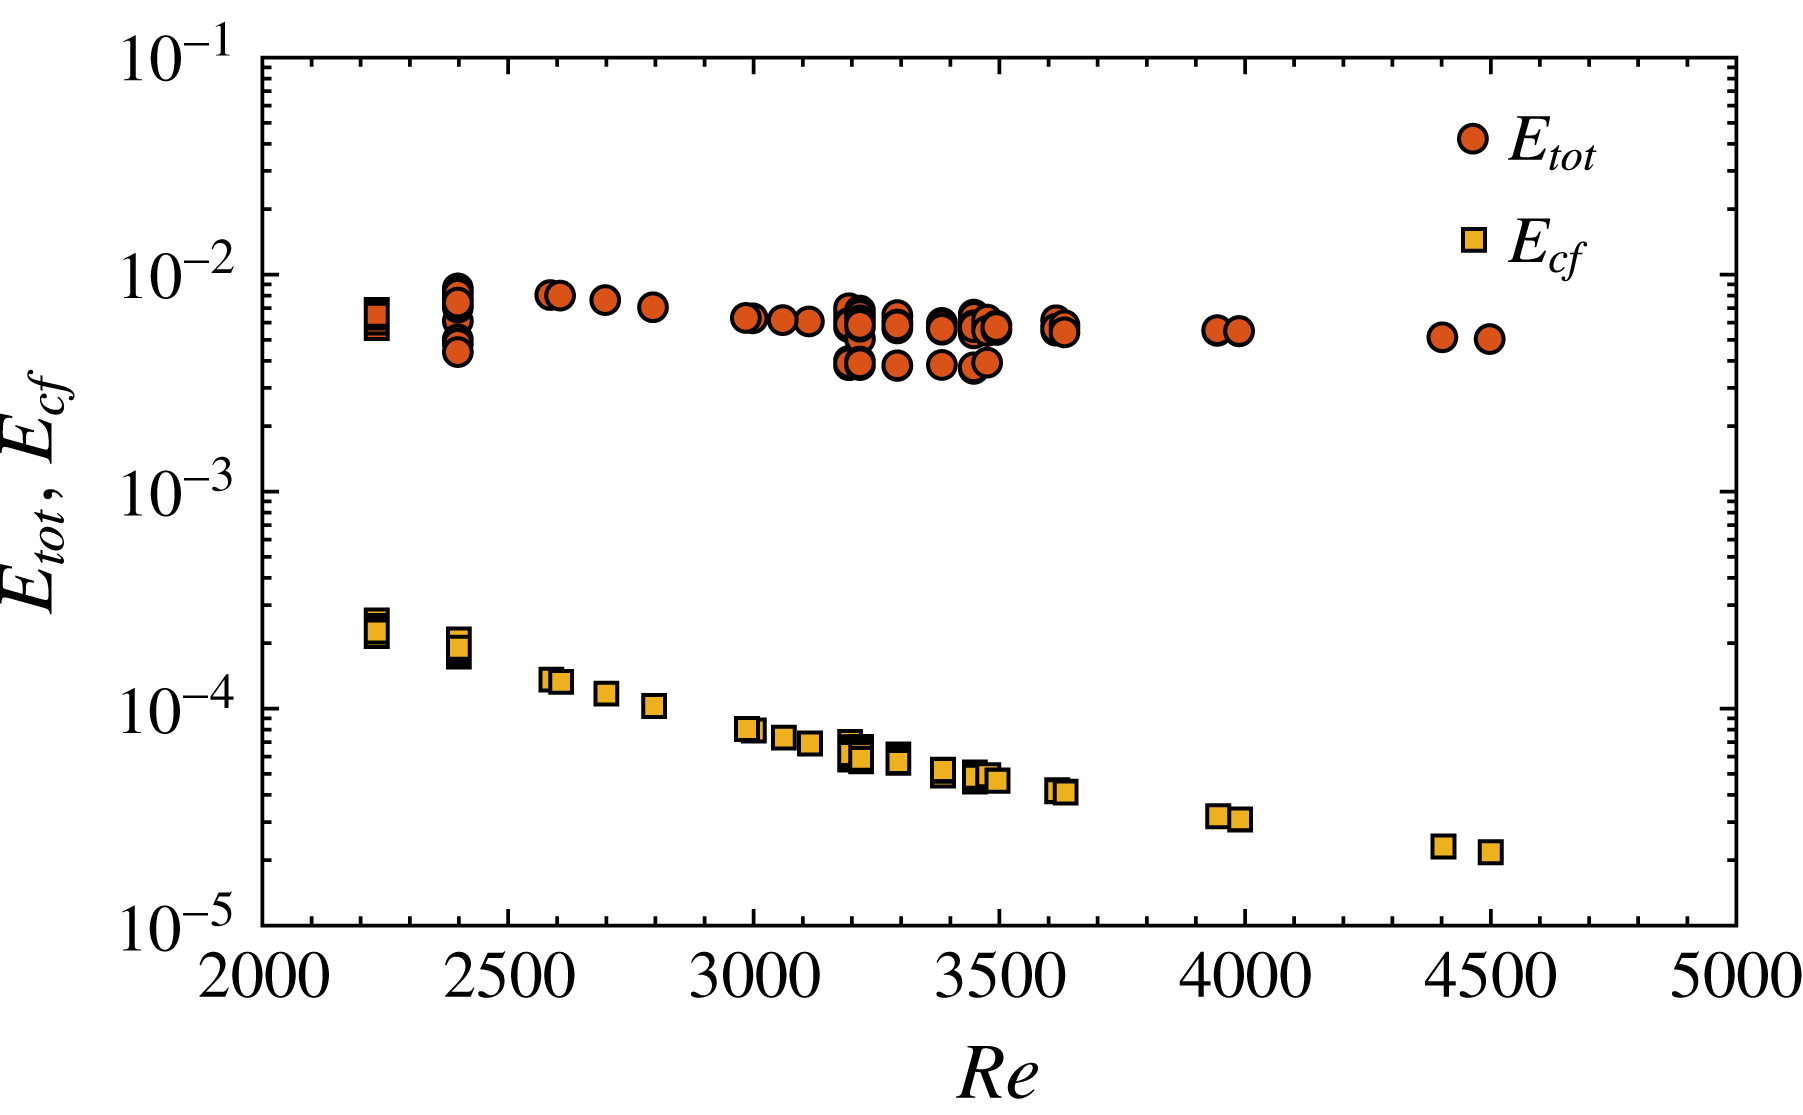
Bifurcation diagram of the maximum total and cross-flow energy,
 $E_{tot}$
and
 $E_{cf}$
, over the edge state evolution for channel flows with constant viscosity,
 $\unicode[STIX]{x1D707}_{c}=1$
. Multiple symbols at a given
 $Re$
indicate that the state is aperiodic.

The bifurcation diagram of inter-burst time intervals
 $T$
over a typical range of Reynolds numbers at which subcritical transition occurs is presented in figure 8. Periods are indicated by symbols at given
 $Re$
; periodic orbits correspond to single entries while for chaotic ones we report all the calculated periods over the total integration time after discarding the initial transient up to
 $t=4000$
. Results are in agreement with Zammert & Eckhardt (Reference Zammert and Eckhardt2014a
) and show mostly periodic solutions in the range
 $Re=[2600,3100]$
and for
 $Re>4000$
. At intermediate Reynolds,
 $Re=[3100,3600]$
, orbits undergo bifurcations that result in chaotic states, for which
 $T$
largely fluctuates. In the range
 $Re=[3100,3300]$
, we could not track the
 $PO_{2}$
family of periodic orbits documented by Zammert & Eckhardt (Reference Zammert and Eckhardt2014a
) characterised by short periods
 $T\approx 500$
. On the contrary, we find chaotic recurrence of bursts even after extending the total tracking time of the states to twice that used by the mentioned authors. The chaotic nature of the edge state recurrence depends on the properties of the dynamic saddle and does not bear a specific physical meaning. Minute changes to any flow parameter can affect significantly the recurrence of the edge state, as it is the case for the relative periodic orbit documented by Khapko et al. (Reference Khapko, Kreilos, Schlatter, Duguet, Eckhardt and Henningson2013) in the asymptotic suction boundary layer. Small changes resulted in a spanwise left-hopping, right-hopping, left-right-hopping or erratic shifts. Despite this substantial difference, the nature of the flow structures evolving in time remains the same between the four cases. Similarly, the edge states reported in this paper are qualitatively the same as in figures 1 and 2 for each Reynolds number considered, despite differences in their period. The chaotic orbits of figure 8 and the ones described in § 4 can also be explained by the fixed maximum observation time used in the simulations; it cannot be excluded that extending this limit to sufficiently large times could result in convergence to a constant time period.
The bifurcation diagrams of the maximum total and cross-flow energy during each recurrence of the edge state regeneration cycle are shown in figure 9. They provide an indication of the strength of the flow structures and on the minimal energy needed to have self-sustained dynamics. They also represent a local threshold for transition for perturbations evolving in the neighbourhood of the edge state. There, the slightest deviation from the reported values will either result in relaminarisation or in transition to the turbulent regime. Overall, both
 $E_{tot}$
and
 $E_{cf}$
decrease as the Reynolds number increases, meaning that smaller perturbations measured in centreline velocity are needed to sustain the edge state dynamics. Several aperiodic edge states are characterised by approximately constant values of
 $E_{tot}$
and
 $E_{cf}$
at each regeneration cycle. For example, at
 $Re=3946$
the period fluctuates between
 $T=1340$
and
 $T=1770$
while the energies vary by less than
 $0.2\,\%$
around the values
 $E_{tot}=5.45\times 10^{-3}$
and
 $E_{cf}=3.19\times 10^{-5}$
. The physical interpretation of having same perturbation energy and different periods is that, while the volume average energy of the streaks and vortices is repeatedly the same, the specific shape of the streaks changes, thereby modifying their secondary stability and characteristic time scales of the sinuous instability.
4 Effect of viscosity
4.1 Energy level and local threshold of the edge
In this section we quantify the modification to the perturbation kinetic energy of the edge state caused by variable viscosity. As discussed in § 1, an altered energy level of the edge state means a shift of its location in the state space with respect to the laminar attractor and turbulent saddle. Lower energy corresponds to an edge state that is closer to the laminar state and to a modulation of the surrounding manifold that restricts its basin of attraction. As a consequence, perturbations evolving near the attracting region of the edge state have to exceed a lower energy threshold to evolve into turbulence. The opposite results if the energy of the edge state increases.
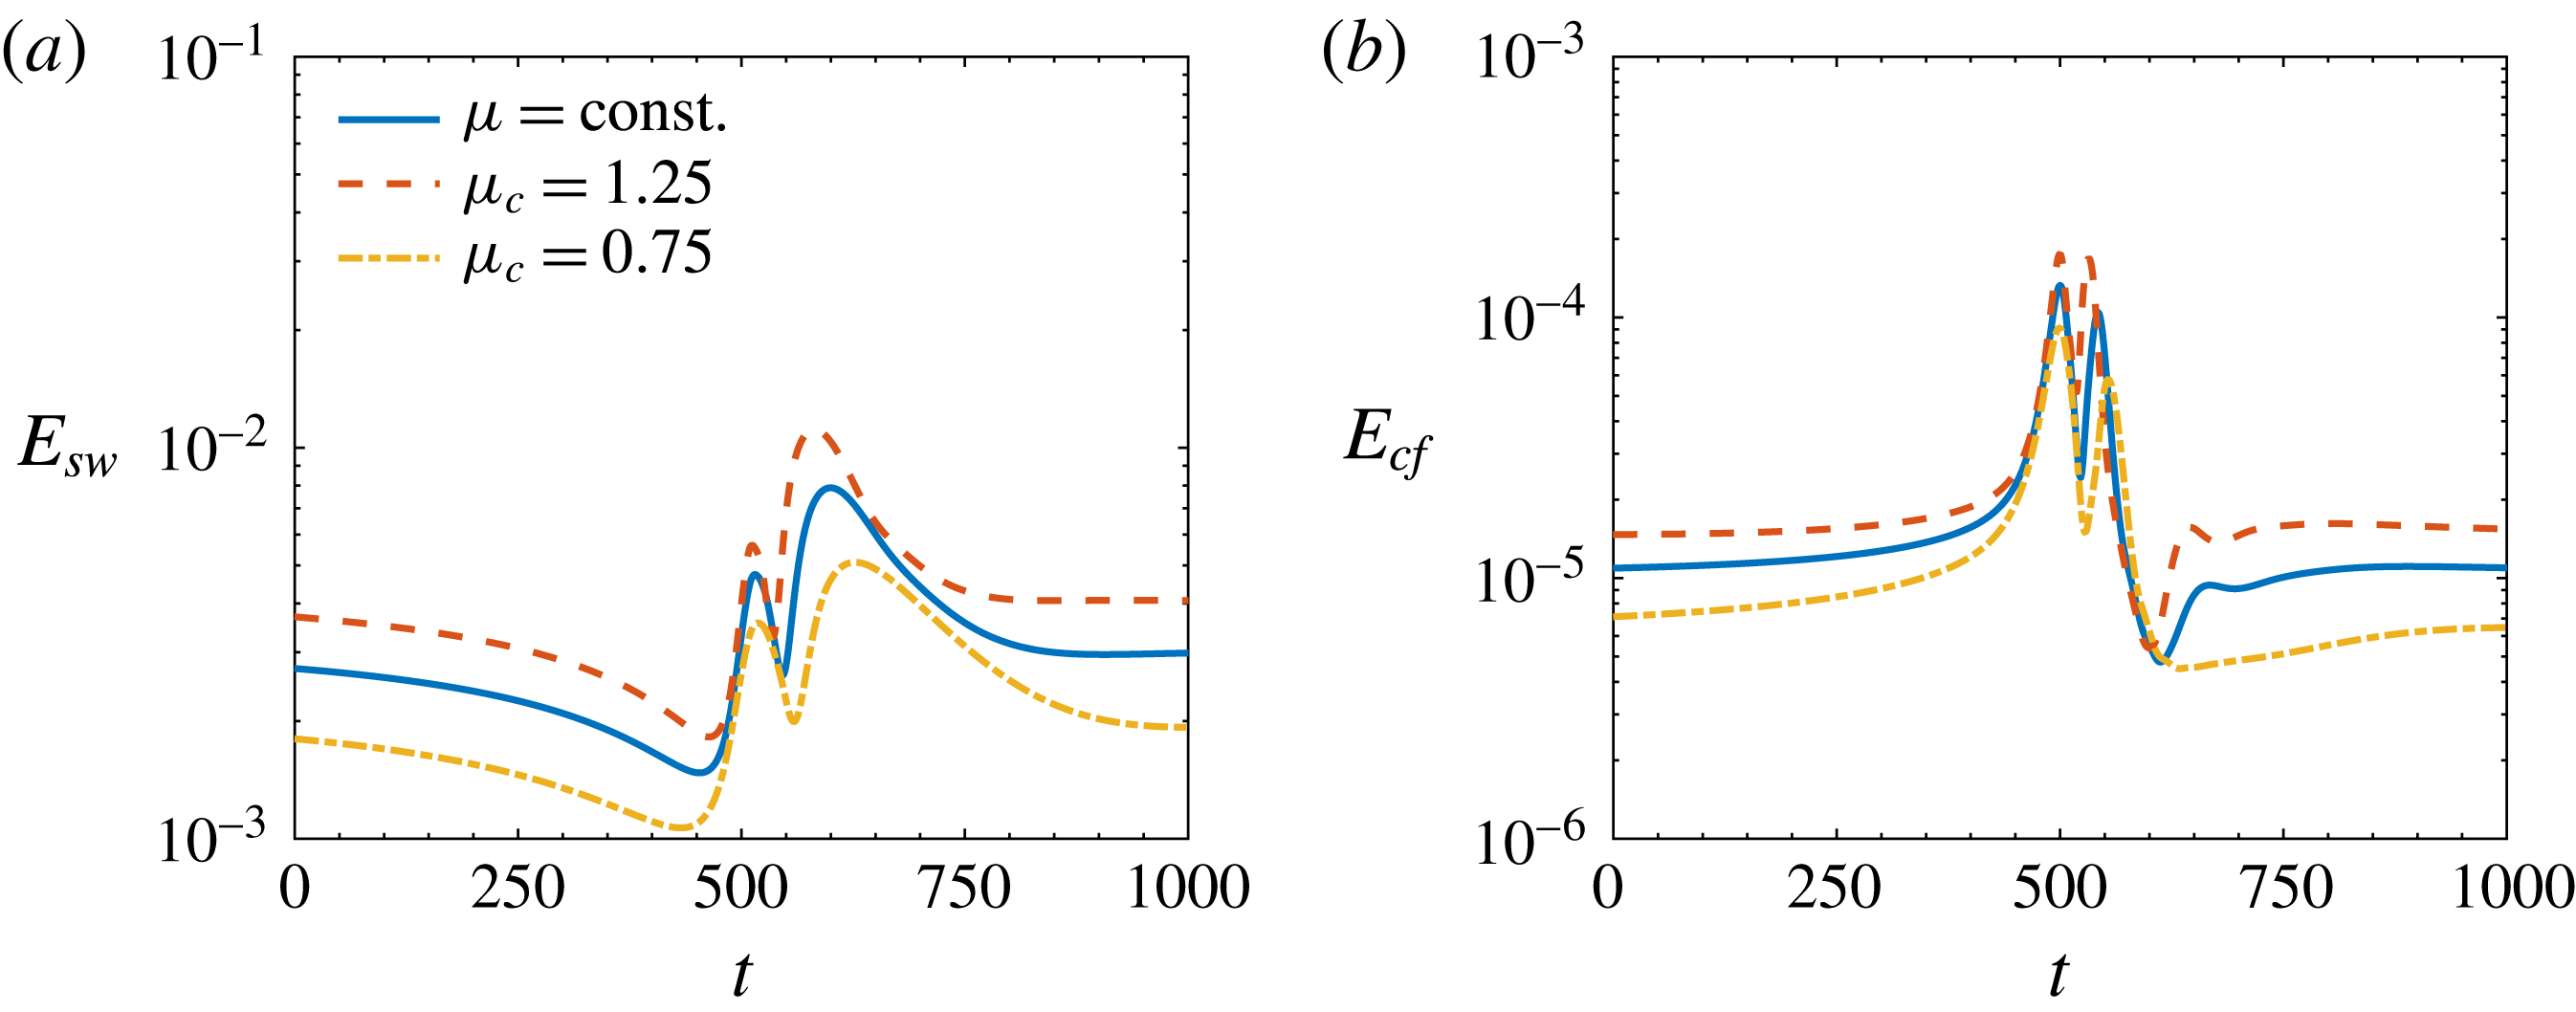
Portion of the time evolution of the volume averaged streamwise and cross-flow kinetic energy,
 $E_{sw}$
and
 $E_{cf}$
, for flow cases at
 $Re=2608$
. Line patterns are the same in (a) and (b).

We start characterising the effect of viscosity by looking at the time evolution of the streamwise and cross-flow energy of the edge states at
 $Re=2608$
displayed in figure 10. Variable viscosity does not affect the qualitative trends but modulates the energy levels of the edge state. If
 $\unicode[STIX]{x1D707}_{c}>1$
,
 $E_{sw}$
is larger than for the constant viscosity case at each step of the edge state evolution, while the opposite is true if
 $\unicode[STIX]{x1D707}_{c}<1$
, see figure 10(a). The same behaviour is followed by
 $E_{cf}$
in figure 10(b). Weaker streaks and weaker vortices are needed in case
 $\unicode[STIX]{x1D707}_{c}<1$
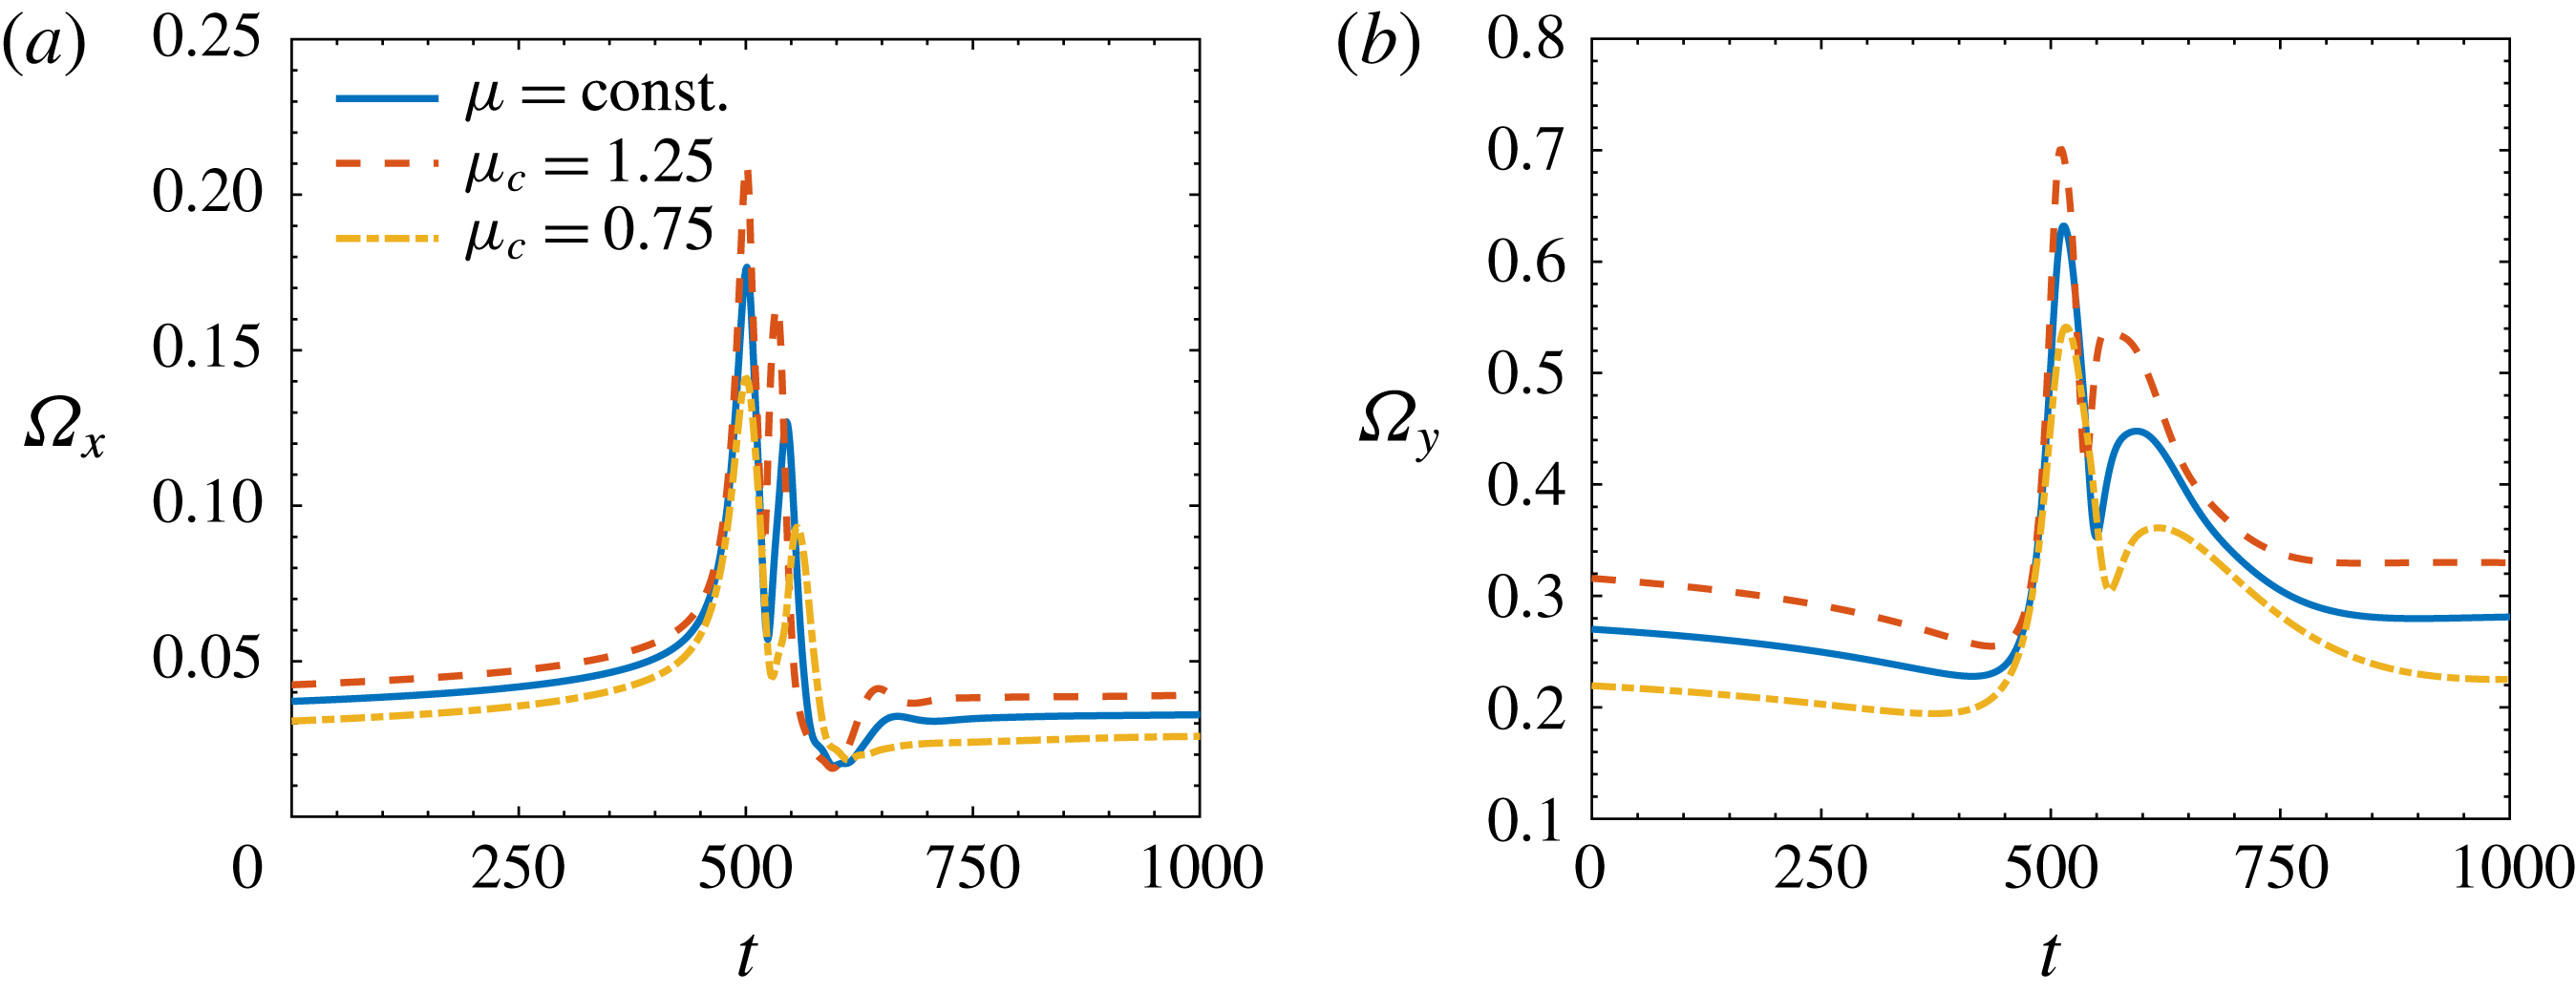
to self-sustain the edge state dynamics, therefore the perturbation energy threshold for transition in that area of the state space is smaller. This statement can also be assessed in terms of streamwise and wall-normal vorticity. Figure 11(a) shows that
 $\unicode[STIX]{x1D6FA}_{x}$
increases for the
 $\unicode[STIX]{x1D707}_{c}=1.25$
case with respect to
 $\unicode[STIX]{x1D707}_{c}=1$
, thus confirming stronger streamwise vortical structures;
 $\unicode[STIX]{x1D6FA}_{y}$
also increases, see figure 11(a), therefore the shear due to streaky structures at their highest amplitude is larger. The same conclusions are drawn if results are compared at the same
 $\overline{Re}$
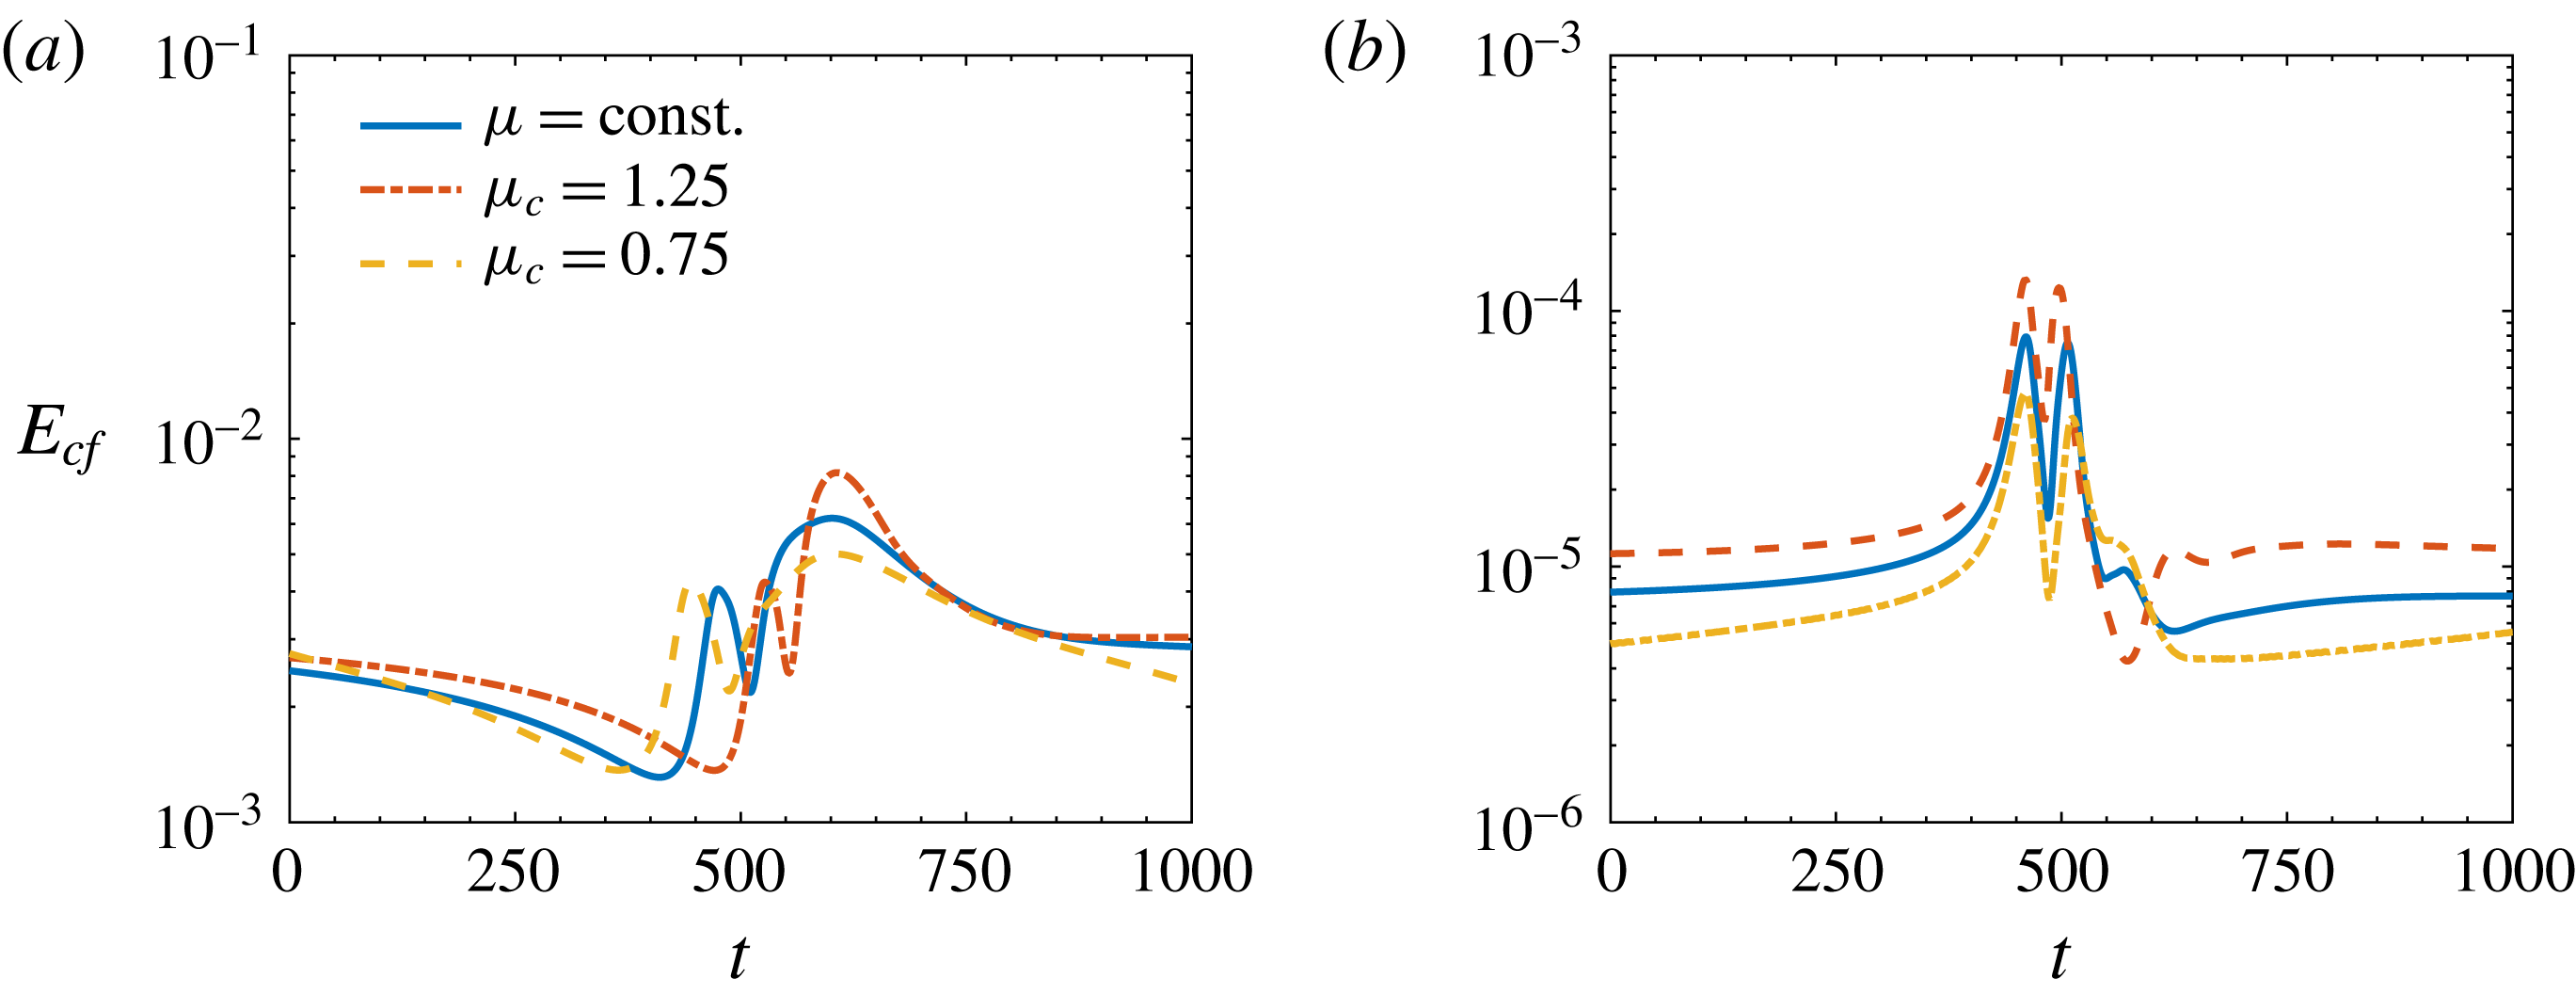
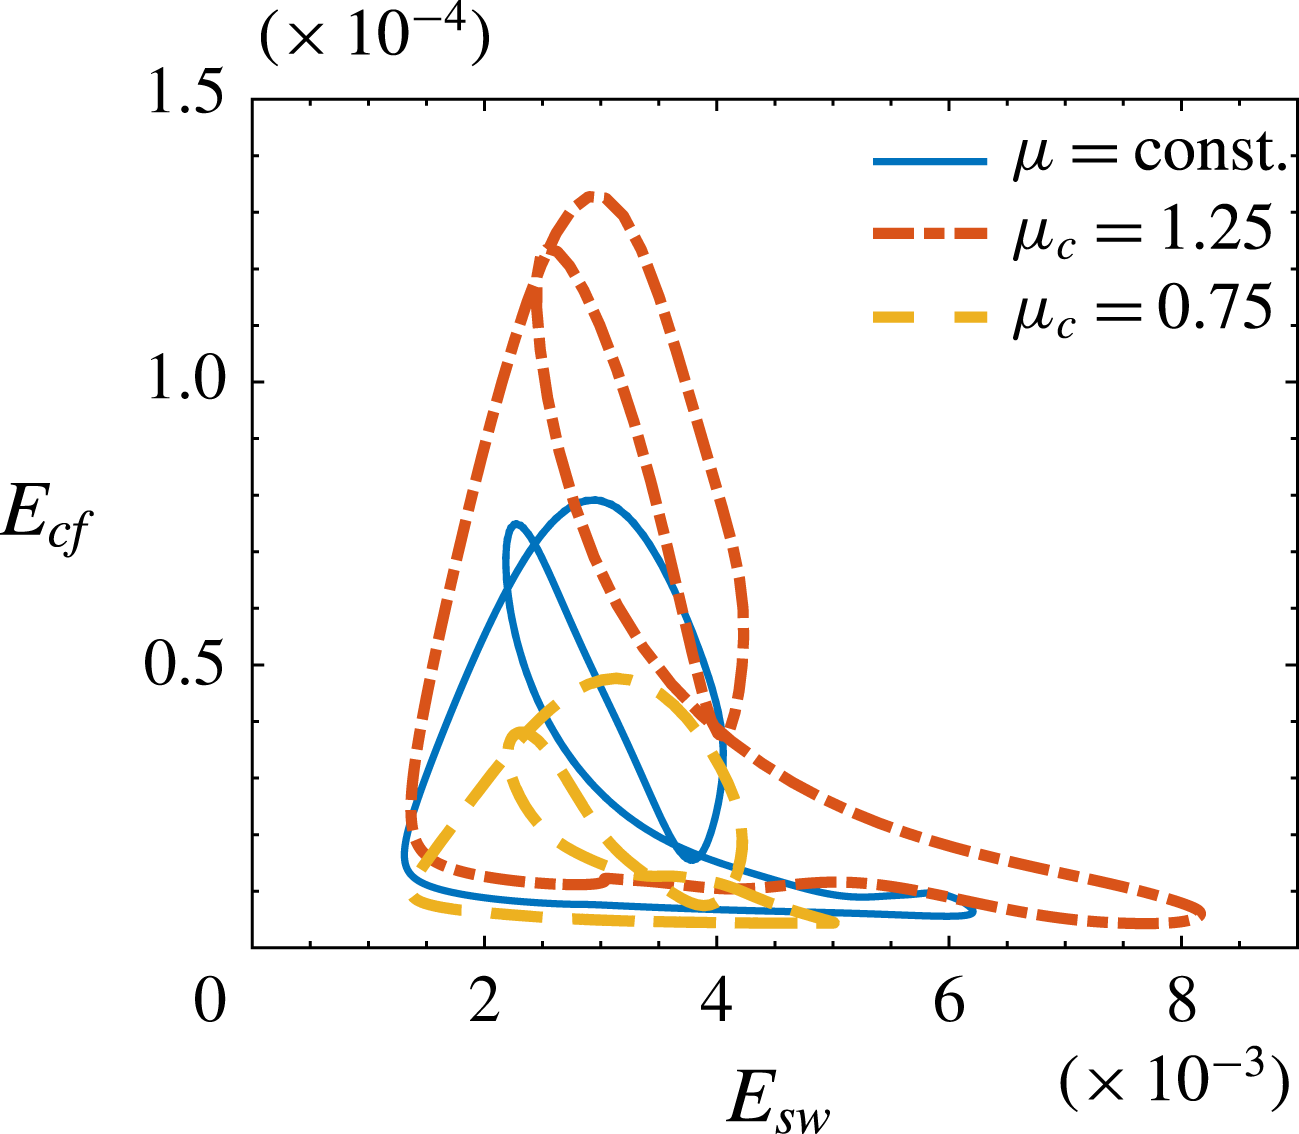
. Figure 12 shows
 $E_{sw}$
and
 $E_{cf}$
for flow cases with
 $\unicode[STIX]{x1D707}_{c}=0.75,1$
and 1.25 at
 $\overline{Re}=3000$
.
Portion of the time evolution of the volume averaged streamwise and wall-normal vorticity,
 $\unicode[STIX]{x1D6FA}_{x}$
and
 $\unicode[STIX]{x1D6FA}_{y}$
, for flow cases at
 $Re=2608$
. Line patterns are the same in (a) and (b).

Portion of the time evolution of the volume averaged streamwise and cross-flow kinetic energy,
 $E_{sw}$
and
 $E_{cf}$
, for flow cases at
 $\overline{Re}=3000$
. Line patterns are the same in (a) and (b).

State space projection of the edge state orbit at
 $Re=2608$
. Rescaled simulations correspond to
 $\overline{Re}=3000$
in (a) and
 $\overline{Re}=2233$
in (b). Scattered trajectories indicate that the state is aperiodic.

State space projection of the edge state orbits at
 $\overline{Re}=3000$
and
 $\unicode[STIX]{x1D707}_{c}=0.75,1,1.25$
.

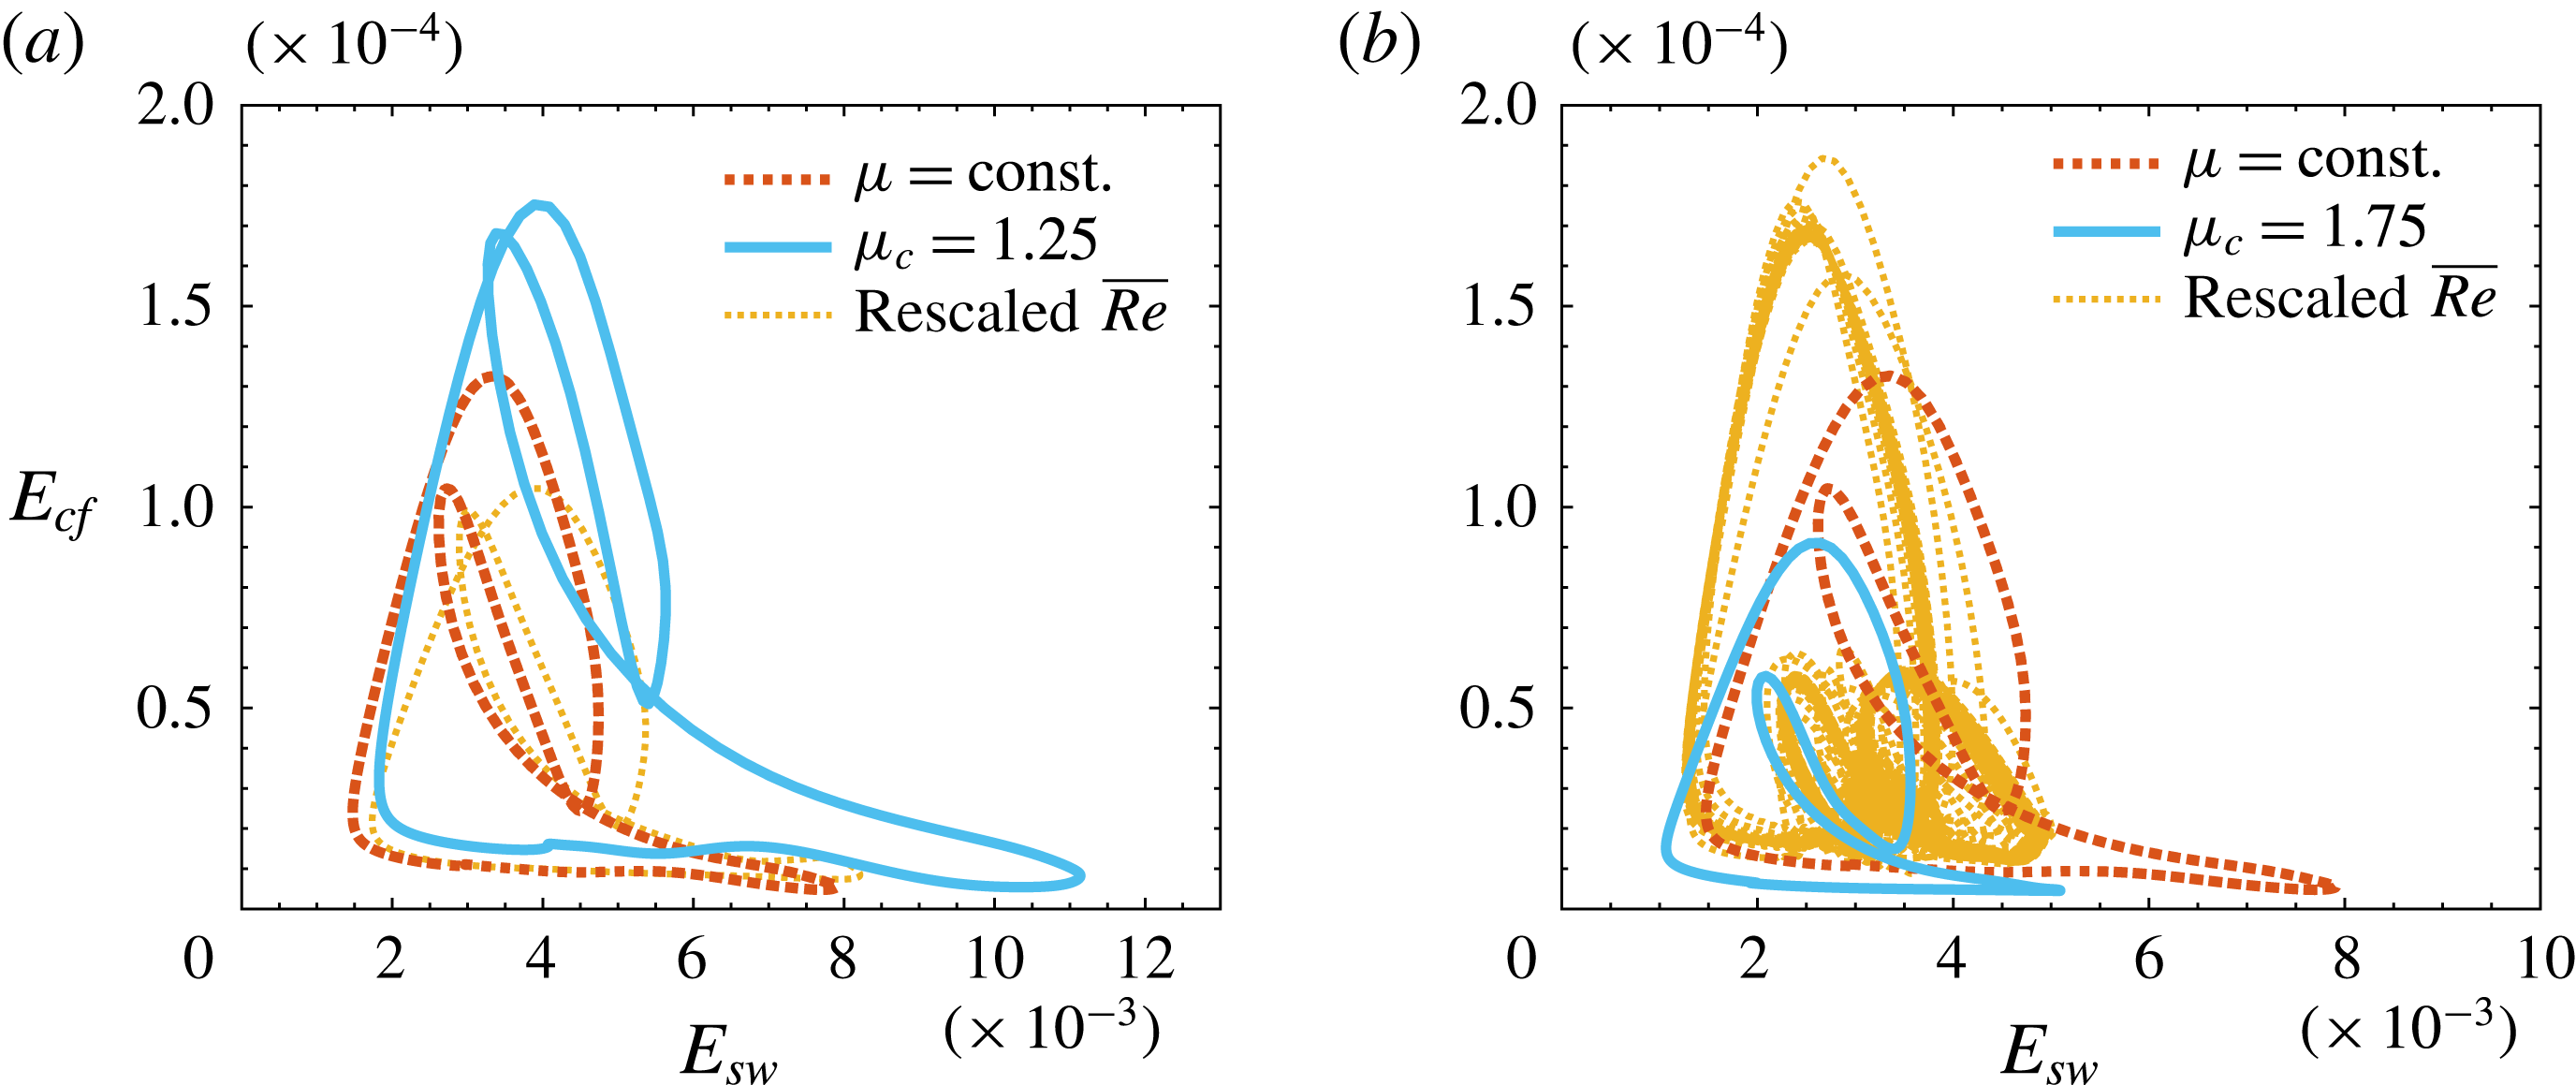
A complete picture on the whole edge state dynamics modification is given by the projection of its orbit on the
 $E_{sw}-E_{cf}$
state space, see figure 13. Results are presented for
 $Re=2608$
only but are qualitatively the same at different Reynolds numbers. The whole integrated history of the energy is plotted after the initial transient of 4000 non-dimensional time units. When the orbit is periodic the time trace collapses over one single trajectory; this is the case for all the orbits displayed in figure 13(a). On the other hand, aperiodic orbits follow slightly different trajectories over each period thus resulting in a more scattered plot, as is the case for the rescaled
 $\overline{Re}=2233$
in figure 13(b). Increasing viscosity away from the walls results in stronger streaks that are generated by stronger vortices as compared to the
 $\unicode[STIX]{x1D707}_{c}=1$
case. It can be then concluded that stronger perturbations are needed to trigger transition in flows evolving near the edge state. The opposite results from decreasing viscosity towards the centreline. In order to rule out that the observed effects can be reproduced by a simple rescaling of the Reynolds number of constant viscosity cases when comparing at constant
 $Re$
, the figures additionally include results for
 $\unicode[STIX]{x1D707}_{c}=1$
at
 $\overline{Re}=Re\int \unicode[STIX]{x1D707}(y)\text{d}y/2$
. Rescaling of constant viscosity simulations, when comparing at constant
 $Re$
, based on the average viscosity, can qualitatively predict the effect of viscosity on the strength of streaks only, while it fails in describing the cross-flow motion and vortex intensity as it predicts an opposite effect. The same modulating effect of viscosity on the edge state energy is observed comparing flow cases at the same Reynolds number based on the wall viscosity, as displayed in figure 14 for
 $\overline{Re}=3000$
.
Bifurcation diagrams of the maximum (a–c) total and (d–f) cross-flow energy function of
 $\unicode[STIX]{x1D707}_{c}$
for three Reynolds numbers;
 $Re=2608$
(a,d);
 $Re=3000$
(b,e);
 $Re=3618$
(c,f). Symbols are the same as in figure 20. Small light symbols are the edge states for constant viscosity at Reynolds number
 $\overline{Re}=Re\,\int \unicode[STIX]{x1D707}\,\text{d}y/2$
; their periods are rescaled by the factor
 $Re/\overline{Re}$
in order to be consistent with the normalisation used for the variable viscosity cases.

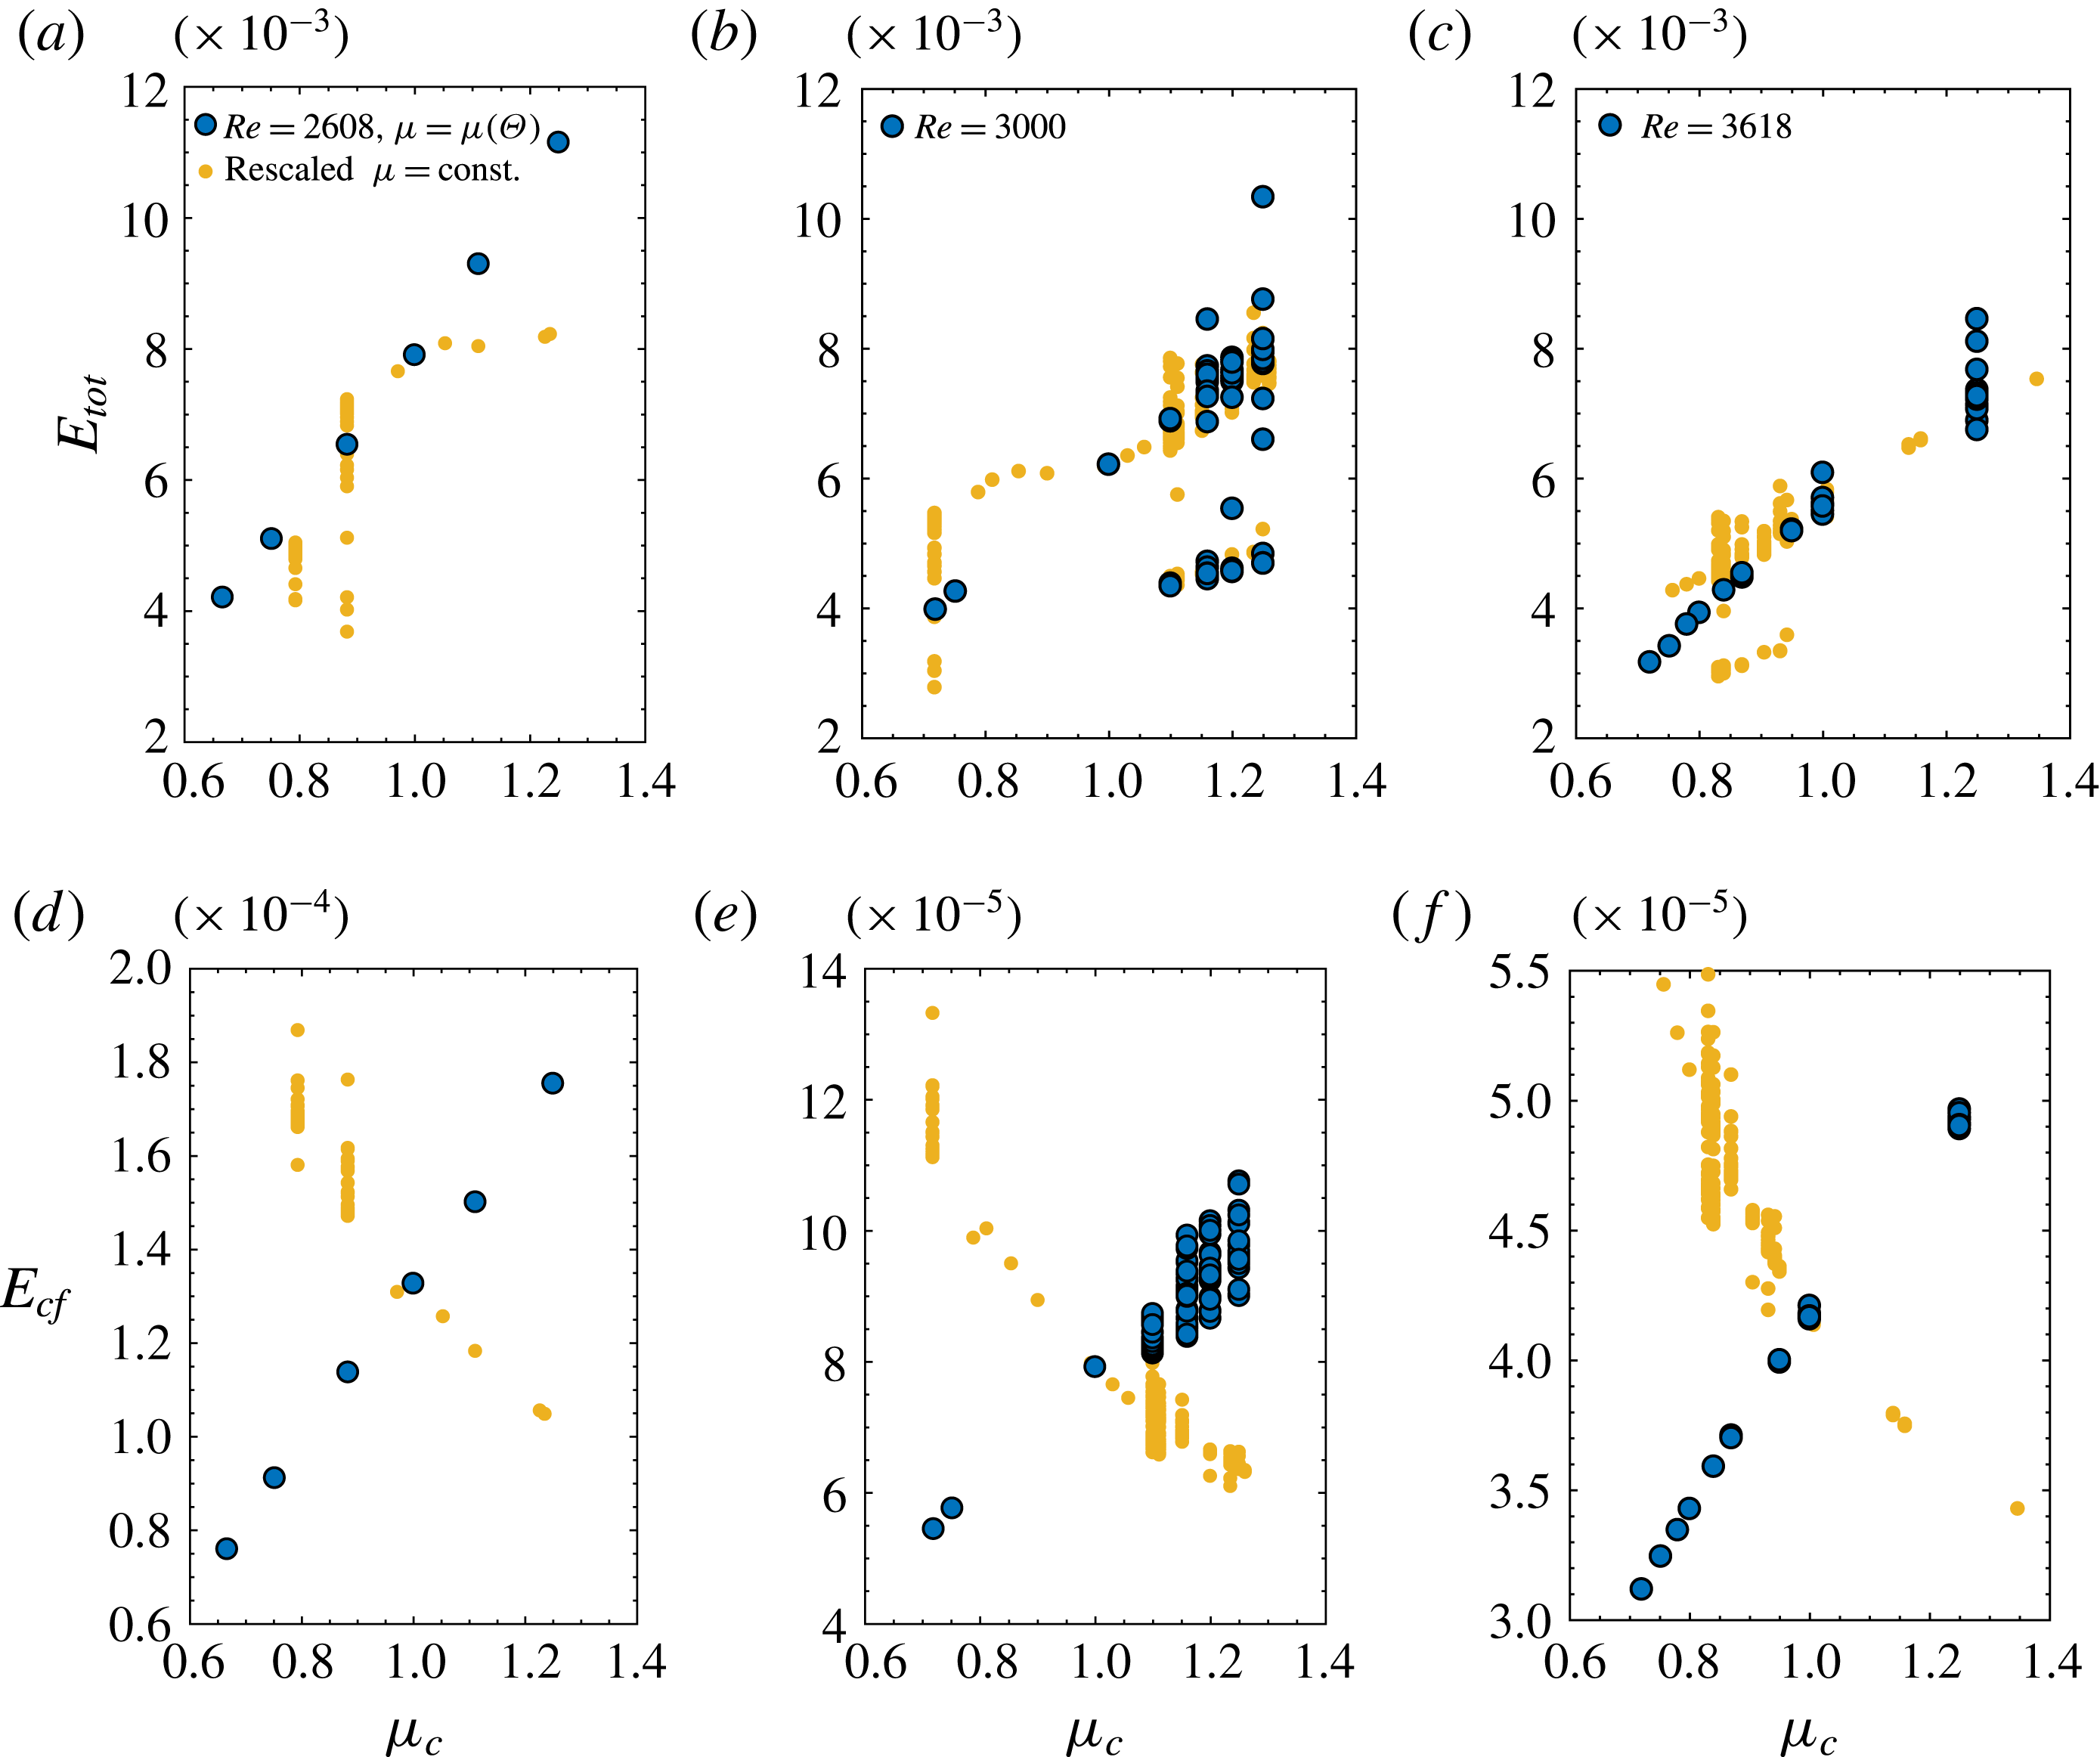
A more comprehensive view on the effect of viscosity on the edge state energy is provided by figure 15, which shows at constant
 $Re$
the bifurcation diagrams of the maximum total and cross-flow energy at each regeneration cycle of the edge state using
 $\unicode[STIX]{x1D707}_{c}$
as the bifurcation parameter. As in figure 13, results for the constant property cases are included for comparison and rescaled by
 $\overline{Re}/Re$
. Smaller viscosity at the centreline consistently results in lower
 $E_{tot}$
and
 $E_{cf}$
, while the opposite occurs if
 $\unicode[STIX]{x1D707}_{c}>1$
. The rescaled values of constant viscosity edge states reasonably capture the overall trend of
 $E_{tot}$
, that is predominantly contained in the streamwise streaks. However, the quantitative values are not matched and discrepancies are observed in terms of the periodic or chaotic nature of the edge state orbit. Rescaling of constant viscosity results completely fails in predicting the trend of
 $E_{cf}$
. If
 $\unicode[STIX]{x1D707}_{c}<1$
the maximum kinetic energy of the cross-flow motion monotonically decreases while the opposite occurs in constant viscosity flows at rescaled (higher) Reynolds numbers. Bifurcation diagrams of maximum streamwise and wall-normal vorticity over the period of the edge state (not included here) confirm what discussed in terms of energy. The overall increase of maximum
 $\unicode[STIX]{x1D6FA}_{x}$
if
 $\unicode[STIX]{x1D707}_{c}>1$
and decrease if
 $\unicode[STIX]{x1D707}_{c}<1$
is consistent with respectively stronger and weaker vortical structures and is opposite to what a rescaling of constant viscosity cases would predict. The increase (
 $\unicode[STIX]{x1D707}_{c}>1$
) and decrease (
 $\unicode[STIX]{x1D707}_{c}<1$
) of the maximum
 $\unicode[STIX]{x1D6FA}_{y}$
is a measure of the higher and lower shear induced by the strengthening and weakening of the streaks. Larger peak values of
 $\unicode[STIX]{x1D6FA}_{y}$
when streaks are strongest and the flow is essentially two-dimensional (the velocity profile is a function of the streamwise and wall-normal coordinates only as in figure 2) indicate a more pronounced inflectional point from which a stronger secondary instability evolves.
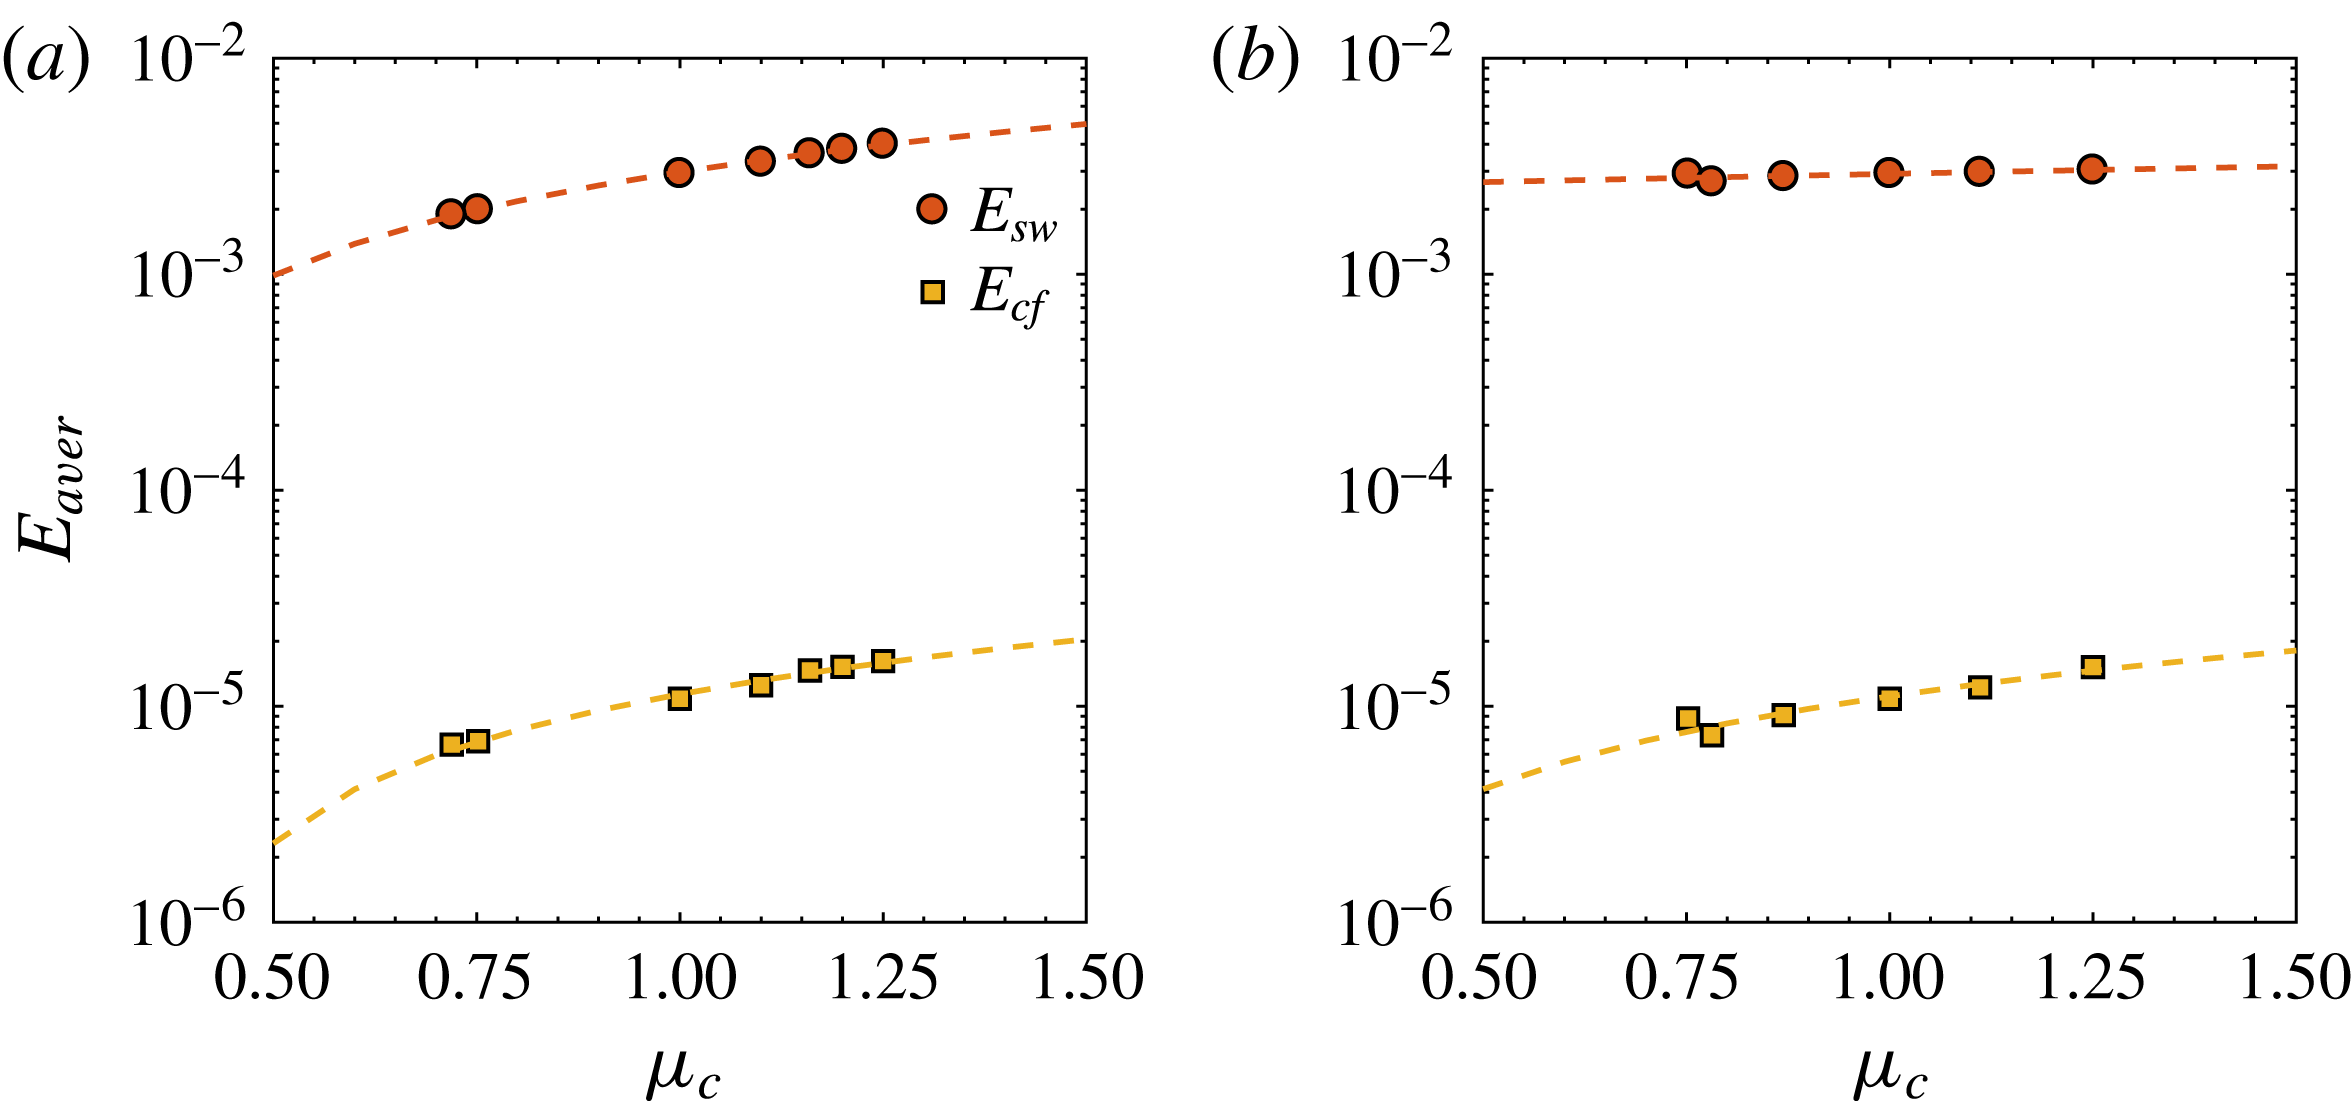
A final summary of the modified energy threshold of the edge state due to viscosity gradients is given in figure 16 by means of average values of
 $E_{sw}$
and
 $E_{cf}$
over the integrated time history (excluding the initial transient up to
 $t=4000$
) for
 $Re=3000$
and
 $\overline{Re}=3000$
, and several values of the centreline viscosity. Regardless of the choice of reference viscosity, the average energy decreases if
 $\unicode[STIX]{x1D707}_{c}<1$
and increases if
 $\unicode[STIX]{x1D707}_{c}>1$
.
Average values of
 $E_{sw}$
and
 $E_{cf}$
over the integrated time history of the edge states at
 $Re=3000$
(a);
 $\overline{Re}=3000$
(b). Dashed lines indicate linear fits of the results.

An alternative measure of the threshold needed to maintain the edge state on the laminar/turbulent boundary is given by the streamwise pressure gradient, which on average is directly related to the wall shear stress in non-dimensional form as
 $$\begin{eqnarray}\unicode[STIX]{x1D70F}_{w}=-\overline{Re}\frac{\text{d}P}{\text{d}x}.\end{eqnarray}$$
As discussed in § 2,
 $\text{d}P/\text{d}x$
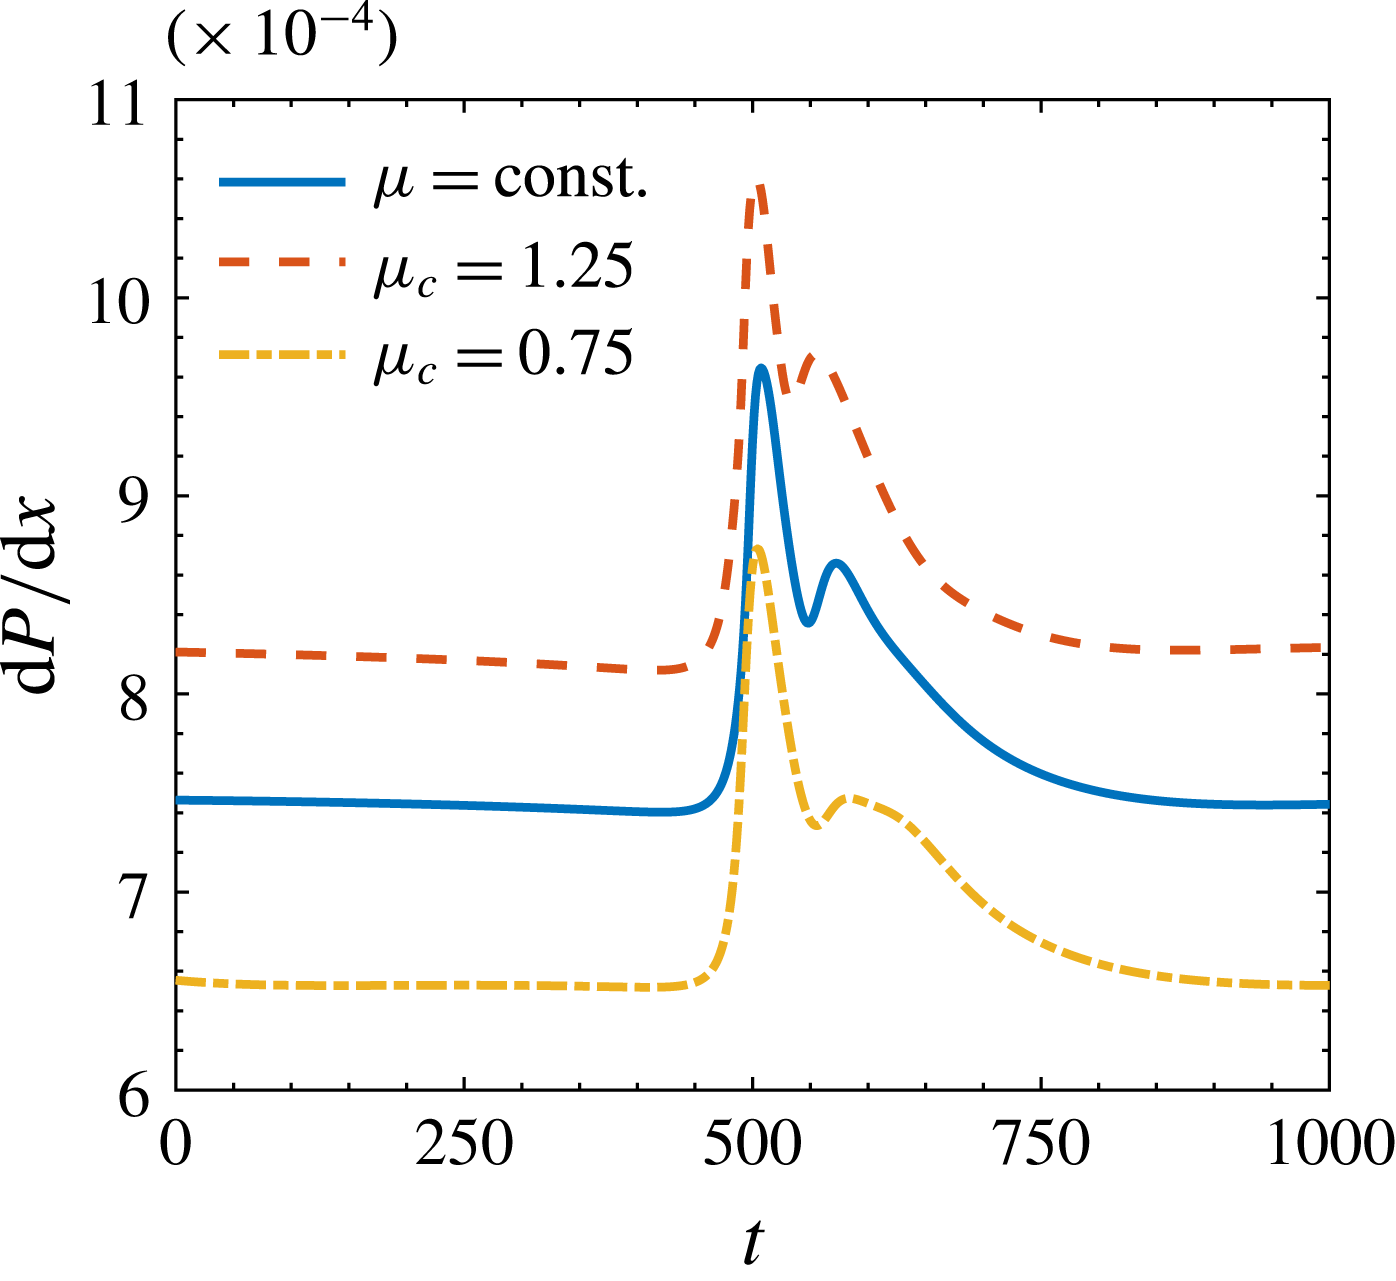
is adapted at each time step in order to keep a constant Reynolds number based on the bulk velocity. Figure 17 reports the pressure gradient calculated based on the average (in time and between upper and lower wall) wall shear stress for flow cases with constant and variable viscosity at the same
 $\overline{Re}=3000$
. The relative increase of the pressure driving force averaged in time is quantified in
 $\unicode[STIX]{x0394}(\text{d}P/\text{d}x)=9.8\,\%$
if
 $\unicode[STIX]{x1D707}_{c}=1.25$
and
 $\unicode[STIX]{x0394}(\text{d}P/\text{d}x)=-10.5\,\%$
if
 $\unicode[STIX]{x1D707}_{c}=0.75$
. The energy input required to sustain the edge state is thus smaller if viscosity decreases away from the walls, in support to its smaller energy level and reduced threshold for transition in its vicinity in the state space.
Portion of the time history of the pressure gradient used to drive the flow at
 $\overline{Re}=3000$
for
 $\unicode[STIX]{x1D707}_{c}=0.75,1,1.25$
, while keeping the bulk velocity constant.

4.2 Perturbation kinetic energy budget
We define an evolution equation for the perturbation kinetic energy of a parallel flow with variable viscosity as
 $$\begin{eqnarray}\displaystyle \frac{D\langle k\rangle }{Dt} & = & \displaystyle -\frac{\unicode[STIX]{x2202}\langle p^{\prime }u_{i}^{\prime }\rangle }{\unicode[STIX]{x2202}x_{i}}+\left\langle p^{\prime }\frac{\unicode[STIX]{x2202}u_{i}^{\prime }}{\unicode[STIX]{x2202}x_{i}}\right\rangle -\frac{1}{2}\frac{\unicode[STIX]{x2202}\langle u_{i}^{\prime }u_{i}^{\prime }u_{j}^{\prime }\rangle }{\unicode[STIX]{x2202}x_{j}}\nonumber\\ \displaystyle & & \displaystyle +\,\frac{1}{2}\frac{\unicode[STIX]{x2202}}{\unicode[STIX]{x2202}x_{j}}\left[\unicode[STIX]{x1D707}_{d}(y)\frac{\unicode[STIX]{x2202}\langle u_{i}^{\prime }u_{j}^{\prime }\rangle }{\unicode[STIX]{x2202}x_{j}}\right]\underbrace{-\langle u_{i}^{\prime }u_{j}^{\prime }\rangle \frac{\unicode[STIX]{x2202}\langle U_{i}\rangle }{\unicode[STIX]{x2202}x_{j}}}_{P_{k}}\underbrace{-\unicode[STIX]{x1D707}_{d}(y)\left\langle \frac{\unicode[STIX]{x2202}u_{i}^{\prime }}{\unicode[STIX]{x2202}x_{j}}\frac{\unicode[STIX]{x2202}u_{i}^{\prime }}{\unicode[STIX]{x2202}x_{j}}\right\rangle }_{\unicode[STIX]{x1D700}_{k}},\end{eqnarray}$$
with the prime indicating the fluctuations with respect to the mean values calculated by using the Reynolds average, indicated by the angle brackets. The perturbation kinetic energy is expressed as
 $\langle k\rangle =(1/2)\langle u_{i}^{\prime }u_{i}^{\prime }\rangle$
,
 $P_{k}$
denotes the production and
 $\unicode[STIX]{x1D700}_{k}$
the dissipation, see for example Zonta, Marchioli & Soldati (Reference Zonta, Marchioli and Soldati2012). In a fully developed and statistically converged turbulent flow the balance of the right-hand-side terms of (4.2) integrated across the channel height is null. Similarly, the budget of a periodic orbit over
 $t=[t_{0},t_{0}+T]$
is identically zero in order to satisfy
 $E_{tot}(t_{0})=E_{tot}(t_{0}+T)$
. The terms written in divergence form are responsible for redistribution of energy, while the leading contributions to the balance are given by
 $P_{k}$
and
 $\unicode[STIX]{x1D700}_{k}$
. We studied the production and dissipation balance for several periodic edge states at three different Reynolds numbers, namely
 $Re=2608,3000,3618$
, and we found the same qualitative trends. For the sake of conciseness, we limit our discussion to
 $Re=2608$
, as at this Reynolds number all variable and constant viscosity solutions are periodic.
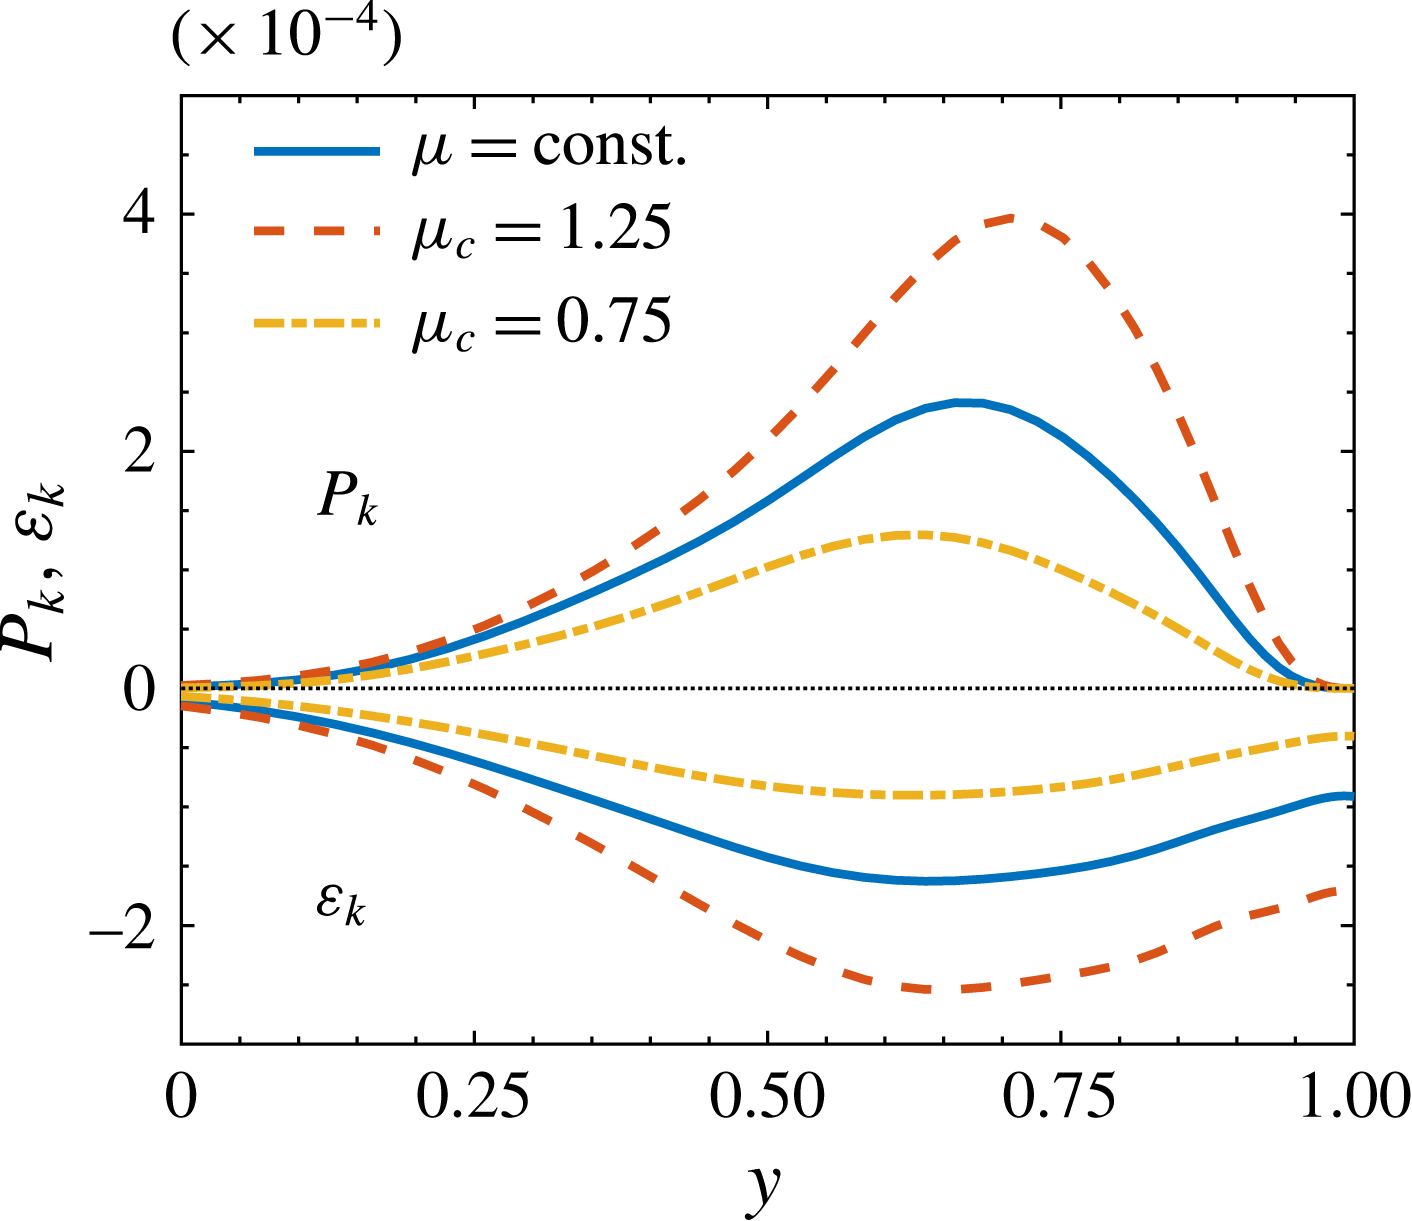
Perturbation kinetic energy production and dissipation over one period of the edge state at
 $Re=2608$
. The wall is located at
 $y=1$
.

Figure 18 shows the perturbation kinetic energy production and dissipation profiles as functions of the wall-normal location in the upper half of the channel, where the edge state is localised. Due to the relatively large size of the flow structures recurring in the edge state evolution and their distance from the wall, we use outer scaling to visualise the results in a consistent fashion with the rest of the paper. If the viscosity of the fluid increases towards the centreline, the PKE production peak increases and moves closer to the wall. Dissipation also increases in magnitude in order to balance the larger production and to keep the edge state at the same kinetic energy level at the end of the period. The opposite modulation of
 $P_{k}$
and
 $\unicode[STIX]{x1D700}_{k}$
occurs in case viscosity decreases towards the centreline. The described behaviour is consistent with the higher total energy in the edge state if
 $\unicode[STIX]{x1D707}_{c}>1$
; the more energetic structures needed to stay on the laminar/turbulent boundary require more PKE production to be sustained over the periodic recurrence the edge state. The opposite holds if
 $\unicode[STIX]{x1D707}_{c}<1$
.
The production and dissipation terms can be combined to have an indication on the degree of anisotropy of the fluctuating motions and on the formation of streaks by defining the so-called local shear rate
 $S=P_{k}/\unicode[STIX]{x1D700}_{k}$
, which measures the local relative importance of production over dissipation. A critical condition for the appearance of streaks is
 $S>1$
(Lam & Banerjee Reference Lam and Banerjee1992); the larger the value of
 $S$
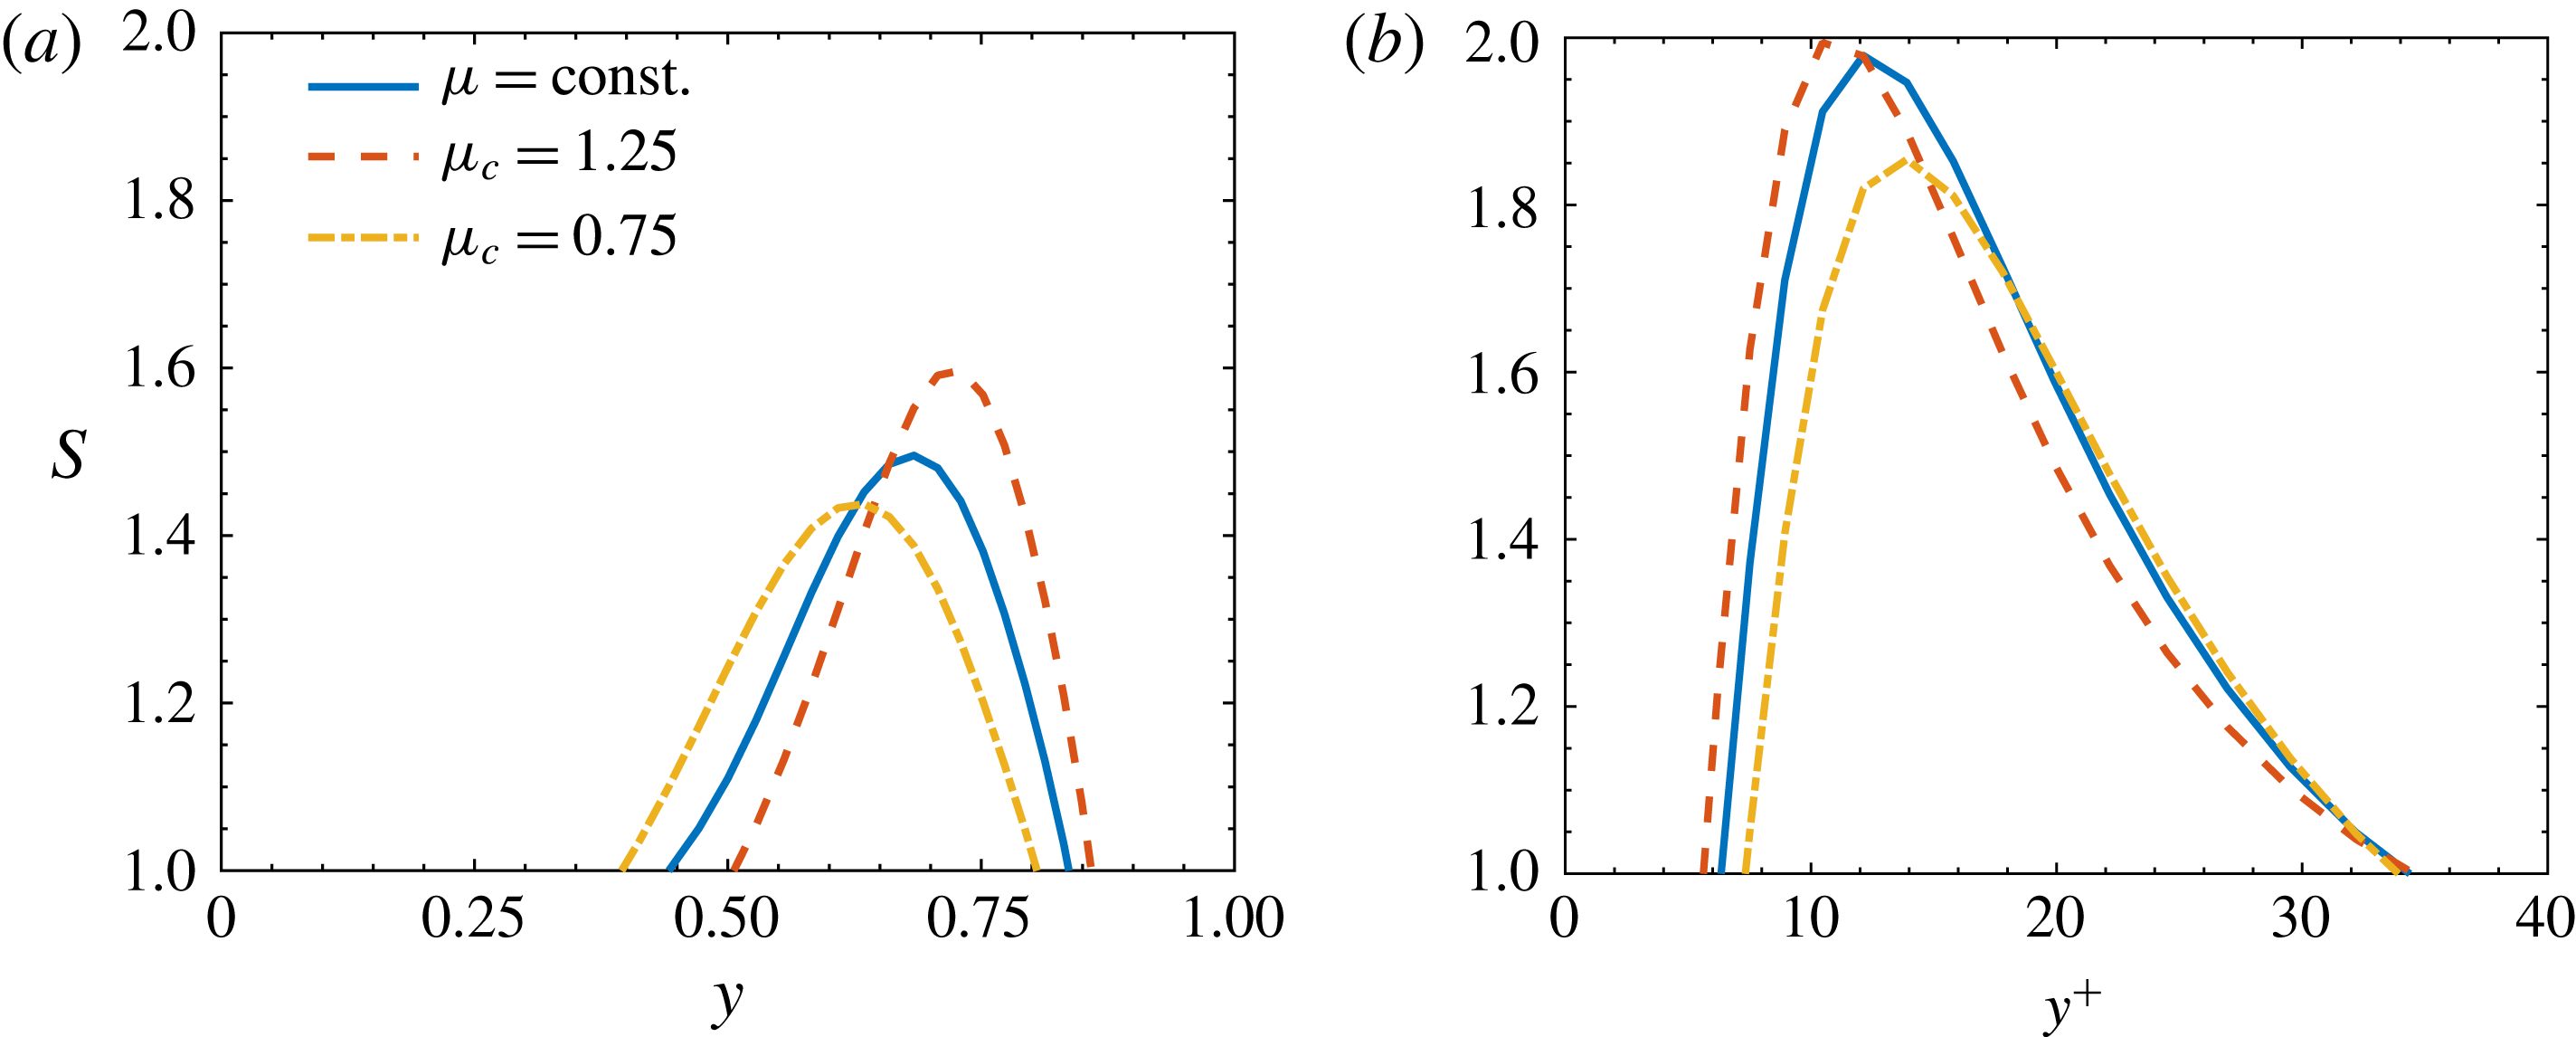
, the more persistent the streaks. Figure 19(a) shows the profiles of local shear rate in the upper half-channel for
 $\unicode[STIX]{x1D707}_{c}=0.75,1,1.25$
. In case
 $\unicode[STIX]{x1D707}_{c}>1$
, the increase of
 $S$
compared to the case with constant viscosity is consistent with the formation of stronger streaks highlighted in § 4.1. The extent of the region of the channel in wall-normal direction where streaks form moves closer to the wall and shrinks with respect to the constant viscosity case. The opposite effect is observed if
 $\unicode[STIX]{x1D707}_{c}<1$
.
Local shear rate
 $S=P_{k}/\unicode[STIX]{x1D700}_{k}$
(a) over one period of the edge state at
 $Re=2608$
and (b) in a turbulent channel flow at
 $Re=5000$
. In (b), inner units are calculated using the friction Reynolds number of the constant viscosity case
 $Re_{\unicode[STIX]{x1D70F}}=208$
. The wall is located at (a)
 $y=1$
and (b)
 $y^{+}=0$
.

In order to assess whether the highlighted trend of local shear rate is not limited to the transitional regime but, being a relative measure of production and dissipation hence independent from their actual values, can be representative of a weakly turbulent flow, we present in figure 19(b) data relative to direct numerical simulations (DNS) of turbulent channels at
 $Re=5000$
. The same frozen viscosity distribution and Reynolds number definition used in discussing edge states is adopted for the turbulent cases. Simulations are performed on a
 $\unicode[STIX]{x03C0}\times 2\times \unicode[STIX]{x03C0}/2$
domain with a resolution of
 $64\times 129\times 64$
Fourier–Chebyshev–Fourier modes. As for the simulations used to track the edge states, the flow is driven by a pressure gradient that changes in time in order to keep the bulk Reynolds number constant. This corresponds to a friction Reynolds number
 $Re_{\unicode[STIX]{x1D70F}}=208$
for the constant viscosity case. Results for the turbulent channel show the same modulating effect discussed for the edge states; the peak of
 $S$
increases and moves closer to the wall if
 $\unicode[STIX]{x1D707}_{c}>1$
and the opposite occurs for
 $\unicode[STIX]{x1D707}_{c}<1$
. We can assess to what extent the initial assumption of frozen viscosity distribution discussed in § 2 holds as the fluctuating field increases in intensity and reaches a turbulent state. A comparison between figure 19(b) and the results presented by Zonta et al. (Reference Zonta, Marchioli and Soldati2012) for a simultaneously heated and cooled channel flow of water at
 $Re_{\unicode[STIX]{x1D70F}}=180$
reveals the same qualitative modulation of
 $S$
in the near-wall region. Indeed, they find larger peak that moves closer to the wall where it is heated (lower viscosity at the wall, corresponding to
 $\unicode[STIX]{x1D707}_{c}>1$
in figure 19(b)) and the opposite effect on the cold wall.
4.3 Temporal recurrence and stability of edge states
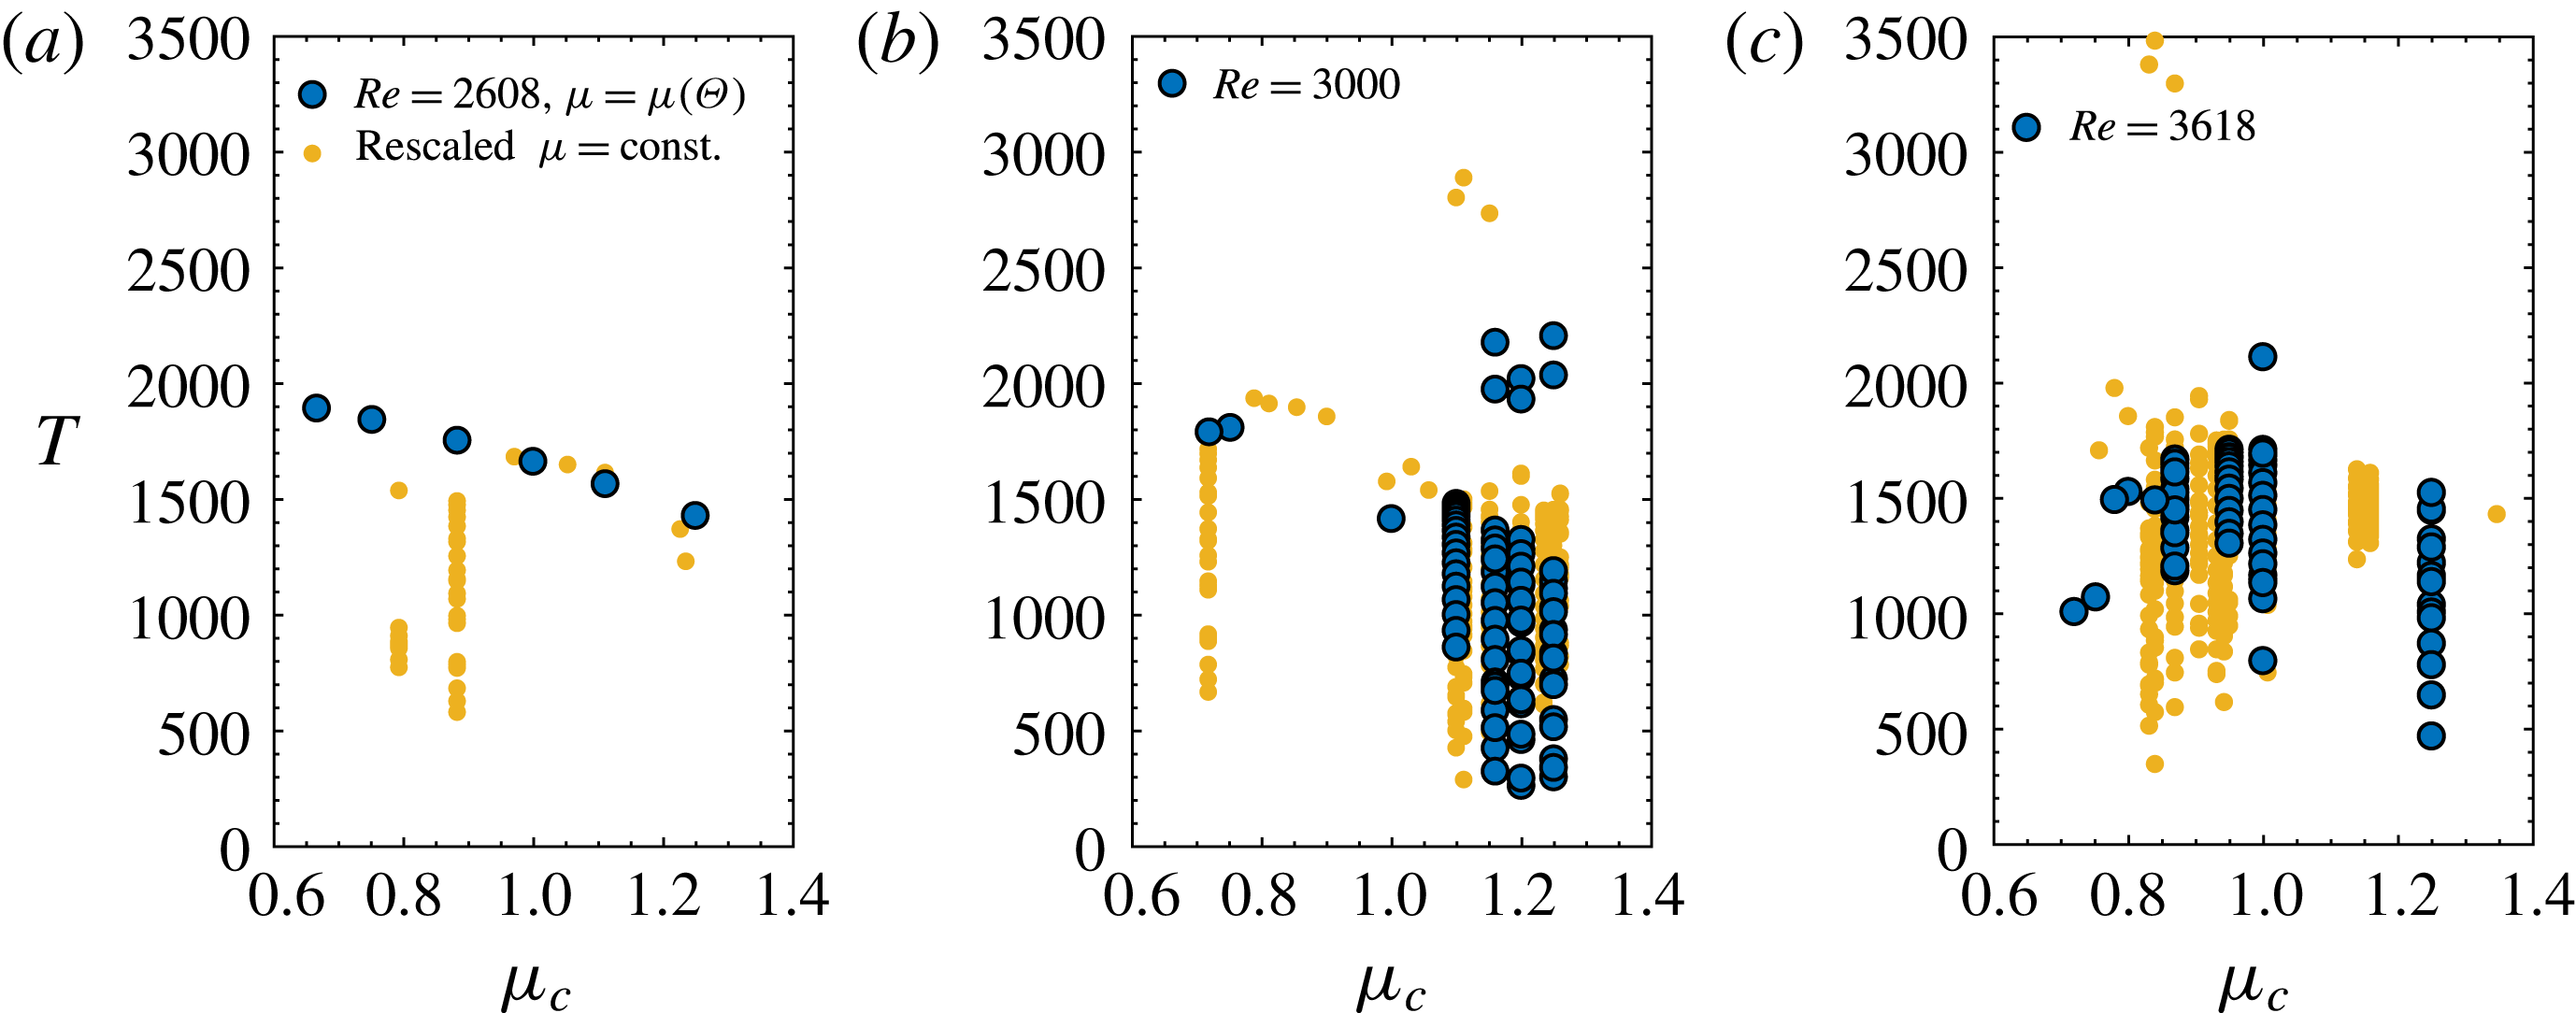
The effect of viscosity gradients on the recurrence of the self-sustained cycle is calculated as the time interval between two consecutive burst events and is quantified in figure 20, where the bifurcation parameter is the centreline viscosity, for three different Reynolds numbers, namely
 $Re=2608,3000,3618$
. Viscosity acts as a time modulator of the edge state dynamics and, in particular, of the development of the streamwise instability of the streaks. We highlight three effects caused by viscosity, namely (i) the orbit remains periodic with a modified frequency of streak break up, see figure 20(a); (ii) a periodic state at constant viscosity can be disrupted and driven to a chaotic one by bifurcations induced by viscosity gradients, see figure 20(b); (iii) a chaotic state at constant viscosity can be stabilised into a periodic orbit, see figure 20(c). As for § 4.1, the figures additionally include rescaled results of constant viscosity flow cases. The period
 $T$
is also rescaled by the factor
 $Re/\overline{Re}$
in order to have the same normalisation in terms of reference velocity.
Bifurcation diagrams of the inter-burst period
 $T$
function of
 $\unicode[STIX]{x1D707}_{c}$
at (a)
 $Re=2608$
; (b)
 $Re=3000$
; (c)
 $Re=3618$
. Dark symbols indicate variable viscosity edge states, including the reference case
 $\unicode[STIX]{x1D707}_{c}=1$
.

In the first scenario, see figure 20(a), increasing viscosity away from the walls (
 $\unicode[STIX]{x1D707}_{c}>1$
) shortens the inter-burst period, while decreasing viscosity away from the walls (
 $\unicode[STIX]{x1D707}_{c}<1$
) results in the opposite effect. The bursting frequency only is modulated while the stability of the
 $\unicode[STIX]{x1D707}_{c}=1$
edge state is preserved, namely all the orbits are periodic. Comparison to constant viscosity simulations shows that, even though some overall trend can be captured by rescaling
 $T$
, see also figure 20(b,c), there are significant quantitative as well as qualitative differences attributed to the effect of a wall-normal viscosity gradient, e.g. the stability of the edge state at
 $\unicode[STIX]{x1D707}_{c}=0.8$
and
 $\unicode[STIX]{x1D707}_{c}=0.88$
. The physical interpretation of increased
 $T$
is that the streaks instability takes more time to develop and that the two-dimensional base profile is more stable. In support of this statement, we performed a secondary stability analysis of the essentially two-dimensional (
 $z{-}y$
) velocity profile extracted when the streaks attain their maximum amplitude, at
 $t_{B}$
(see figure 1). Equations were discretised in the wall-normal direction with 97 Chebyshev modes. The fundamental secondary instability mode was expanded in 8 spanwise Fourier modes. The streamwise wavenumber was set to
 $\unicode[STIX]{x1D6FC}=2$
in order to match the wavelength in the DNS box. Velocities were made non-dimensional using the reference velocity at constant viscosity. The imaginary part of the unstable mode for constant and variable viscosity cases at
 $Re=2608$
is reported in table 1 and shows that the linear growth of the instability is faster if
 $\unicode[STIX]{x1D707}_{c}>1$
.
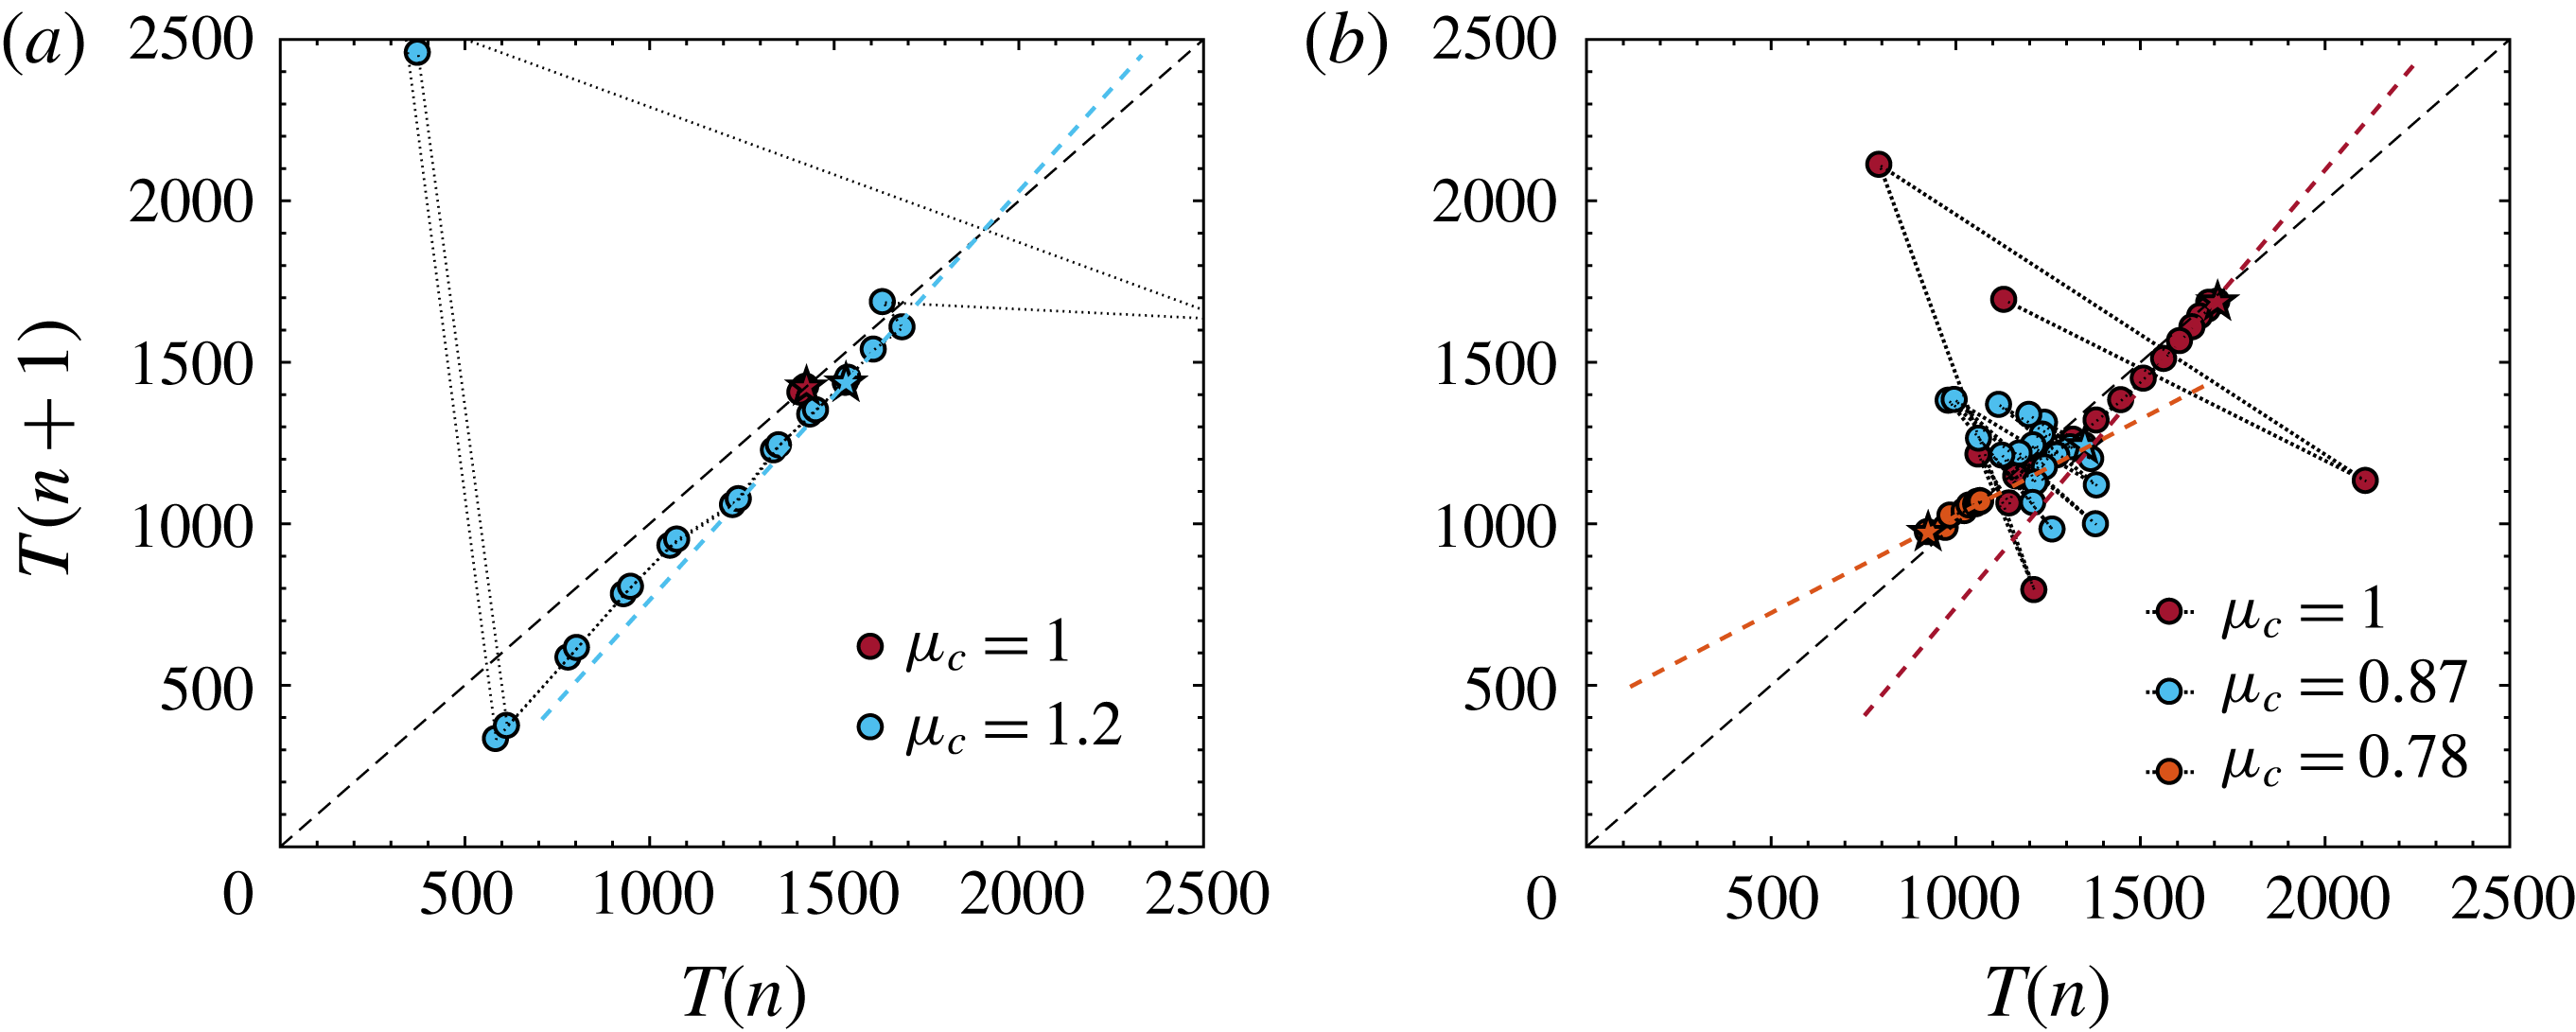
Particularly interesting from a dynamical system standpoint are the latter two scenarios as viscosity not only modulates the frequency of the edge state but additionally acts on its stability. That is conveniently assessed by means of the first return map in figure 21(a), in which every entry has on the horizontal axis the period of the regeneration cycle
 $n$
and on the vertical axis the period of the subsequent cycle
 $n+1$
. The first pair of periods,
 $n=1$
and
 $n=2$
, is indicated by a star; the following pairs are circles connected by a dotted line. Edge states that approach the
 $T(n)=T(n+1)$
line with a slope smaller than one are stable and eventually converge to a relative periodic orbit with a constant period. On the other hand, edge states characterised by a slope larger than one are linearly unstable and aperiodic (Khapko et al.
Reference Khapko, Duguet, Kreilos, Schlatter, Eckhardt and Henningson2014). At
 $Re=3000$
, the edge state for the constant viscosity flow is periodic with
 $T\simeq 1400$
. Increasing viscosity towards the centreline results in the loss of stability of the edge state that becomes chaotic, see figure 20(a) for the
 $\unicode[STIX]{x1D707}=1$
and
 $\unicode[STIX]{x1D707}_{c}=1.2$
cases. At
 $Re=3618$
, edge tracking for a flow with constant viscosity results in a chaotically bursting orbit, with periods fluctuating between
 $T=[750,2100]$
. Decreasing the centreline viscosity reduces the range of attained
 $T$
and, for small enough
 $\unicode[STIX]{x1D707}_{c}$
, results in a linearly stable edge state orbit with constant period for
 $\unicode[STIX]{x1D707}_{c}<0.84$
, see figure 20(c). Figure 21(b) reports the cases
 $\unicode[STIX]{x1D707}=1$
;
 $\unicode[STIX]{x1D707}_{c}=0.87$
, for which the edge state is chaotic as in case of constant viscosity;
 $\unicode[STIX]{x1D707}_{c}=0.78$
for which the edge state has a constant period.
First return maps of the inter-burst period for selected variable viscosity cases at (a)
 $Re=3000$
; and (b)
 $Re=3618$
. The star symbol indicates the first pair of periods calculated after discarding the initial transient; subsequent pairs are indicated by the circles and connected by a dotted line. The dashed lines indicate the threshold for stability
 $T(n)=T(n+1)$
and the slopes with which the edge states approach it.

Imaginary part of the unstable mode predicted by a linear secondary stability calculation over the two-dimensional velocity profile at the maximum streaks amplitude
 $t_{B}$
.

5 Conclusions
We have assessed how mean viscosity gradients affect edge state solutions and how the local threshold for transition to turbulence changes in the formers neighbourhood of the state space. We performed direct numerical simulations of nearly minimal flow units with a frozen symmetric viscosity profile and compared the perturbation kinetic energy of the edge states to those calculated for canonical flows with constant viscosity in the same domain. In order to exclude that our discussion is affected by the arbitrary choice of the reference scale for viscosity, we compared flow cases using two different definitions of the Reynolds number, respectively based on the viscosity at the wall and on its average value across the channel.
Consistently over a range of subcritical Reynolds numbers, decreasing viscosity away from the walls results in an edge state dynamics that is sustained on an overall lower perturbation kinetic energy level with a smaller driving force quantified in terms of streamwise pressure gradient, when compared to a flow with constant viscosity. The perturbation kinetic energy budget over one period of the edge state regeneration cycle shows that the production term becomes smaller and that the local production-to-dissipation ratio reduces compared to a constant viscosity flow, in support of the weaker velocity streaks found and in analogy with fully turbulent flows at low Reynolds number. The documented results indicate a decreased nonlinear stability limit for perturbations evolving in the proximity of the edge state. Opposite conclusions in terms of perturbation kinetic energy modulation are drawn if viscosity increases away from the walls. When comparing flows using a Reynolds number based on the average viscosity, we have shown that the applicability of a rescaling of the results of constant viscosity simulations qualitatively predicts the effect of variable viscosity on the streamwise flow structures while fails in terms of cross-flow motion, thereby highlighting the importance of fully accounting for the spatial non-uniformity of viscosity.
The results discussed in this paper suggest that the effect of spatially varying viscosity is a shift of the position of the edge state in the state space relative to the laminar attractor and turbulent saddle. This is sketched in figure 4, where the edge state moves closer to the laminar attractor in case viscosity decreases away from the walls, and vice versa. As a consequence, the stable manifold in the vicinity of the edge state is modulated accordingly (solid line). This state space modulation implies a reduction of the basin of attraction of the laminar state in the proximity of the edge state if viscosity is larger at the walls, and a reduced threshold for transition for perturbations that evolve in the neighbourhood of the edge state. The interpretation of the state space role of viscosity is the opposite for flows with lower viscosity at the walls. Due to the limitation of the edge tracking algorithm in describing the manifold away from its relative attractors (dashed line in figure 4), we can only speculate that the effect of viscosity discussed here applies also far from the edge state. In doing so, we base our intuition on previous results from linear stability theory, which predicts a stabilisation or destabilisation of the laminar flow consistent with the analysis presented (Wall & Wilson Reference Wall and Wilson1996; Sameen & Govindarajan Reference Sameen and Govindarajan2007), and on evidence of the increase of the Reynolds number at which nonlinear travelling waves appear in pipe flow of shear-thinning fluids (Roland et al. Reference Roland, Plaut and Nouar2010), although we stress the fact that the interaction between velocity and viscosity fluctuations in the latter case is substantially different from the one in a fluid where viscosity depends on temperature only.
Acknowledgement
E.R. gratefully acknowledges Y. Duguet for discussions. Financial support from the Linné FLOW Centre is gratefully acknowledged. The simulations were performed on resources provided by the Swedish National Infrastructure for Computing (SNIC) at HPC2N (Abisko).