
I. INTRODUCTION
Fe–6.5 wt% Si magnetic material is usually used as functional material for the choke coil, high-frequency transformer, high-frequency motor as well as magnetic shield due to almost zero magnetostriction, low eddy current, and hysteresis losses characteristics. Reference Wu, Fan, Wang, Li, Gan and Zhang1 However, owing to B2 (FeSi) and DO3 (Fe3Si) ordered phases in the alloy, extremely high brittleness at room temperature brings some difficulties for the rolling process. Reference Yu, Shin, Bae, Lee, Lee, Lee and Lavernia2 In recent years, various relevant techniques avoiding the brittleness of Fe–6.5 wt% Si alloy have been invented, such as electro–chemical reduction, physical chemical vapor deposition (PCVD), spray forming, etc. But using the methods above can bring a longer production cycle and a high production cost, based on the traditional rolling techniques, it is urgent to solve an existing technological problem in production. As a substitution of conventional cold rolling process, the warm rolling technique offers a new possibility of fabricating Fe–6.5 wt% Si sheet.
Previous studies have reported some brittle intermetallics with B2 and DO3 structures. Lin Reference Lin3 proposed the orientation relationship between the ferromagnetic spinel ordered (B2 + DO3) structure and ordered B2 structure with a′ Mn. Cava et al. Reference Cava, Botta, Kiminami, Olzon-Dionysio, Souza, Jorge and Bolfarini4 proposed the presence of B2 phase had an important effect on the texture development and the magnetic properties of spray-formed Fe–5 wt% Si alloy. Ma et al. Reference Ma, Li, Gerasimov, Wang and Sun5 also reported that the performance and weldability of Fe3Al were greatly influenced by the B2 → DO3 transformation. Fu et al. Reference Fu, Yang, Zhang and Xie6 reported the impacts of order degree and precipitated phases in Fe–6.5 wt% Si alloy, pointing out ordered phases changed its bending properties. Yang et al. Reference Yang, Li, Yang, Liang, Yang and Ye7 reviewed the ductility of Fe–6.5 wt% Si alloy fabricated as the form of wire could be improved significantly after ordered phases were reduced by deformation.
In previous work, we had reported that the brittleness and microhardness of Fe–6.5% Si sheets after hot rolling, Reference Li, Yang, Cai and Wang8 and conducted in-depth discussions on the annealing temperature and their impact in brittleness and microhardness, which built a foundation for further research on the transformation of B2 ordered phase. However, no systematic studies have yet been reported on the effects of rolling temperature on B2 and DO3 ordered phases in high silicon electrical steel. The present study aims to investigate XRD, SAED patterns, constitutive equation, and the antiphase domains (APDs) at different warm rolling temperatures, obtaining further knowledge about the ductility of Fe–6.5 wt% Si alloy.
II. EXPERIMENTAL PROCEDURES
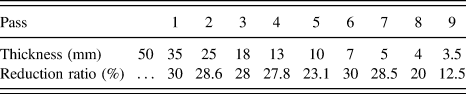
The Fe–6.5 wt% Si ingot was made using pure iron (99.5 wt%) and metallic silicon (99 wt%) in a high frequency vacuum induction furnace, consisting of (in wt%) 0.009 C, 6.57 Si, 0.008 Mn, 0.007 P, 0.003 S, and 93.43 Fe. The ingot was forged into 50 mm sheet at 1200–1250 °C, and hot rolled to 3.5 mm thickness by nine passes from 1150 °C to 900 °C on a Φ450 mm hot rolling mill, the total rolling reduction ratio was 93%, concretely speaking, the reduction ratio in the first 8 passes was 20–31%, and the reduction ratio in the last pass was 12.5%, cooled to room temperature in the air. The hot rolling schedule of Fe–6.5 wt% Si alloy was listed in Table I. After annealed at 900 °C for 1 h in a nitrogen atmosphere, they were cooled to room temperature in the air. Then the sheets with 3.5 mm thickness were warm rolled to 0.5 mm in thickness at 650 °C, 600 °C, 550 °C, 500 °C, and 450 °C, respectively.
The hot rolling schedule of Fe–6.5 wt% Si alloy.

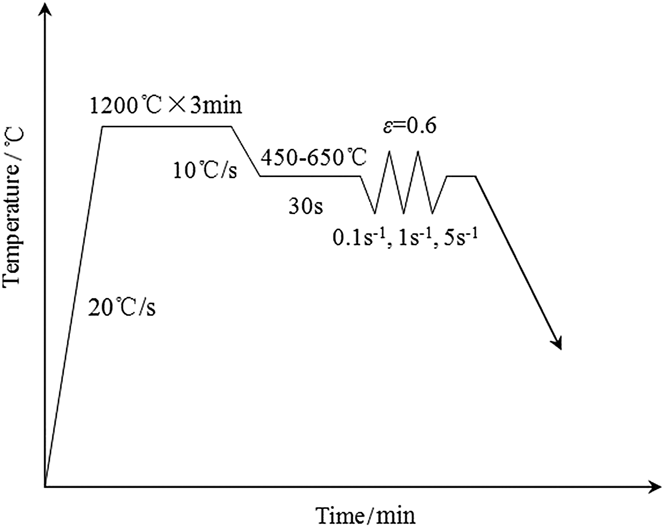
Figure 1 shows the thermomechanical processing schedule of Fe–6.5 wt% Si alloy. Compression samples with a dimension of φ 6 × 11 mm were cut from the hot rolled plate along longitudinal direction, and perpendicular to the rolling direction (RD). The thermomechanical processing was simulated with a MMS-300 servohydraulic thermomechanical simulator. Compression samples was heated to high temperature (1200 °C for 3 min) at a rate of 20 °C/s, followed by cooling at a rate of 10 °C/s to a deformation temperature of 650 °C, 600 °C, 550 °C, 500 °C, and 450 °C for 3 min. At this temperature range, a single roughing pass was conducted with a strain of 0.6 and strain rates of 0.1, 1, and 5 s−1, then the samples were cooled to room temperature in the air.
Thermomechanical processing schedule.

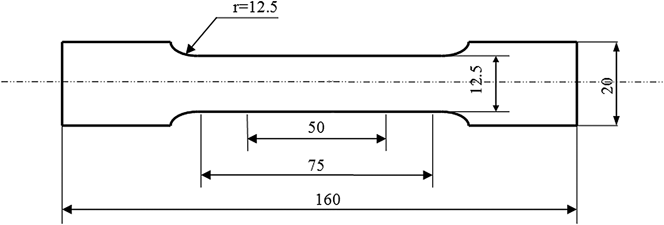
Figure 2 shows the geometry of tensile specimen on the RD. Tensile tests were carried out on a CMT5105-SANS electronic universal test machine (Data Sciences International Ltd., New Brighton, Minnesota) at room temperature. After the tensile fractures were cleaned using ultrasonic instrument, they were observed by an FEI Quanta 600 scanning electron microscope (SEM; FEI Company, Eindhoven, The Netherlands).
Geometry of tensile specimen (mm).

The microstructures of warm-rolled sheets on the longitudinal section were observed using a Leica DM 2500M optical microscope (Leica Company, Wetzlar, Germany), and the microhardness testing was performed on FUTURE-TECH's FM-700 microhardness tester (FUTURE-TECH Company, Tokyo, Japan). The structures of warm-rolled sheets with different rolling temperatures were quantitatively examined by the Bruker D8 X-ray diffraction (XRD; Bruker AXS GmbH Ltd., Karlsruhe, Germany). The selected area electron diffraction (SAED), the APDs, and the dislocation patterns were studied using Tecnai G2 F30 transmission electron microscopy (TEM; FEI Company), which was a direct approach to study the distribution of ordered phases. Two jet thinning specimens for TEM analysis were made by electropolishing in a solution of 8% perchloric acid and 92% ethanol at a voltage of 25 V at −20 °C.
III. RESULTS AND DISCUSSIONS
A. Microstructures and microhardness of warm-rolled sheets
Figure 3 presents the microstructures of warm-rolled sheets with different rolling temperatures. A few recrystallization grains observed in the warm-rolled sheet [Fig. 3(a)] were elongated along the deformation direction with a decreasing warm rolling temperature, whereas several significant shear bands occurred when the warm rolling temperature was 450 °C, as shown in Fig. 3(e).
Microstructures of warm-rolled sheets with different rolling temperatures: (a) 650 °C, (b) 600 °C, (c) 550 °C, (d) 500 °C, and (e) 450 °C.

It is found that the microstructure is closely related to the ductility characteristic of the alloy, especially, shear band has an important influence on activation of slip systems and strain hardening. Several shear bands existing in the warm-rolled sheet cause a high tangled dislocation density, and result in the change in hardness and a decline in ductility. In addition, the large grains are elongated along the RD, and finally a remarkably inhomogeneous microstructure occurs with a decreasing warm rolling temperature, which is one of the reasons for the reduced ductility during warm rolling. Therefore, the suitable rolling temperature is helpful for obtaining good ductile performance.
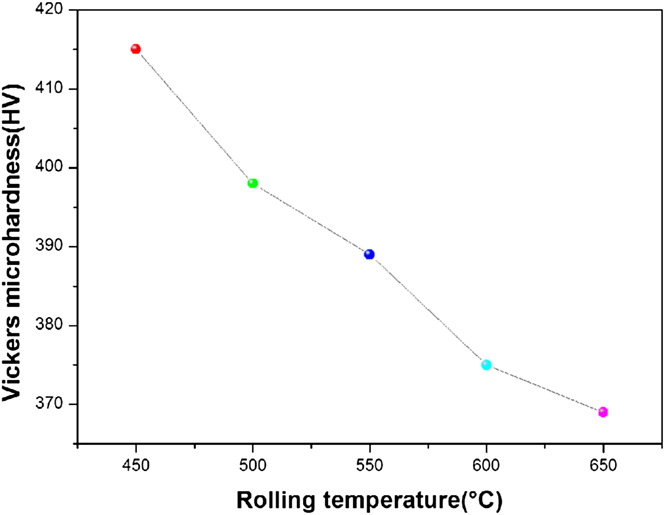
Figure 4 depicts the Vickers microhardness of warm-rolled sheets with different rolling temperatures (450–650 °C). Accompanied with an increasing warm rolling temperature, the values of Vickers microhardness in the warm-rolled sheets decreased monotonically, and they were 415, 398, 389, 375, and 369 HV, respectively.
Vickers microhardness of warm-rolled sheets with different rolling temperatures.
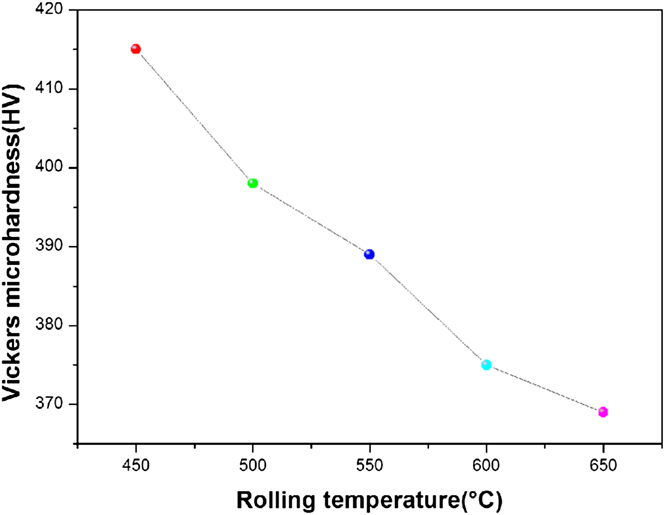
Owing to no α–γ phase transition in Fe–6.5 wt% Si alloy, Reference Ros-Yañez, Houbaert, Fischer and Schneider9 its ductility is mainly attributed to the total content of B2 and DO3 ordered phases and grain sizes. According to previous studies, the microhardness is greatly related to the work softening capability of alloy. Reference Rodríguez-Calvillo, Houbaert, Petrov, Kestens and Colás10 The recovery and partial recrystallization happened when warm rolling, resulting in a remarkably inhomogeneous microstructure, and all grains were elongated along the RD (Fig. 3). The suitable rolling temperature is conducive to obtaining recrystallization grains, Reference Barros, Ros-Yañez, Vandenbossche, Dupré, Melkebeek and Houbaert11 consequently, the values of Vickers microhardness gradually decreased with increasing warm rolling temperatures (Fig. 4). 650 °C warm-rolled sheet with the minimum value of Vickers microhardness indicated that the ductility of Fe–6.5 wt% Si alloy could be improved by higher warm rolling temperature (Fig. 4), which was attributed to the reduced B2 and DO3 ordered phases.
B. Stress–strain behavior
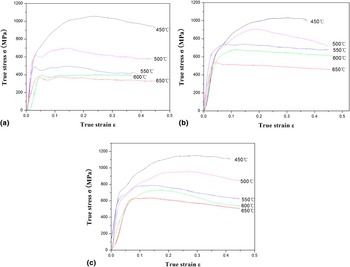
Figure 5 exhibits true stress–strain curves for warm-rolled sheets at strain rates of 0.1, 1, and 5 s−1. During warm compression deformation, under the same strain rate, the true stress increased with decreasing the deformation temperatures. Meanwhile, at the same deformation temperature, the true stress increased with strain rates.
True stress–strain curves for warm-rolled sheets with different rolling temperatures at different strain rates: (a) 0.1 s−1, (b) 1 s−1, and (c) 5 s−1.

In the processes of thermally activated deformation, the microstructure evolution is dependent on deformation temperature (T), strain rate (
 $\dot \varepsilon$
), and strain (ε). In thermal deformation, the activation energy is related to the warm deformation mechanisms through the Zener–Hollomon parameter. Zener–Hollomon parameter (Z) can be estimated through the following equations
Reference Li, Wang, Jing, Gao, Zhou, Yu and Li12
:
 $$Z = \dot \varepsilon \,\exp \left( {{Q \over {RT}}} \right) = A{\left[ {\sinh \left( {\alpha \sigma } \right)} \right]^n}\quad .$$
Based on the constitutive relation of deformation in a hyperbolic-sine form,
 $\dot \varepsilon$
can be calculated by:
 $$\dot \varepsilon = A{\left[ {\sinh \left( {\alpha \sigma } \right)} \right]^n}\exp \left( { - {Q \over {RT}}} \right)$$
 $${\rm{At\ the\ level\ of\ low\ stress,\ }}\dot \varepsilon = {A_1}{\sigma ^n}\exp \left( { - {Q \over {RT}}} \right)$$
 $${\rm{And\ at\ the\ level\ of\ high\ stress,\ }}\dot \varepsilon = {A_2}\exp \left( {\beta \sigma } \right)\exp \left( { - {Q \over {RT}}} \right)\quad ,$$
where A, A
1, A
2, β, and α are material constants, Q, R,
 $\dot \varepsilon$
, σ, T, and n represent the apparent activation energy of deformation, the gas constant, the strain rate, the flow stress, the deformation temperature, and a constant related to strain rate sensitivity, respectively. To show how difficult the rolling deformation was, the values of α, n, Q were calculated through different deformation temperatures and strain rates.
According to Eqs. (3) and (4), the natural logarithm of the above two values is obtained.
 $$\ln \dot \varepsilon = \ln \,{A_1} + n\,\ln \sigma - {Q \over {RT}}\quad .$$
 $$\ln \dot \varepsilon = \ln \,{A_2} + \beta \sigma - {Q \over {RT}}\quad .$$
According to the previous study, Reference Zhang, Jiang, Zhao and Shan13 a relationship exists between n and β,
 $$\alpha = {\beta \mathord{\left/ {\vphantom {\beta n}} \right. \kern-\nulldelimiterspace} n}\quad .$$
Compared with strain rate 0.1 s−1, the values of flow stresses at strain rates of 1, and 5 s−1 are tended to be stable. Taking
 $\dot \varepsilon$
values (1 and 5 s−1) and the highest peak stresses (536.85 and 631.23 MPa) at 650 °C in Eq. (5), then the n value (9.938) can be determined for different deformation temperatures. And taking
 $\dot \varepsilon$
values (1 and 5 s−1) and the highest peak stresses (1074.15 and 1106.54 MPa) at 450 °C in Eq. (6), then the value of β can be calculated to be 0.04969. According to the actual values of n and β, α can be determined to be 0.005.
After given compression temperature,
 $\exp \left( { - {Q \over {RT}}} \right)$
is a constant value. In Eq. (2), it can be established by taking the natural logarithm.
 $$\ln \dot \varepsilon = \ln A + n\ln \left[ {\sinh (\alpha \sigma )} \right] - {Q \over {RT}}\quad .$$
In Eq. (1), it can be established by taking the natural logarithm.
 $$\ln Z = \ln A + n\ln \left[ {\sinh \left( {\alpha \sigma } \right)} \right]\quad .$$
Using
 $\dot \varepsilon$
values (1 and 5 s−1) and the highest peak stresses (536.85 and 631.23 MPa) at 650 °C, as well as
 $\dot \varepsilon$
values (1 and 5 s−1) and the highest peak stresses (1074.15 and 1106.54 MPa) at 450 °C, the constant A in Eq. (9) can be calculated to be 3.384 × 10¹⁴ s−1. According to regression analysis method, the activated energy of warm deformation can be easily calculated to be 415.457 kJ/mol by averaging the Q values at different strain rates.
Thus,
 $\dot \varepsilon$
can be expressed as
 $$\dot \varepsilon = 3.384 \times {10^{14}}{\left[ {\sinh \left( {0.005\sigma } \right)} \right]^{9.938}}\exp \left( { - {{415457} \over {RT}}} \right)\quad .$$
It is well known that the activation energy Q reflects the difficult degree of metal deformation. To overcome certain potential barrier, when leapfrogging the interface, atoms need to get the help from the apparent activation energy of deformation, such as order–disorder transition, the growth of new phases, etc. As the most important factor in metallic material processing, the temperature has a significant effect on each link of production. In terms of affecting the deformation resistance, the deformation temperature is more evident among various kinds of affecting factors. On the one hand, rising temperature improves the thermal vibration amplitude of metal atoms and reduces slip resistance, thereby providing favorable conditions for plastic deformation, which makes the material soft. On the other hand, the reduction in ordering caused by rising temperature can improve the mobility of dislocations, which is helpful for dynamic recovery, and further softens the alloy.
C. Phase analysis
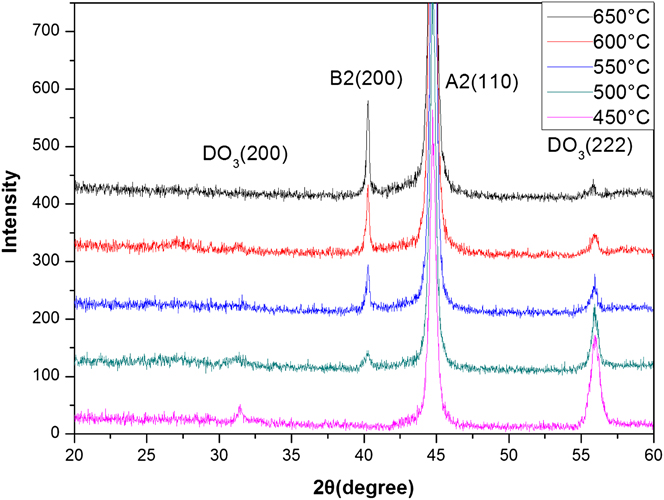
Figure 6 presents the XRD patterns of warm-rolled sheets with different rolling temperatures. The XRD results revealed that the minimum peak intensity of DO3 (222) reflection peak and the maximum B2 (200) reflection peak were found in 650 °C warm-rolled sheet, and the diffraction peak of B2 ordered phase was not detected at 450 °C rolling temperature.
X-ray diffraction patterns of warm-rolled sheets.
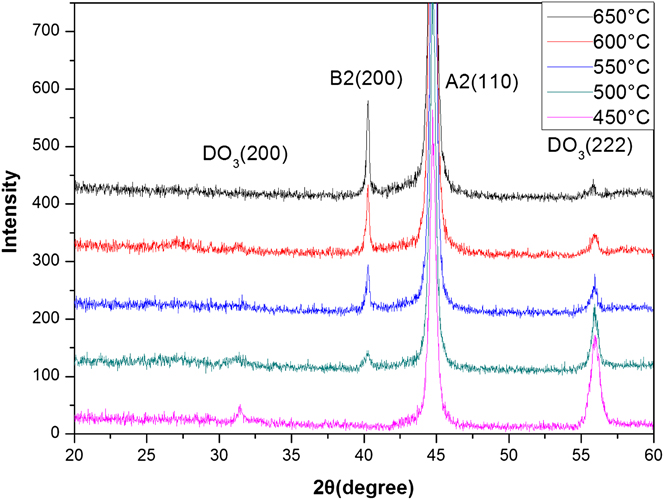
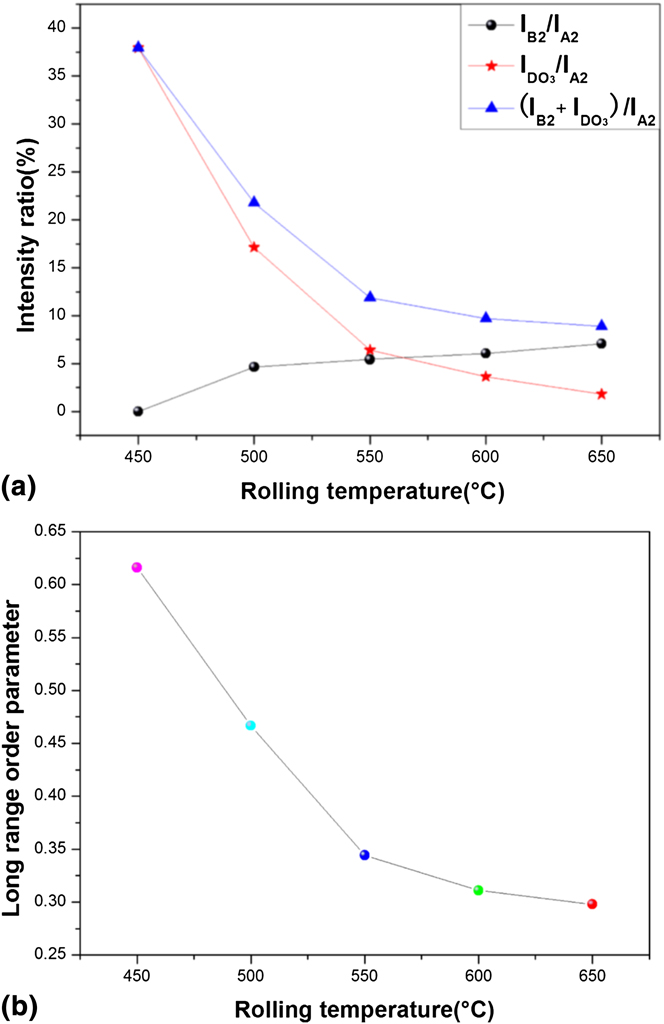
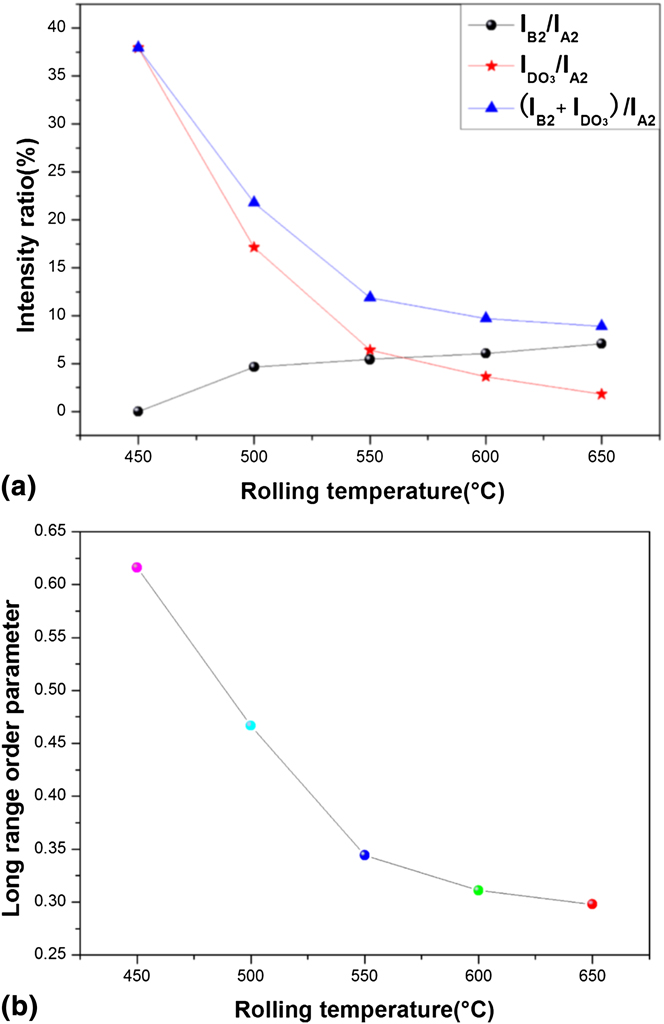
Figure 7(a) presents the variations of intensity ratios obtained using the XRD data. A quantitative analysis was conducted through calculating the intensity ratio of ordered phases to find some laws in the ductility of Fe–6.5% Si sheet. It could be seen that the maximum
 ${{{I_{{\rm{B}}2}} + {I_{{\rm{D}}{{\rm{O}}_3}}}} \mathord{\left/ {\vphantom {{{I_{{\rm{B}}2}} + {I_{{\rm{D}}{{\rm{O}}_3}}}} {{I_{{\rm{A}}2}}}}} \right. \kern-\nulldelimiterspace} {{I_{{\rm{A}}2}}}}$
and
 ${{{I_{{\rm{D}}{{\rm{O}}_3}}}} \mathord{\left/ {\vphantom {{{I_{{\rm{D}}{{\rm{O}}_3}}}} {{I_{{\rm{A}}2}}}}} \right. \kern-\nulldelimiterspace} {{I_{{\rm{A}}2}}}}$
values occurred in 450 °C warm-rolled sheet, and the maximum I
B2/I
A2 value existed in 650 °C warm-rolled sheet. The
 ${{{I_{{\rm{B}}2}} + {I_{{\rm{D}}{{\rm{O}}_3}}}} \mathord{\left/ {\vphantom {{{I_{{\rm{B}}2}} + {I_{{\rm{D}}{{\rm{O}}_3}}}} {{I_{{\rm{A}}2}}}}} \right. \kern-\nulldelimiterspace} {{I_{{\rm{A}}2}}}}$
and
 ${{{I_{{\rm{D}}{{\rm{O}}_3}}}} \mathord{\left/ {\vphantom {{{I_{{\rm{D}}{{\rm{O}}_3}}}} {{I_{{\rm{A}}2}}}}} \right. \kern-\nulldelimiterspace} {{I_{{\rm{A}}2}}}}$
values drastically declined in 450–550 °C temperature range, meanwhile, I
B2/I
A2 value had a steady rise in 450–650 °C, and the I
B2/I
A2 value was zero in 450 °C warm-rolled sheet. Figure 7(b) shows the long-range order (LRO) parameter of warm-rolled sheets with different rolling temperatures. The LRO parameter of warm-rolled sheets rapidly decreased with increasing warm rolling temperatures, and then began a slow decline within 550–650 °C.
(a) Variations of intensity ratios. (b) Long range order (LRO) parameter of warm-rolled sheets.
To quantify order degree, the LRO parameter is determined from the intensities of a superlattice reflection and a fundamental reflection. The LRO parameter is defined as Reference Su, Chao and Liu14 :
 $${\rm{LRO}} = {\left[ {{{{{{I^{\rm{S}}}} \mathord{\left/ {\vphantom {{{I^{\rm{S}}}} {I_{\rm{O}}^{\rm{S}}}}} \right. \kern-\nulldelimiterspace} {I_{\rm{O}}^{\rm{S}}}}} \over {{{{I^{\rm{f}}}} \mathord{\left/ {\vphantom {{{I^{\rm{f}}}} {I_{\rm{O}}^{\rm{f}}}}} \right. \kern-\nulldelimiterspace} {I_{\rm{O}}^{\rm{f}}}}}}} \right]^{{1 \mathord{\left/ {\vphantom {1 2}} \right. \kern-\nulldelimiterspace} 2}}}\quad ,$$
where I
S and I
f are the intensities of the superlattice and fundamental lines, respectively, after warm rolling, and
 $I_{\rm{O}}^{\rm{S}}$
and
 $I_{\rm{O}}^{\rm{f}}$
are the intensities of the same lines in a fully ordered specimen.
In the Fe–Si alloy phase diagram, the order–disorder transformation temperature ranges from 500 °C to 760 °C, and DO3 ordered phase is mainly formed at 500 °C. Reference Ros-Yáñez, Ruiz, Barros and Houbaert15 When the temperature is below 640 °C, a two-phase (B2 + DO3) region occurs. When the temperature range is 640–760 °C zone, a single B2 phase field exists in the alloy, above it, and enters in A2 disordered region. When hot-rolled sheets are annealed at 900 °C, a single A2 disordered phase exists in Fe–6.5 wt% Si alloy. In the process of air-cooling, B2 ordered phase can form nucleus and grow up, which makes A2 phase first transformed into B2 ordered phase. After entering the transformation region of DO3 ordered phase, B2 ordered phase is slowly changed into DO3 ordered phase and a sufficient B2 → DO3 process has been fulfilled, therefore DO3 phase can gradually increase and grow up fully.
When the warm rolling temperature was 450 °C, its LRO parameter was higher than 0.6 [Fig. 7(b)]. Such high LRO parameters further supported the observation corresponding to massive DO3 ordered phase (Fig. 6), and the changes of ordered phases were in accord with the transformation law of B2 and DO3 ordered phases. When the range of warm rolling temperatures was limited within 550–650 °C, raising rolling temperature had an impact on DO3 → B2 process, I B2/I A2 value was raised due to more B2 ordered phase in warm-rolled sheets [Fig. 7(a)], and there was a slow decline in the LRO parameter of warm-rolled sheets. This clearly shows that by contrasting with DO3 ordered phase, B2 ordered phase has a significant softening effect on Fe–6.5 wt% Si sheets.
D. Tensile test
Figure 8 shows SEM micrographs of tensile fractures with different rolling temperatures (450–650 °C). The intergranular fracture of 450 °C warm-rolled sheet exhibiting even and bright characteristics, and radial fringes converging in the crack source can be seen clearly in Fig. 8(a). As shown in Fig. 8(b), some cleavage cracks exhibiting river pattern passed through one grain into the next grain and propagated along the grain boundary successively, corresponding with the direction of the arrow for the crack propagation direction. At 550 °C rolling temperature, massive tearing ridges were taken as typical brittle transgranular fracture, could be seen on fracture surfaces [Fig. 8(c)]. The cracks extending along the matrix/ordered-phases interfaces formed the cleavage steps and tear ridges. As shown in Fig. 8(d), there existed different sizes of cleavage planes, and small sizes of cleavage planes in central area. At high rolling temperature, its tensile fracture exhibited quasicleavage fracture with dimples and tear ridges, and some shallow dimples occurred around the cracks, as shown in Fig. 8(e).
SEM micrographs of tensile fractures: (a) 450 °C, (b) 500 °C, (c) 550 °C, (d) 600 °C, and (e) 650 °C.

It is well known that the ferrite is BCC lattice, two
 ${{\mathord{\buildrel{\lower3pt\hbox{$\scriptscriptstyle\rightharpoonup$}}\over a} } \over 2}\left[ {1\bar 11} \right]$
and
 ${{\mathord{\buildrel{\lower3pt\hbox{$\scriptscriptstyle\rightharpoonup$}}\over a} } \over 2}\left[ {\bar 111} \right]$
partial dislocations existing on
 $\left( {011} \right)$
and
 $\left( {0\bar 11} \right)$
slip planes can meet on
 $\left( {001} \right)$
slip plane and merge into one perfect dislocation
 $\vec a\left[ {001} \right]$
, which is a spontaneous process reducing the elastic energy. The dislocations are formed through inserting an extra hemiatom plane into
 $\left( {001} \right)$
plane, consequently,
 $\vec a\left[ {001} \right]$
is perpendicular to
 $\left( {001} \right)$
plane. Therefore, with the whole reaction carrying through, it can be seen as a big dislocation formed by several dislocations inserting into
 $\left( {001} \right)$
plane, resulting in the initiation of microcrack.
The intersecting cleavage cracks along two parallel cleavage planes with different heights can form the cleavage steps. The microcrack propagates in a way of forming cleavage steps when the cleavage crack and screw dislocation meet. Numerous cleavage steps slip and meet each other along the prior crack, in the case of a big-enough step height, the river patterns can be observed by means of SEM. Therefore the river pattern is one of the important microcosmic basis for identifying whether there is a cleavage crack. When the stress concentration caused by different grain orientations was bigger than the cleavage strength, the initiation of cracks generated the river patterns [Fig. 8(b)], then the cleavage crack expanding along the river patterns could generate new cleavage cracks on grain boundaries. Based on it, the fracture source can be found in the opposite direction of rivers. When the distance between crack propagation was much greater than size of an atom, the type of step was formed between two cleavage cracks, called the tearing ridge [Fig. 8(c)]. Some shallow dimples occurring on the tensile fracture fully indicated the ductility of 650 °C warm-rolled sheet was greatly improved [Fig. 8(e)]. When the cleavage cracks propagate along grain boundary, a large misorientation existing between adjacent grains makes these cleavage cracks hindered on the grain boundary, meanwhile, there is the large stress concentration in stress tip. In this case, once the normal stress in tip reaches a critical cleavage normal stress, the cleavage fracture occurs.
E. APDs and the dislocation pattern
Figure 9 presents the TEM micrographs of warm-rolled sheets. DO3 ordered phase occurred in both 650 °C warm-rolled sheet and 450 °C warm-rolled sheet. As shown in Fig. 9(a), smoothly curved APDs approximate 300–500 nm could be clearly identified. By contrasting with 650 °C warm-rolled sheet, in the case of 450 °C warm deformation, its APDs were cut by a large number of dislocations, distributed by discrete during warm deformation, thereby reducing APD sizes and order degree. According to the diffraction pattern in the [011] zone axis, the enhanced SAED intensity of B2 and DO3 ordered phases was accompanied with the reducing of rolling temperature.
TEM micrographs of warm-rolled sheets: (a) dark field image obtained using (200) diffraction spot at 650 °C, (b) SAED patterns parallel to the [011] zone axis at 650 °C, (c) dark field image obtained using (200) diffraction spot at 450 °C, (d) SAED patterns parallel to the [011] zone axis at 450 °C and (e) schematic diagram. The solid circle represents A2, B2, and DO3, the dotted circle represents B2 and DO3, and the square represents DO3.

Based on the theory of reciprocal lattice structure factors, the {h k l} (h + k + l = 2n, n is an odd number) diffraction spot of DO3 ordered phase and the {h/2 k/2 l/2} diffraction spot of B2 ordered phase will overlap, such as {200}, {220}, and {222}. When n is an even number, three diffraction spots of DO3, B2 ordered phases, and A2 disordered phase can overlap, such as {400}, {422}, as well as{444}. According to the principle of electron diffraction, the whole odd diffraction spots of DO3 ordered phase are characterized with {111} and {311}. As is the present case, SAED patterns for phase identification are in accord with XRD measurements performed on warm-rolled sheets with different rolling temperatures.
Figure 10 shows the dislocation patterns of warm-rolled sheets at different rolling temperatures. In the bright-field images, the superdislocation density gradually increased with decreasing warm rolling temperatures. The change in microhardness with warm rolling temperature was attributed to the impact of the dislocation density and the order–disorder transformation controlled by rolling deformation.
Dislocation patterns of warm-rolled sheets at different rolling temperatures: (a) 650 °C, (b) 600 °C, (c) 550 °C, (d) 500 °C, and (e) 450 °C.

Ordered phases (B2 and DO3) have been argued to act as a source causing the brittleness of alloy, however the key roles of APDs in rolling deformation are often ignored. When the warm rolling temperature is high, the complete APDs can be retained due to the low-density dislocation motion. Consequently, as the warm rolling temperatures decrease, the high-density dislocations will occur within APDs and result in a decrease in APD sizes during warm deformation, thereby reducing the total content of ordered phases and order degree, called strain-induced disordering. Reference Koizumi, Allen, Ouchi and Minamino16 On the one hand, the existence of high density dislocation defect will hinder the formation of ordered phases in the process of warm deformation, Reference Li, Liang, Yang, Ye, Lin and Xie17 effectively eliminating part of the work hardening, which makes the alloy soften effectively. On the other hand, massive shear bands existing in warm-rolling sheets cause the increase of the dislocation density, and result in the work hardening during warm rolling. In essence, the brittleness of Fe–6.5 wt% Si alloy is dominated by APDs and the total content of ordered phases in the process of warm deformation.
A large number of dislocation slip during rolling deformation can not only improve the increase of dislocation density, but gradually change A2 ordered structure into B2 or DO3 disordered structure, and result in the decrease of order degree. In this case, such disordered structure is unstable structure. After experiencing certain degree of warm deformation, the ordered alloy contains the stored energy caused by the increase of dislocation density, in addition to improving antiphase boundary energy (APB energy) in the disordering process. And APB energy is an important factor in alloy material's resistance to deformation, and also affects the way deformation occurs.
In general, the deformation mechanism is a process of obvious increase in APB energy due to the superdislocation slip. For B2 crystal structure,
 ${{a\left\langle {111} \right\rangle } \mathord{\left/ {\vphantom {{a\left\langle {111} \right\rangle } 4}} \right. \kern-\nulldelimiterspace} 4}$
dislocation slip at the {110} planes can totally change the neighboring relationship between Fe and Si atoms, and produce APBs with energy γ1. However, DO3 structure with
 ${{a\left\langle {111} \right\rangle } \mathord{\left/ {\vphantom {{a\left\langle {111} \right\rangle } 2}} \right. \kern-\nulldelimiterspace} 2}$
dislocation slip can produce APBs with energy γ1 and energy γ2. When DO3 structure is transformed into B2 structure, γ2 will gradually decrease, close to zero finally. By contrasting with DO3 ordered phase, the resistance of dislocation motion in B2 phase is obviously much smaller, in other words, its dislocations have a higher movability. So, more B2 phase as much as possible is beneficial to the decrease of order degree and softening behaviors of Fe–6.5 wt% Si alloy. Therefore, in iron-based order solid solution, its softening behavior is in contrast to the conventional metal deformation.
F. Mechanism of A2–B2–DO3 vacancy diffusion
The structure transition of A2–B2–DO3 is closely related to rolling temperature, so the warm-rolling process is adopted to eliminate the brittleness. The main deformation processing is completed in A2 disorder zone during hot rolling, therefore more disordered structures can be obtained after annealing. Reference Jung and Kim18 Then annealed sheet containing a higher proportion of disordered structures is rolled in B2 formation temperature range during warm rolling, and the dislocation slips will continue to destroy the sizes of APDs, thereby reducing the order degree.
Regarding the existing literature, Reference Naito, Nakagawa, Machida, Shigematsu, Nakao and Sudoh19 the difference of energy between APBs region and matrix will be narrowed due to the destruction of APDs, and B2 → DO3 process will be influenced by the change of rolling temperatures. The changes of A2–B2–DO3 structures are found in the following explanation.
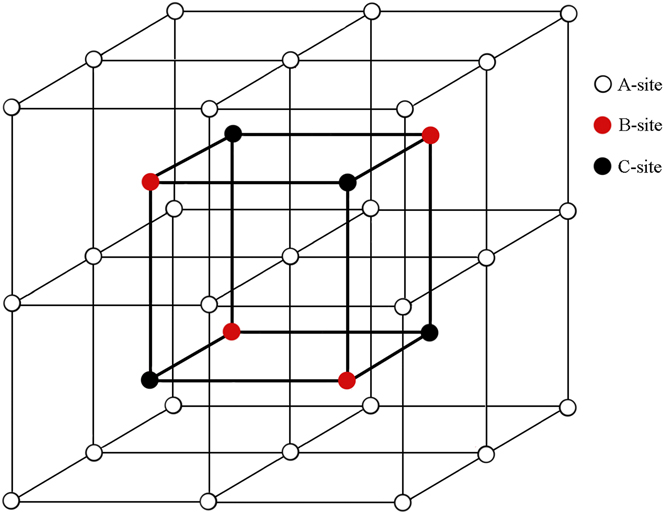
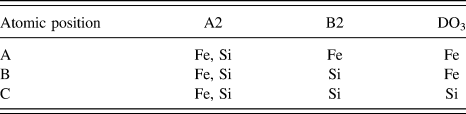
Figure 11 depicts the 3D structural schematic of A2, B2, and DO3 phases in Fe–6.5 wt% Si alloy. The atomic occupation of A2, B2, and DO3 structures is listed in Table II. It is described that in accordance with stoichiometry, the random combinations of large unit cells in various positions constitute A2 disordered structure. In the order–disorder transformation, the second order phase transition occurs in the A2 disordered structure, thereby forming different atoms matching B2 ordered phase in the nearest-neighbor position. Reference Kim, Pan, Lin, Wang, Lin and Chen20 Further lower the temperature, DO3 ordered phase will be precipitated in the next-nearest-neighbor position.
3D structural schematic of A2, B2, and DO3 phases.
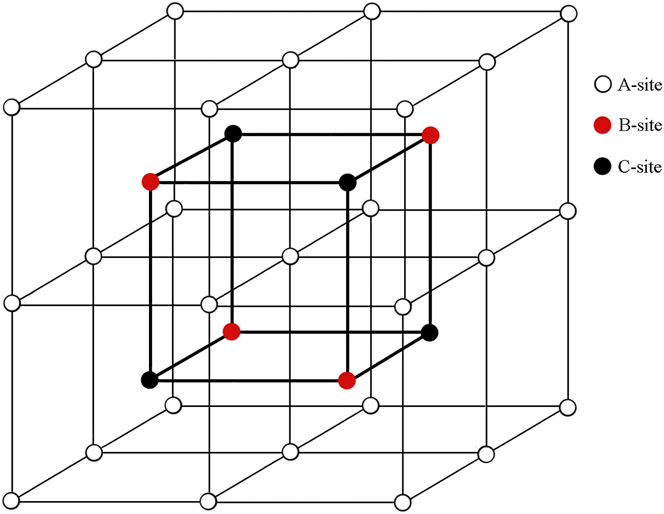
Atomic occupation of A2, B2, and DO3 structures.

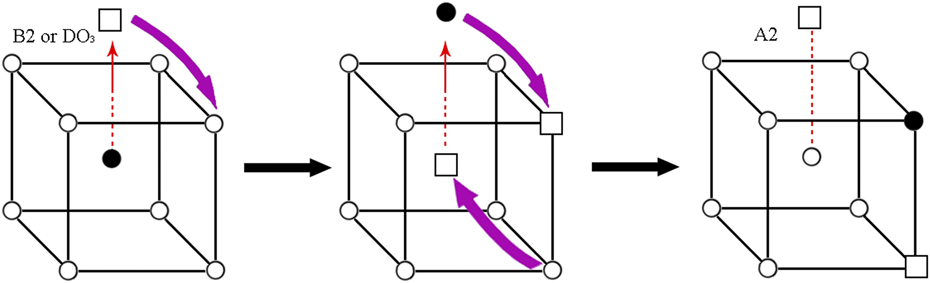
The vacancy diffusion of Fe and Si atoms is important to understand the order–disorder transformation because the temperature plays a significant role in guaranteeing the decrease of brittleness during warm rolling. The vacancy diffusion also attempts to establish the interaction between the dislocation motion and Fe–Si covalent bond, as well as the solution strengthening effect of Si element. To elucidate this, the mechanism of A2–B2–DO3 vacancy diffusion is found in the following explanation.
Figure 12 depicts the schematic of order–disorder transformation in Fe–6.5 wt% Si alloy. Fe atoms can diffuse into Si nanocrystals due to high reactivity of Fe with Si at elevated temperatures. Random atomic mixing leads to the formation of A2 structure in Fe–Si solid solution, so Fe and Si atoms randomly occupy the bcc lattice sites. When lowering the temperature, a metastable B2 phase is formed, and further ordering will result in the appearance of DO3 phase. The diffusivity of Fe atoms is higher than that of Si atoms in Fe–Si intermetallic compound, especially in B2 phase, this strong diffusibility will greatly affect the B2–DO3 transformation, thereby affecting its hardness and brittleness.
Schematic of order–disorder transformation in Fe–6.5 wt% Si alloy. Fe-atoms Si-atoms vacancies.

Liang et al. found Reference Liang, Shang, Wang, Wang, Ye, Lin, Chen and Liu21 that the Fe–Si pair had the smallest bond length while the Si–Si pair had the largest one. In addition, the bonding strength with the same bonding length was examined as follows: Si–Si > Fe–Fe > Fe–Si, used to predict the thermodynamic properties of Fe–Si compounds based on the transferable force constant model.
The diffusion behavior of Fe and Si atoms affects the stability of ordered phases in Fe–Si alloy. The high diffusivity of Fe atom has close links with the heat vacancy concentration and its low diffusion barrier. Seeing from the micro view, the heat vacancy concentration is related to the compression of Fe–Fe bond and the tensile of Fe–Si bond, Reference Fan, Zhong, Xu, Shen, Zheng and Ren22 which is prone to cause the decrease of enthalpy formed by vacancy and the increase of heat vacancy concentration in B2 or DO3 phase. The symmetrical obstacle can reduce the hindering functions for the diffusion of Fe atoms, whereas Si atoms can jump from their original position to the nearest-neighbor position in a very short time, to some extent, it will be more conducive to the spread of Fe atoms.
The dislocation slipping will encounter more resistance, such as lattice resistance. In the crystal, when the dislocations with a Burgers vector move, the obstacle of dislocation motion is formed by the higher energy between symmetric positions. Then, it needs a force to overcome lattice resistance and across the barrier, and this force is called Peierls–Nabarro force. Reference Chen, Shi, Tian, Ruan, Li, Pan and Lu23 In Fe−6.5 wt% Si alloy, the dislocation motion is difficult due to the existence of Fe–Si covalent bond and the solution strengthening effect of Si element, so the alloy becomes both hard and brittle.
The inherent brittleness in warm-rolling sheets results from the combined effect of APDs and B2, DO3 ordered phases. On the one hand, as the rolling temperatures decrease, APDs are cut by massive dislocations during warm rolling and result in the decrease of order degree. On the other hand, when the lower rolling temperature is adopted, a mass of B2, DO3 ordered phases occur in the matrix, which leads to the improvement of order degree. In general, its brittleness is dominated by the total content of ordered phases, and relatively high rolling temperature will be more conducive to the rolling deformation, which is validated by the LRO parameter.
IV. CONCLUSIONS
The ordered phases (B2 and DO3) in Fe–6.5 wt% Si magnetic material are investigated under different warm rolling temperatures. It is exhibited that the LRO parameter of warm-rolled sheets rapidly decreases with increasing warm rolling temperatures, when the range of warm rolling temperatures is limited within 550–650 °C, and then begin a slow decline. Meanwhile, the values of microhardness in the warm-rolled sheets decrease monotonically. Accompanying with an increase of warm rolling temperatures, the appearance of some shallow dimples indicates the intergranular fracture that can be transformed into quasicleavage fracture, which makes the ductility of warm-rolled sheets greatly improve. In the case of different warm rolling temperatures, the brittleness of Fe–6.5 wt% Si alloy is attributable to a contribution combining the sizes of APDs with the total content of ordered phases. When the relatively lower warm rolling temperature is adopted, the larger APDs are cut by a large number of superdislocations, changed into smaller sizes, reducing the order degree. However, more B2, DO3 ordered phases occur in the matrix, thereby significantly improving the long range order parameters of warm-rolled sheets. In general, its brittleness is dominated by the total content of ordered phases, and relatively high rolling temperature will be more conducive to the rolling deformation. As compared to DO3 ordered phase, B2 ordered phase has a significant softening effect on Fe–6.5 wt% Si sheets.
ACKNOWLEDGMENTS
This work was supported by the National Natural Science Foundation Project (Grant No. 51174057, 51274062), the Specialized Research Fund for the Doctoral Program of Higher Education of China (Grant No. 20130042110040), and the Fundamental Research Funds for the Central Universities (N130607002).