I. INTRODUCTION
Our skin is the physical barrier through which we interact with surroundings. The effort to create an artificial skin with human-like sensory capabilities is motivated by the possibility of such large, multi-sensory surfaces being highly applicable for autonomous artificial intelligence (e.g., robots). Endowing robots with sensing capabilities could extend their range of applications to include highly interactive tasks, such as caring for the elderly, and sensor skins applied on or in the body could provide an unprecedented level of diagnostic and monitoring capabilities.Reference Mallory, Alex, Benjamin, T Jeffrey and Bao1–Reference Vladimir, Michael and Sigurd4 To achieve such high sophistication in its sensing capabilities, several different types of highly specialized sense receptors are embedded within artificial skin.
The contact pressure is important information in different kinds of information interact with the target or surroundings.Reference Shimojo, Namiki, Ishikawa, Makino and Mabuchi5,Reference Yang, Cheng, Chang, Tsao, Yang, Shih, Chang, Chang and Fan6 To develop artificial skin interfaces with fully distributed pressure sensing, Polymer composites containing carbon-based fillers have received considerable attention in both academic research and industry because of their high conductivity, low weight, ease of processing, and so on.Reference Yang, Cheng, Chang, Tsao, Yang, Shih, Chang, Chang and Fan6–Reference Park, Lee, Hong, Lee, Ha, Jung, Lim, Kim and Ko10 There are mainly five types of carbon fillers: carbon black (CB), graphite (G), carbon fibers, carbon nanotubes (CNTs), and graphene nanoplatelets (GNPs), and each type of carbon filler have its own characteristics. For example, CB is cheap, but its percolation threshold is usually high, which could lead to distortion of some properties (e.g., the mechanical properties). Although the percolation threshold of GNPs is very low because of their inherent conductivity and high aspect ratio, the high cost hinders their large scale application. The use of a combination of different carbon fillers would be a good way to get balanced properties and cost. In fact, some polymer-based composites containing two different carbon fillers have been investigated, and a dramatic increase in electrical conductivity has been reported.Reference Li, Dichiara and Bai11–Reference Clingerman, Weber, King and Schulz15 It is believed that the two different types of carbon fillers can form cooperative conductive networks in which one filler act as long distance charge transporters and the other filler serves as an interconnection by forming local conductive paths.Reference Thongruang, Spontak and Balik14,Reference Clingerman, Weber, King and Schulz15
At present, functionalized graphene is the most commonly used method to improve its performance in the polymer.Reference Tian, Huang, Wang, Li, Liu, Liu and Zhang16–Reference Wang, Huang, Ma, Liu, Liu and Zhang18 However, this method is somewhat undermined inherent conductivity of graphene, which makes the changes in electrical property of graphene/polymer composites not significant. The studies about improving the graphene properties in the polymer by adding other fillers have been reported rarely. In an ongoing project aimed at the preparation of conductive polymer composites using mixed conductive fillers, we found that the addition of a small amount of GNPs and CB filled polymers considerably lowers the percolation thresholds. Thus in this work, the synergetic effect of mixed GNPs and CB in GNPs/CB/SR was investigated, and the mechanical and electrical characteristic of GNPs/CB/SR for high performance flexible pressure sensor was researched in detail. The pressure-sensitive array based on GNPs/CB/SR has been tested. The results show that the size of applied loading on the pressure sensor array can be recognized accurately.
II. EXPERIMENTAL
A. Materials
The GNPs (Chengdu Organic Chemicals Co., Ltd., Chengdu, China) was used as main conductive filler. For GNPs, the purity is >99.5 wt%, the thickness is 4–20 nm, the diameter is 5–10 μm, and the number of layers is <30. High structure CB (SPC Chemical Company, Stockholm, Sweden) without any chemical functional groups attached was used as secondary conductive filler. For CB, the pour density is 128 g/dm3, the iodine adsorption is 1080 mg/g, the CTAB surface area is 1100 m2/g, and the dibutyl phthalate (DBP) absorption is 380 mL/100 g. Room temperature vulcanized liquid silicone rubber (RTV-SR, Sichuan Chenguang Engineering Design Institute, Chengdu, China) was used as a matrix.
B. Preparation of conductive composites
The conductive SR composites filled with different kinds of single fillers and mixed fillers at various filler contents was prepared by a liquid mixing method. First, 3 mL naphtha was used as solvent to mix conductive filler with different fractions thereby mechanical stirring for 30 min and sonication for 15 min to obtain a well-dispersed filler suspension solution. Second, the SR was added into the filler suspension solution. After 1 h of high-shear magnetic mixing with a rotational speed of 3000 rpm at room temperature, the viscous mixture was modeled onto the cylinder for 72 h and the solvent was evaporated. Finally, the samples were manufactured into square (17 mm × 17 mm × 2 mm) at 25 °C.
C. Apparatus
Testing apparatus of pressure experiment is shown in Fig. 1. Two copper plates used as electrodes were placed on the worktable. The area of electrode was a little larger than that of the sample to keep a good electrical contact in the process of compression, and silver paint was used to ensure good contact of sample surface with the electrodes to reduce the contact resistance. The pressure experiment was provided by digital force gauge with the precision of 0.003 MPa. The resistance was measured directly using a digital multimeter (HP-3458A; Agilent, Santa Clara, California). The microstructures of samples were examined by a field emission transmission electron microscope (TEM, JEM-2100F; JEOL Ltd., Akishima, Japan).
The sketch of testing apparatus of pressure experiment.

III. RESULTS AND DISCUSSION
A. Micro-structure of conductive composites
The dispersity of GNPs and GNPs/CB in solvent observed under optical microscope in the same magnification, is shown in Fig. 2. It is observed that GNPs is easy sediment at the bottom of the solution. But it can be observed that GNPs/CB with same concentration evenly dispersed in solvent and shown a better colloidal stability in test tube. In general, the dispersity of filler in solvent was affected by filler–filler interactions and fillers–solvent interactions. Because GNPs have 2D structures and large surface area, the large surface van der waals forces of GNPs will result in GNPs reunion. When the granular CB was mixed with GNPs, it can construct hierarchical GNPs/CB architecture to inhibit the stacking of GNPs resulting in good colloidal stability. Photographs show the synergetic effect of CB and GNPs on the dispersity, the addition of CB can improve the stability of GNPs in naphtha effectively.
The dispersity of conductive fillers in solvent: (a) GNPs; (b) GNPs/CB.
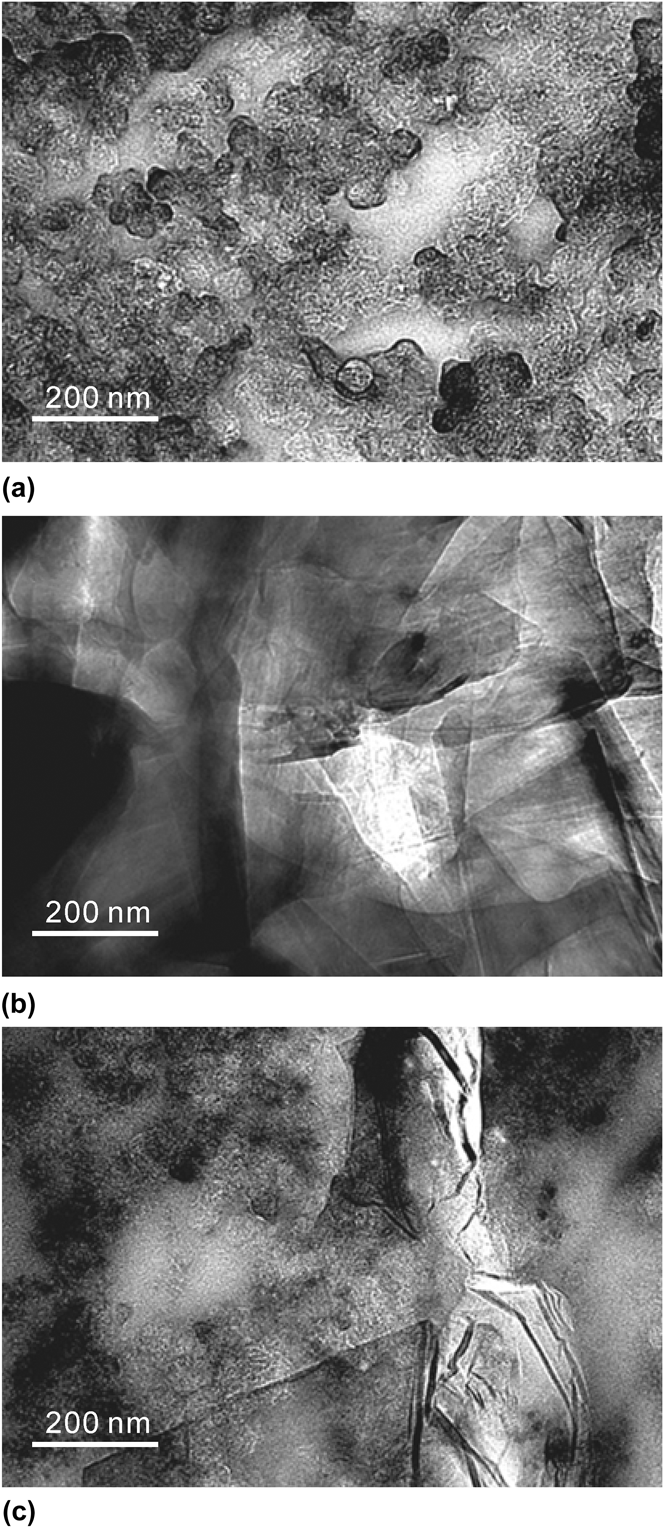
TEM was used to investigate the morphology of the fractured surfaces of conductive composites. The fractured surfaces exhibited dispersibility of GNPs and CB in matrix as shown in Fig. 3. The image of CB/SR shows hybrid composites that CB particles distributed throughout matrix at nanoscale. The image of GNPs/SR shows nonuniform dispersion due to aggregated GNPs. The black region in image shows the reunion of graphene. The image of GNPs/CB/SR shows spherical CB particles are incorporated into laminar GNPs, both the dispersion of CB and the exfoliation of GNPs were improved. The CB particles were dispersed on the surface of GNPs homogenously and filled in the gaps between graphene sheets to prevent the aggregation of GNPs. At the same time, CB prevents the settling of GNPs in matrix, and this means CB can improve the dispersion of GNPs.
TEM images of SR filled by: (a) CB; (b) GNPs; (c) GNPs/CB(GNPs:CB = 2).
B. Percolation characteristic of conductive composites
The percolation theory shows that the conductive mechanism of conductive composites is related to the volume fraction of filler.Reference Zheng, Shen, Li, Song and Yi19–Reference Hussain, Choa and Niihara22 When the volume fraction of conductive filler is lower than the critical volume fraction, the gaps between CB particles are large and the conductive path is hard to form, the space between congeries is large and the electronics between particles is hard to generate transition, which leads to that conductive composites show a high resistivity. Along with the increase of conductive filler, the volume fraction of filler is within percolation zone, the conductive fillers gather link and start forming conductive path, and the space between congeries continuously decrease. As a result, the conductivity of conductive composites sharply increases, and electric conductivity will be mainly caused by electron tunneling effect. When the volume fraction of filler is within conductive zone, the conductive filler content would exceed percolation threshold value, the gaps between conductive fillers would be further shorten. Therefore, the congeries link gradually stabilizes and the quantities of conductive path basically reach the maximum value, and the electron tunneling effect and the internal electronic conduction of conductive fillers will coexist.
On the basis of fact that the two carbon fillers form synergistic conductive networks, a model was proposed by extending the excluded volume theory, which was originally proposed by Balberg et al.Reference Balberg23,Reference Celzard, McRae, Deleuze, Dufort, Furdin and Marêché24 For systems containing one type of object to systems containing two types of fillers, the excluded volume is the volume around the object into which the center point of an identical object is prohibited if the two are not to overlap. According to the excluded volume theory, the number of objects per unit volume at percolation, q P, is inversely proportional to the excluded volume V <ex> of one of objects, that is
 $${q_{\rm{p}}} \propto {1 \over {{V_{{\rm{ \lt ex > }}}}}}\quad .$$
The excluded volume theory has been used for single-filler filled systems to predict the percolation thresholds of G,Reference Celzard, McRae, Deleuze, Dufort, Furdin and Marêché24 CNTs,Reference Ounaies, Park, Wise, Siochi and Harrison25 and CBReference Pike and Seager26,Reference Seager and Pike27 where the three conductive fillers were considered to be sphere, disk, and so on. For systems containing two different types of conductive fillers A and B, a model built starting from Eq. (1) is proposed by Yu as followsReference Sun, Bao, Guo and Yu28
 $${{{m_{\rm{A}}}} \over {{P_{{\rm{c,A}}}}}} + {{{m_{\rm{B}}}} \over {{P_{{\rm{c,B}}}}}} = 1\quad ,$$
where m A and m B are the weight fractions of fillers A and B, respectively. P c,A and P c,B are the corresponding percolation weight fractions when A and B are used alone. Figures 4(a), 4(b), and 4(c) show the resistivity of CB/SR, GNPs/SR, and GNPs/CB/SR(GNPs:CB = 2) at various filler contents, respectively. It gives P c,CB = 6.2%, P c,GNPs = 3%, and P c,GNPs/CB(GNPs:CB = 2) = 4.1%, and it shows the percolation threshold of CB/SR, GNPs/CB/SR(GNPs:CB = 2), and GNPs/SR decreases in turn. This feature reveals the participation of GNPs in the formation of conductive CB networks, because neither the amount of GNPs nor the amount of CB alone can make the material conductive at percolation of mixed fillers. That is to say, compared with the CB/SR, the addition of GNPs in GNPs/CB/SR can enhance the electrical conductivity. The reasons behind this observation are 2-fold: (i) the poor contact of the CB particles due to their spherical shape along with a low aspect ratio of unity makes it difficult for them to form conducting networks in polymer (3–5, 9); (ii) the inherently lower conductivity of CB than GNPs. The measured bulk electrical conductivity of the CB particles was 0.68 (±0.12) S/cm, which was only one-thousandth that of GNPs (71 ±25 S/cm). The formation of synergistic conductive network of GNPs and CB can also be evidenced by comparing the resistivity of mixed-filler systems with the sum of the resistivity of the corresponding single-filler systems at fixed total filler contents. For example, the resistivity of GNPs/SR at 4 wt% and that of CB/SR at 2 wt% is about 103 Ω·cm and 1014 Ω·cm, respectively, whereas the resistivity of GNPs/CB/SR(GNPs:CB = 2) at 6 wt% is 101.4 Ω·cm, a decrease of over 12 orders of magnitude from the sum of the values obtained with 4 wt% of GNPs and 2 wt% of CB.
The resistivity of conductive composites filled with different kinds of fillers at various filler contents: (a) CB/SR; (b) GNPs/SR; (c) GNPs/CB/SR(GNPs:CB = 2); (d) GNPs/CB/SR.
According to Eq. (2), combining with P c,GNPs = 3% and P c,CB = 6.2%, the approximate demarcation between insulation zone and percolation zone of GNPs/CB/SR is
 $${{{m_{{\rm{GNPs}}}}} \over {0.03}} + {{{m_{{\rm{CB}}}}} \over {0.062}} = 1\quad .$$
As it shown in Figs. 4(a), 4(b), and 4(c), the minimum volume fraction which makes CB/SR, GNPs/SR, and GNPs/CB/SR(GNPs:CB = 2) within conductive zone is 7.4, 4.1, and 5.5 wt%, respectively. So that the demarcation between percolation zone and conductive zone of GNPs/CB/SR can be approximately considered as the connection line among the mentioned three points. Combining with the approximate demarcation among insulation zone, percolation zone, and conductive zone, the 2D approximate percolation characteristic of GNPs/CB/SR is shown in Fig. 4(d). Assuming the resistivity of conductive composites on the same demarcation is equal, according to Fig. 4(d), the 3D approximate percolation characteristic of GNPs/CB/SR is shown in Fig. 5.
The 3-D approximate percolation characteristic of GNPs/CB/SR.
C. Piezoresistive characteristics of conductive composites
Figure 6 shows the repeatability and resistance creep behavior of negative pressure coefficient of resistance while GNPs/SR at 4.1 wt% and GNPs/CB/SR(GNPs:CB = 2) at 5.5 wt%. It is shown that GNPs/CB/SR(GNPs:CB = 2) at 5.5 wt% have a high electrical stability and recover better, and also has a weak resistance creep. During the process of loading (including instantaneous compression, creep), the conductive network is changed by the movement of SR segments which changed with the uniaxial size, leading to the changed electrical resistance of conductive composites. That is to say, the addition of CB makes SR segments in GNPs/CB/SR changed, as a result, the GNPs/CB/SR show a good mechanical characteristic under the external pressure. The positive temperature coefficient of resistance of GNPs/CB/SR(GNPs:CB = 2) is shown in Fig. 7. Compared with the GNPs/CB/SR(GNPs:CB = 2) at 5.5 wt% which is within percolation zone, the GNPs/CB/SR(GNPs:CB = 2) at 4 wt% is within conductive zone and its resistivity has a low sensitivity to temperature. Moreover, due to the thermal expansion coefficient of samples are little (≈10−4), thus the GNPs/CB/SR(GNPs:CB = 2) at 5.5 wt% has a good temperature stability.
The piezoresistive characteristics of GNPs/SR at 4.1 wt% and GNPs/CB/SR(GNPs:CB = 2) at 5.5 wt%: (a) Repeatability; (b) Resistance creep behavior.
The positive temperature coefficient of resistance of GNPs/CB/SR(GNPs:CB = 2).
The shell structure of GNPs/SR and GNPs/CB/SR is shown in Fig. 8. According to the shell structure model of conductive composites, polymer segments in conductive composites are divided into three phase.Reference Wang, Ding and Wang29 The first phase is free molecule chain which has a high active micro-Brownian motion. The second phase is crosslinked molecule chain in which the motion has been restricted. The third phase is molecule chain with low level of acitive which is absorbed on the surface of conductive filler. The first phase is bonded to the second and third phase, which acts as a framework forming a three dimensional mechanical network.Reference Tian, Huang, Wang, Li, Liu, Liu and Zhang16Figure 8(a) shows GNPs located in GNPs/SR, indicating that the electron hopping among GNPs. The role of CB is considered in three cases containing mechanical and electrical effect as it illustrated in Fig. 8(b). The first role of CB is changing SR segments in composites, reinforcing the matrix, and enhancing the mechanical performance of the conductive composites.Reference Omnès, Thuillier, Pilvin, Grohens and Gillet30 When CB is added in matrix, the macro-rubber molecule chain with low level of acitive which acts as a joint in framework is increased, which makes the three dimensional mechanical network in conductive composites more developed. Moreover, compared with the macro-rubber molecule chain with low level of acitive absorbed on the 2D structure of graphene, the mechanical performance that absorbed on the 0D structure of CB is more steady.Reference Soltania and Katbabb31,Reference Jean32
The shell structure model and electron hopping: (a) GNPs/SR; (b) GNPs/CB/SR.
The second role of CB is as a conductive phase itself, and promotes the electron hopping when CB locates on GNPs or at one side of GNPs directly. Further, the presence of CB can prevent direct contact between GNPs, and this can increase the effective percolation threshold by reducing the number of GNP–GNP contacts that are electrically conducting. The barrier potential for charge migration among GNPs is reduced by an applied external electric field, promoting the electric tunnel effect.Reference Ma, Liu, Zhang, Wang, Wang, Wang, Wong, Tang, Hong, Paik and Kim33 The third role of CB is adsorbing the active rubber molecule chain, reducing the thickness of macro-rubber molecule chain with low level of activity which is adsorbed on GNPs, and promoting the electron hopping capability of GNPs.Reference Wang, Ding and Wang29,Reference Jean32 By taking into account all these, it could be concluded that there is a synergy between GNPs and CB in electrical properties. However, compared with the decisive role of conductive networks formed by GNPs and CB, the high electric fields generated by GNPs play an important complementary role. Thus, the synergy between GNPs and CB depends on the competition and collaboration of internal field emission and conductive networks.Reference Ma, Liu, Zhang, Wang, Wang, Wang, Wong, Tang, Hong, Paik and Kim33 Assuming that the potential barrier of electron hopping from GNPs A to GNPs B is ΔW 1 in the absence of CB, in the presence of CB, the potential barrier is reduced from ΔW 1 to ΔW 2 by an applied external electric field.
D. Measurement of pressure distribution
In this work, the distribution of pressure was measured. The starting material is a flexible substrate which is in fact a polyimide film with copper layer on one side. The thicknesses of polyimide (PI) layer and copper layer are 35 and 25 μm, respectively. The copper layer is patterned to form interdigital electrodes for conductive polymer shown in Fig. 9(a). The GNPs/CB/SR(GNPs:CB = 2) at 5.5 wt%, which has a good electrical conductivity and mechanical stability, was prepared by the Sec. B used as sensing elements to measure the distribution of pressure, and a discrete set of GNPs/CB/SR were considered to effectively reduce crosstalk between each sensing element.Reference Yang, Cheng, Chang, Tsao, Yang, Shih, Chang, Chang and Fan6Figure 9(b) shows the fabricated artificial skin with sensing elements. The flexibility of device is also demonstrated. The profiles of 12 conductive polymer-sensing elements (in circular-shape) are measured by a surface profiler. The thickness of sensing elements is 1 mm with a uniformity of less than 2%. Also, the size of sensing elements is 5.5 mm × 5.5 mm with a uniformity of less than 5%. Figure 9(c) shows an equivalent circuit of sensor array. The 2D resistive sensing elements utilized shared row and column connections to simplify inter-connect complexity.Reference Yang, Cheng, Chang, Tsao, Yang, Shih, Chang, Chang and Fan6,Reference Saxena, Bhan and Aggrawal34,Reference Mei, Wang, Wang, Feng, Xia and Zhang35 The sensor array can be considered as 144 independent sensors.
The measurement of pressure distribution: (a) A flexible substrate which is in fact a polyimide film with interdigital electrodes; (b) The fabricated artificial skin with sensing elements; (c) An equivalent circuit of the sensor array; (d) The testing of pressure sensor array surface with weight on different sensing element; (e) An implementation mode of sensing systems; (f) The test result in three-dimensional displays.
Figure 9(d) shows test realized by pressing the pressure-sensitive array surface with weight on different sensing element. The 60 g weight (material: stainless steel) was used to provide the applied loading in the testing. Figure 9(e) shows an implementation mode of sensing systems. Analog multiplexers were used as digitally-controlled analog switches. A microcontroller controlled the test order of the sensing units in the sensing array by the multiplexers. There was only one sensing unit in power supply at a time and the array was read sequentially. This kind of circuit design could greatly reduce readout complexity of sensor arrays. The resistances of all the sensing elements could be obtained by analyzing the voltage on reference resistance R f. The variable resistances of sensor array were converted to voltage signals and then an analog-to-digital converter works. The microcontroller collected digital voltage signals and then the digitalized data were sent to PC through serial ports. The further processing and utilization of data can be completed by the software based on Laboratory Virtual Instrument Engineering Workbench (Labview). According to the relationships of resistance versus applied loading of sensing element, the resistance of sensing elements can be calculated by the output voltage of sensing elements. The result is displayed by three dimensional columns drawing of Fig. 9(f). It can be seen that the size of applied loading can be recognized accurately.
IV. CONCLUSION
In this study, SR filled with GNPs and CB is prepared for high performance flexible pressure sensor. Due to the synergetic effect of mixed GNPs and CB, the GNPs/CB/SR has a lower percolation threshold than that of CB/SR, which indicates the addition of GNPs is contributed to enhance the electrical conductivity of GNPs/CB/SR. Moreover, the GNPs/CB/SR has a higher electrical stability and weaker resistance creep than that of GNPs/SR. That is to say, the addition of CB can promote the electrical and mechanical performance of GNPs/CB/SR simultaneously. The results show that the size of applied loading on the pressure-sensitivity array based on GNPs/CB/SR can be recognized accurately.
ACKNOWLEDGMENTS
This work was financially supported by the Program of National Natural Science Foundation of China (No. 61401141, 61471155), and Anhui Provincial Natural Science Foundation (No. 1508085QF115).