Introduction
A massive amount of research has shown that the scores on standardized intelligence tests are the best predictors of training performance and work performance (Schmidt & Hunter, Reference Schmidt and Hunter1998), and that they are correlated to more phenomena than any other construct (Jensen, Reference Jensen1998). However, when comparing the IQ scores of two ethnic groups it is generally observed that one group outscores the other (see Ogbu, Reference Ogbu1994; Lynn & Vanhanen, Reference Lynn and Vanhanen2002; te Nijenhuis et al., Reference te Nijenhuis, de Jong, Evers and van der Flier2004a). Two groups have been the most often compared, and those are Blacks and Whites in the United States. Almost a century ago, Spearman (Reference Spearman1927) hypothesized that there was a simple pattern in Black–White differences in mean scores on the various tests of an IQ battery, namely small differences on relatively easy subtests (low loadings on the general factor of intelligence, g) and larger differences on relatively difficult subtests (high loadings on the general factor of intelligence). Jensen was interested in finding out what caused the IQ differences between Blacks and Whites and carried out many empirical tests of what became known as Spearman’s hypothesis. In many studies groups of Blacks and Whites were compared using subtests of IQ batteries, and in the overwhelming majority of studies Spearman’s hypothesis was confirmed (Jensen, Reference Jensen1998). In the US, Spearman’s hypothesis has also been tested for other minority groups, namely Jews (te Nijenhuis et al., Reference te Nijenhuis, David, Metzen and Armstrong2014a), Hispanics (Hartmann et al., Reference Hartmann, Kruuse and Nyborg2007), Native Hawaiians (Nagoshi et al., Reference Nagoshi, Johnson, DeFries, Wilson and Vandenberg1984), Asian-Americans (Dalliard, 2013) and Native Americans (te Nijenhuis et al., Reference te Nijenhuis, van den Hoek and Armstrong2015d), showing clear confirmations of Spearman’s hypothesis in almost all studies. Moreover, the hypothesis that ethnic group differences on subtests of an IQ battery are predicted by subtests’ g-loadedness has also been tested in the Netherlands comparing immigrants from non-Western countries with ethnic Dutch (te Nijenhuis et al., Reference te Nijenhuis, Evers and Mur2000; te Nijenhuis et al., Reference te Nijenhuis, Tolboom, Resing and Bleichrodt2004b; te Nijenhuis & van der Flier, Reference te Nijenhuis and van der Flier1997, Reference te Nijenhuis and van der Flier2005), South Africa (Lynn & Owen, Reference Lynn and Owen1994) and Zimbabwe (Rushton & Jensen, Reference Rushton and Jensen2003). In almost all of these studies, ethnic group differences in intelligence are strongly predicted by g loadings.
The above research findings have been criticized in various ways, for instance by criticizing the concept of general intelligence, g. Spearman (Reference Spearman1927) argued that there is something like ‘general’ mental ability that is tapped to various extents by all mental tests. Defenders of g theory claim that it is the most parsimonious explanation for the correlations among subtest scores. It has been argued that Spearman’s position has been based on a single observation: the uniformly positive correlation among all mental tests, that the causes of these correlations are not known and that there are many possible explanations. Critics claim that one does not need to postulate the existence of a ‘general mental ability’ to account for the positive manifold in IQ testing (Gould, Reference Gould1987). All one needs are genetic or environmental factors that have multiple effects on many different abilities. It is argued that with this uncertainty about the causes of the positive manifold, one can use g only as a descriptive construct and not as an explanatory construct. However, there is very strong real-world proof of the importance of g: various large-scale studies clearly show that IQ scores are excellent predictors of two highly important criteria, namely job performance and training performance, and that it is the g component that is the most strongly responsible for this (Hunter, Reference Hunter1986; McHenry et al., Reference McHenry, Hough, Toquam, Hanson and Ashworth1990; Ree & Earles, Reference Ree and Earles1991; Ree et al., Reference Ree, Earles and Teachout1994). So, it is concluded that g is clearly more than simply a statistical phenomenon.
The research by Lynn and others on group differences in intelligence has been strongly criticized by the Dutch statistician Jelte Wicherts in two interviews with Dutch journalists (van Rooijen, Reference van Rooijen2009; ten Broeke, 2010). In a 2009 interview Wicherts stated that at a certain moment in time the Zeitgeist changed and statements about group differences in IQ were again acceptable. He then said that this change had gone so far that people state things that are beyond any degree of scientific reason, stating that the boat of the research into national differences cannot be said to be as leaky as a sieve, because it does not even have a bottom. Concerning the scientific quality of papers that argue for national differences in IQ, Wicherts stated that they were pathetically bad, so that the outcomes of these studies do not tell us anything. He said that at all levels the authors misfire: the basic assumptions, the data, the methods, the theories. In a 2010 interview Wicherts stated that the research of Lynn and Rushton was simply bizarrely bad.
There has also been criticism on the ways of testing Spearman’s theory that group differences in general mental ability are a function of cognitive complexity (Gould, Reference Gould1987; Dolan et al., Reference Dolan, Roorda and Wicherts2004). Dolan et al. (Reference Dolan, Roorda and Wicherts2004) argued that Jensen’s Method of Correlated Vectors (MCV) lacked specificity: non-g vectors – for instance a spatial vector – can be created that sometimes yield a comparable positive correlation between group differences and factor loadings. However, these alternative models tested by Dolan et al. make very little theoretical sense: there are no selection psychologists or educational psychologist claiming that group differences in intelligence and group differences in work performance and school performance are fundamentally determined by racial differences in spatial abilities. Dolan et al.’s findings of the fit of alternative models for racial differences are interesting from a statistical point of view, but they have never been replicated in the 12 years following this publication, so one should not put too much value on them. Woodley et al. (Reference Woodley, te Nijenhuis, Must and Must2014b) fundamentally criticized the work by Dolan and co-authors, and one of the arguments they used was that the statistical techniques preferred by Dolan make such strong requests upon the datasets that only a miniscule amount of the datasets can be analysed with them. Woodley et al. claimed that MCV was a simple and straightforward technique that allows analysis of many datasets, which has the strong advantage that all these studies, some small, can later be added to a meta-analysis, allowing corrections for statistical artifacts, so that strong conclusions can be drawn. Since 2004 all studies testing Spearman’s hypothesis have used Jensen’s techniques and none has used Dolan’s techniques, suggesting that authors, reviewers and editors prefer Jensen’s simple and straightforward techniques. Also, applying Jensen’s technique has allowed quite large meta-analyses to be carried out on Spearman’s hypothesis (te Nijenhuis et al., Reference te Nijenhuis, David, Metzen and Armstrong2014a; te Nijenhuis et al., Reference te Nijenhuis, van den Hoek and Armstrong2015d; te Nijenhuis et al., Reference te Nijenhuis, Willigers, Dragt and van der Flier2016c), which would not have been possible using Dolan’s techniques.
There has also been discussion on how to interpret a confirmation of Spearman’s hypothesis using MCV. Jensen (Reference Jensen1998) argued that some tests are finer measures of mental ability than others are. This is interpreted to mean that if a difference between two ethnic/racial groups is a difference in general ability, the finer measures of this general ability (those with higher g loading) should have greater differences between groups than the less-pure measures. Jensen (Reference Jensen1998) emphasized that the most heritable subtests tend to have the highest g loading – hence the hypothesis that g somehow represents a genetic influence on brain efficiency, and specialized abilities represent environmental influences. One environmental factor that correlates with IQ scores is education. It can be argued that g is most important for educational outcomes, but it is equally plausible that schools raise all aspects of intelligence, and therefore going to school raises g (Rutter, Reference Rutter1985; Rindermann, Reference Rindermann2008). Another possibility is that nutrition is important, as claimed by Lynn (Lynn & Vanhanen, Reference Lynn and Vanhanen2006). Finding that both IQ gains due to more years of schooling and IQ gains due to improved nutrition are also strongly related to g loadings would weaken Jensen’s explanation of genetic causes of group differences. Only a few of these studies testing whether non-genetic variables show positive correlations with g loadings have been carried out. Te Nijenhuis et al. (Reference te Nijenhuis, Jongeneel-Grimen and Armstrong2015c) showed that adoption gains correlated negatively with g loadings, and te Nijenhuis et al. (Reference te Nijenhuis, Jongeneel-Grimen and Kierkegaard2014b) showed that Headstart gains also correlated negatively with g loadings. The discussion on the causes of group differences would advance when MCV would systematically be applied to all variables hypothesized to explain group differences in intelligence.
Rushton and co-authors took the discussion on Spearman’s hypothesis one step further by testing it at the level of the items of Raven’s Progressive Matrices (RPM), instead of at the level of subtests of an IQ battery. The g loadings of items were estimated using the correlation of item scores with the total score on the RPM, which is generally considered a very good measure of g (Jensen, Reference Jensen1980). These g loadings were then correlated with the differences in pass rates on items between ethnic groups, an indication of how much better one group did than the other. Rushton and his co-authors carried out a series of studies in Africa and Serbia (Rushton & Skuy, Reference Rushton and Skuy2000; Rushton, Reference Rushton2002; Rushton et al., Reference Rushton, Skuy and Fridjhon2002, Reference Rushton, Skuy and Fridjhon2003; Rushton et al., Reference Rushton, Čvorović and Bons2007). Spearman’s hypothesis was confirmed: African/White differences and Roma (Gypsy)/Serbian differences were greater on those items of the SPM with the highest item-total correlations. In these studies the ethnic group differences were most pronounced on the most difficult items and least pronounced on the easiest items. In a more recent study Díaz et al. (Reference Díaz, Sellami, Infanzón, Lanzón and Lynn2012) used the item scores on the RPM to compare a White Spanish sample with a sample of Moroccans, which resulted in a negative correlation (r=−0.20). Most recently, te Nijenhuis et al. (Reference te Nijenhuis, Al-Shahomee, van den Hoek, Allik, Grigoriev and Dragt2015a) compared a group of Libyan secondary school children with other groups of secondary school children from Bosnia and Herzegovina, Estonia, Ukraine, Russia, South Africa, Ireland and Chile, which yielded a mean weighted r with a value of 0.61. Also, te Nijenhuis, et al. (Reference te Nijenhuis, Al-Shahomee, van den Hoek, Grigoriev and Repko2015b) compared groups of Libyan university students and adults with comparable groups from South Africa, Spain and Russia, and a group of Roma from Serbia, which yielded a mean weighted r with a value of 0.73. Te Nijenhuis et al. (Reference te Nijenhuis, Grigoriev and van den Hoek2016b) carried out a study where groups of Kazakh, Korean, Tatar and Uzbek children from Kazakhstan were compared with a group of Russian children from Kazakhstan yielding a mean-weighted r of 0.67. Te Nijenhuis et al. (Reference te Nijenhuis, Bakhiet, van den Hoek, Repko, Allik and Žebec2016a) compared a large group of Sudanese children and adolescents with other groups of children and adolescents from ten different countries yielding a sample-size-weighted r with a value of 0.70.
The African and Serbian studies by Rushton and his co-authors yielded lower outcomes than the various studies by te Nijenhuis and co-authors; the negative correlation from the Spanish study is clearly an outlier. More studies are needed to check whether the lower correlations from the studies by Rushton and co-authors or the higher correlations from the studies by te Nijenhuis and co-authors are the exception. Therefore a large dataset of Saudi Arabian children and adolescents (N=3209) was analysed and their Standard Progressive Matrices (SPM) item scores were compared with the SPM item scores of other groups of children and adolescents from Denmark, Cyprus, Croatia, Bosnia, South Africa, Estonia, Ukraine, Ireland, Russia and Chile (total N=9333).
Methods
Several samples from different countries were compared to test Spearman’s hypothesis on a sample of Saudi children and adolescents. The test used to assess the intelligence of the different samples was the Raven’s Standard Progressive Matrices (SPM; Raven, Reference Raven1958; Raven et al., Reference Raven, Raven and Court1998). The SPM does not have any verbal or cultural components and is therefore useful in assessing intelligence cross-culturally. The SPM itself contains 60 items which are divided over five groups (A to E) and the groups become progressively more difficult. To ensure fair and comparable comparisons, the samples were matched as closely as possible on mean age and age range.
Saudi sample
The Saudi sample (Batterjee, Reference Batterjee2011) consisted of 3209 Saudi children and adolescents from the Mecca Provinces between the ages of 8 and 18. All the participants were students and were representative of the general population. The sample contained students from both private and public schools, but none of the students was from elite private schools. The dataset was split up to make appropriate comparisons to the others samples.
White samples
The Danish sample (Vejleskov, Reference Vejleskov1968) was a combined sample with 366 fifth-grade students from Gentofte and 262 fifth-grade students from Esbjerg, making a total of 628 subjects. Their age ranged from 11 to 12, and the average age of the combined sample was 11.9 years. This sample was compared with Saudi children aged from 11 to 12.
The South African sample (Owen, Reference Owen1992; Rushton, Reference Rushton2002) consisted of 1056 White children with an average age of 15 years. It must be noted that Rushton (Reference Rushton2002) reported an average age of 14 years for the Owen (Reference Owen1992) sample; however, the sample was collected from the same schools and had the same number of subjects as the JAT sample in Lynn and Owen (Reference Lynn and Owen1994), and it was therefore judged that 15 was the correct age. This sample was compared with the 15-year-olds from the Saudi sample.
The Estonian sample (Lynn et al., Reference Lynn, Allik and Irwing2004; Pullman et al., Reference Pullmann, Allik and Lynn2004) contained 2692 participants after removing 46 participants that fell outside the 12–18 age range. The sample was collected from the fifteen Estonian counties and contained students from 27 different secondary schools. This sample was compared with the 12–18 age groups of the Saudi sample.
The Ukraine sample (Prozorovskaya et al., Reference Prozorovskaya, Grigoriev and Lynn2010) contained 133 school children from representative schools in Belaya Tserkov and Kiev, between the ages of 15 and 16, with an average age of 15.25 years. This sample was compared with the 15–16 age groups of the Saudi sample.
The Russian sample consisted of two combined samples. The first sample (unpublished data collected by Andrei Grigoriev in 2013) was a combination of several smaller samples, for a total 158 Russian school children from the city of Moscow and the town of Ryazan. The sample was between the ages of 14 and 17 with a mean age of 15.52 years. The second sample (unpublished data collected by Vladimir Sukhanovskiy in 2015) was a combination of two samples. The first sample was collected in several sessions from the small town of Novosokolniki. The second sample was collected from a selective school in Moscow. The combined sample contained a total of 254 children and adolescents with an age range of 14–17 and an average age of 15.53 years. The combination of these samples gave a total of 412 subjects, with an average age of 15.52 years. This sample was compared with the 14–17 age groups of the Saudi sample.
There were two Bosnian samples for analysis. The first sample (Djapo, Reference Djapo2006) contained complete data for 248 school children. The sample contained mostly children aged 12–13 with an average age of 12.63 years. This sample was compared with the 12–13 age groups of the Saudi sample. The second Bosnian sample (Djapo & Lynn, Reference Djapo and Lynn2010) contained a total of 348 children and adolescents with an age range of 14–20. To make a proper comparison with the Saudi sample, all subjects over 18 years were removed, which yielded a sample of 339 children aged 14–18, with an average age of 16.83 years. This sample was compared with the 14–18 age groups of the Saudi sample.
The Irish sample (Moran, Reference Moran1986) consisted of data on 181 industrial apprentices with an age range of 16–20 and an average age of 17.88 years. The data were reported at the group level, and therefore it was not possible to remove subjects over 18 years. To create a reasonable comparison, the sample was compared with the 16–18 age groups of the Saudi sample.
The Cypriot sample (unpublished data collected by George Spanoudis around 2013) was composed of 3803 children and adolescents between the ages of 10 and 18, with an average age of 14.25 years. The sample was collected from primary and high schools in the cities of Nicosia and Limassol, Cyprus. Some data points were missing (Reference Jensen16) and these were scored as incorrect. The dataset also contained several input errors (Reference Flynn, te Nijenhuis and Metzen9) that were fixed and scored as correct. The sample was compared with the 10–18 age groups of the Saudi sample.
The Croatian sample (Žebec et al., Reference Žebec, Demetriou and Kotrla-Topić2015) was composed of 502 Croatian children from public schools, and the age range was 7–17 with an average age of 11.99 years. The sample was collected from several schools in Zagreb, Croatia. One input error was corrected. The sample was compared with the 7–17 age groups of the Saudi sample.
Indian sample
The Indian sample from South Africa (Owen, Reference Owen1992; Rushton, Reference Rushton2002) was composed of 1063 Indian children with an average age of 15. It must be noted that, similarly to the White sample, Rushton (Reference Rushton2002) reported an average age of 14 for the sample. However, the sample was from the same schools and had the same number of subjects as the JAT sample in Lynn and Owen (Reference Lynn and Owen1994), and therefore it was judged that 15 was the correct age. This group was compared with the 15-year-olds from the Saudi sample.
Hispanic sample
The sample from Chile (Ivanovich et al., Reference Ivanovich, Forno, Durán, Game, Castro and Ivanovich2000) contained a total of 2048 Chilean children and adolescents aged 11–18, with an average age of 13.87 years. The sample was stated to be a representative and stratified sample from the metropolitan region of the capital Santiago. The sample was compared with the 11–18 year age groups from the Saudi sample.
Calculation of d and g
A d score is required to apply the method of correlated vectors. A d score is usually the standardized difference between groups. In the present study the score for each item was expressed as the percentage of correct answers, and to compute the difference score the score of the lower scoring group was deducted from the score of the higher scoring group. The remaining percentage was used as the difference or d score.
For calculation of the g loading at the item level, the scores for each item on the SPM was correlated with the total scores on the SPM. This should be a good approximation for g loadings since the total score of the SPM is a good indicator of g. The g loadings at the item level are less reliable than g loadings of subtests are; however, the SPM does have a substantial number of items (60). The Cyprian dataset, with N=3803, was used to calculate the g loadings, since it was the largest representative White dataset available.
In the data points in the current study there was often a large disparity between group sizes. Take, for instance, a comparison where one group has an N=100 and the second group has an N=1000. A sample of 100 has quite substantial sampling error, whereas a sample of 1000 indicates a much smaller sampling error. What is a good indicator of the sample size of such a data point where two datasets are combined? The strictest choice would be to simply use the value of the smallest sample. This would, however, ignore the positive influence of the much larger sample on the sampling error of the data point. A comparison could be made with testing the means of samples of unequal size for significance: A difference between samples of 900 and 100 reaches significance less quickly than the difference between samples of 500 and 500, notwithstanding the fact that the total N is equal. Stated differently, the increase in precision for the sample of 900 does not outweigh the decrease in precision for the sample of 100. A harmonic N takes this into account; the value is much closer to the N of the smallest sample than to the N of the largest sample. The value of N harmonic was computed using the formula:
 $$N\,{\equals}\,4\,/\,({1 \over {n_{1} }}{\plus}{1 \over {n_{2} }})$$
where n 1 and n 2 are the number of participants in groups 1 and 2 respectively.
Results
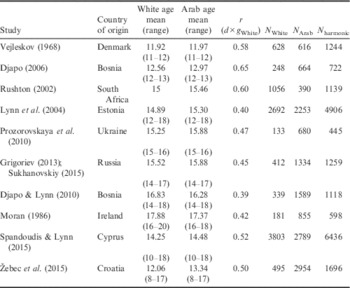
Tables 1, 2 and 3 give an overview of the various data for testing Spearman’s hypothesis. Using the g loadings from the Cyprian dataset it was found that correlations between g and d ranged from 0.21 to 0.65. Calculated over all samples, the N harmonic-weighted average was 0.44.
Spearman’s hypothesis tested for White–Arab differences

Spearman’s hypothesis tested for Indian–Arab differences

Spearman’s hypothesis tested for Hispanic–Arab differences

Discussion
Spearman’s hypothesis tested at the level of items states that differences between groups on the items of an IQ test are a function of the g loadings of these items, such that there are small differences between groups on items with low g loadings (relatively easy items) and large differences between groups on items with high g loadings (relatively difficult items). The outcomes of empirical studies show a lot of variability. The pioneering studies by Rushton and co-authors in South Africa and Serbia generally showed modest confirmations of Spearman’s hypothesis, whereas the studies by te Nijenhuis and co-authors generally showed much higher correlations. Therefore a very large dataset of SPM item scores of Saudi Arabian children and adolescents (N=3209) was analysed and compared with datasets with the SPM item scores of other groups of children and adolescents from ten different countries. Spearman’s hypothesis tested in twelve comparisons yielded a mean weighted r with a value of 0.44, which is clearly a less-strong confirmation than in the studies of te Nijenhuis and co-authors. It was concluded that Spearman’s hypothesis tested at the item level is reasonably strongly supported.
A limitation of the present study is that only a modest number of groups of a specific age were compared with each other. Replication studies using groups from other countries and other ages should be carried out to test the generalizability of the findings. Spearman’s hypothesis should not only be tested on the Standard Progressive Matrices, but also on other versions of the Raven’s Progressive Matrices, such as the Coloured Progressive Matrices, the Advanced Progressive Matrices and the Standard Matrices Plus. It would be nice to include more standardization samples in new studies.
It has been argued that the Raven test is not a test of general mental ability, but a test of abstract non-verbal reasoning (Raven, Reference Raven1960): it requires mainly the ability of analytical reasoning, to analyse complex symbols into individual attributes such as number or directionality. This mental ability needs to be acquired in schools. Furthermore, it has been argued that this is the reason why children and adults who did not attend school, or who had very little schooling, perform poorly on such tests, and why there were strong Flynn effects on the Raven test in 20th century Europe when educational systems became intensified (Flynn, Reference Flynn1984, Reference Flynn1987; Lynn & Vanhanen, Reference Lynn and Vanhanen2002; Jamieson, Reference Jamieson2003; Meisenberg, Reference Meisenberg2003). It would be interesting to carry out studies testing MCV using Raven item scores of school children from poor developing countries to check whether Spearman’s hypothesis is indeed not supported. It would be even more interesting to explicitly focus on children in low-quality schools or children without any formal education.
Although the focus of this paper is on differences in g, it should be emphasized that there are differences besides g that can play an important role. For instance, Flynn et al. (Reference Flynn, te Nijenhuis and Metzen2014) showed that although certain group differences are not on the g factor they still have important real-world consequences. Iodine deficiency, prenatal cocaine exposure, fetal alcohol syndrome and traumatic brain injury all create a substantial cognitive deficit in those afflicted that is not on g but clearly impedes the functioning of those suffering from it. This principle does not only apply to decreases in intelligence, but also to increases in intelligence. Woodley (Reference Woodley2012) showed that although the Flynn effect gains are not on the g factor (te Nijenhuis & van der Flier, Reference te Nijenhuis and van der Flier2013), they still appear to contribute to economic growth.
What can be said about the causes of group differences in intelligence? Various researchers come to very different conclusions (Rindermann et al., Reference Rindermann, Becker and Coyle2016). Nisbett (Reference Nisbett2009) argued that the differences can be fully explained by environmental variables, for instance schooling. Rushton and Jensen (Reference Rushton and Jensen2005, Reference Rushton and Jensen2010), however, argued that there is a strong genetic component; also, te Nijenhuis et al. (Reference te Nijenhuis, Bakhiet, van den Hoek, Repko, Allik and Žebec2016a) argued that g loadings have been shown to have quite strong correlations with biological variables including genetic variables, although it should be stated that the correlations are not uniformly high. Obviously, this is not experimental research, but correlational research, so one should be careful not to draw too strong conclusions.
Since the appearance of Nisbett (Reference Nisbett2009) and Rushton and Jensen (Reference Rushton and Jensen2010) some new papers relevant for the discussion on the causes of group differences in intelligences have appeared. Piffer (Reference Piffer2015) reviewed published Genome Wide Association Studies (GWAS) that report the presence of alleles exhibiting significant and replicable associations with IQ scores. He showed that the average between-population frequency of nine alleles positively and significantly associated with intelligence was strongly correlated to country-level IQ. This looks like an interesting new approach, but clearly more additional work is needed. Woodley et al. (Reference Woodley, Rindermann, Bell, Stratford and Piffer2014a) focused on the link between Microcephalin and country IQ. Despite the fact that Microcephalin genes are not associated with IQ at the level of individuals, they showed that the frequencies of Microcephalin in groups correlate strongly with country IQ. They hypothesized that these alleles are expressed in the immune system, which could have led to increases in intelligence. Again, this is an interesting finding, but based on only 59 populations; future studies will show how strongly these findings will hold up.
What will happen to group differences in intelligences in the next decades? Meisenberg and Woodley (Reference Meisenberg and Woodley2013) stated that international IQ differences are diminishing because substantial Flynn effects are now underway in non-Western, low-g countries, while intelligence is stagnating or even becoming lower in the economically advanced high-g countries. They show that this trend is also visible on scholastic assessment tests; these tests are known to show very high correlations with traditional IQ tests. In a related study, Rindermann and Thompson (Reference Rindermann and Thompson2013) showed that in the US Black/White differences and Hispanic/White differences were substantially reduced between 1971 and 2008 on scholastic achievement tests (see also Rindermann & Thompson, Reference Rindermann and Thompson2016). So, it is concluded that most likely group differences will continue to become smaller.
Acknowledgments
The authors thank Dr Nermin Djapo for providing access to the Raven data from Bosnia and Herzegovina, Dr Andrei Grigoriev for access to data from Ukraine and Russia, Dr George Spanoudis for access to data from Cyprus and Dr Mislav S. Žebec for access to data from Croatia. They also thank Jim Flynn and an anonymous reviewer for their constructive feedback.