

Voting behaviour, heuristics and pre-election polls
In the domain of electoral studies, innovative approaches have been recently developed to explain voting behaviour. Important contributions are being supplied by social and political psychology, which have ushered in new fields of research on socio-cognitive factors that affect voting choices. In some approaches, political judgement (of which voting behaviour is but a specific manifestation) is seen as a cognitive activity of the same nature of other judgmental processes that occur in complex domains and involve socially relevant stakes. When individuals engage in an information search process in order to shape judgements, they do so by resorting to cognitive ‘shortcuts’ (or heuristics) (Petty and Cacioppo, Reference Petty and Cacioppo1986). Research has shown that many citizens manage to make voting choices by resorting to heuristics, even without committing themselves to processing a lot of political information. During an election campaign, voters seek information on the basis of both their cognitive capabilities and the complexity of the political environment. The scientific debate has focused more on how much information citizens acquire, rather than on how that information is acquired (Redlawsk, Reference Redlawsk2004).
In this study, our theoretical references are based on the work of Kruglanski et al. (Reference Kruglanski, Thompson and Spiegel1999) as regards judgement processes and Lau and Redlawsk (Reference Lau and Redlawsk2006) as regards their model for voting decisions. In both models, a crucial role is played by information search strategies. According to Kruglanski et al. (Reference Kruglanski, Thompson and Spiegel1999), in order to formulate a judgement, an individual gathers information that he/she feels to be pertinent to the task at hand. According to Lau and Redlawsk’s (Reference Lau and Redlawsk2006) voting decision model, the voter’s socio-demographic traits, his/her level of sophistication, and characteristics of the election campaign exert influence on information search strategies, which in turn affect evaluations and decision quality.
Lau and Redlawsk (Reference Lau and Redlawsk1997, Reference Lau and Redlawsk2006, Reference Lau and Redlawsk2009) developed their innovative voting decision model via a ‘dynamic information board’, inspired by the classic information board put forward by behavioural decision theorists for the study of decision making (Carroll and Johnson, Reference Carroll and Johnson1990). More precisely, the ‘board’ is a computer software tool for simulating election campaigns tailored to observe information research strategies in which voters engage. The virtual environment reproduces the presence of candidates and parties and introduces participants – randomly allocated to subgroups – to variable sets of information in order to evaluate their use of different sources. Lau and Redlawsk’s instrument is defined as ‘dynamic’ in that information about candidates and other political (and non-political) issues scroll down a computer screen rather than being in a fixed location. The information board is thus implemented via a dynamic process-tracing environment (DPTE). The basic premise of process-tracing studies is that it is best to study decision making while the decision is being made. In other words, with a dynamic information board, the decision maker can access only information available at a certain time, for information flows continually during the simulation, as it does during a real campaign.
Another focus of this study is pre-election polls. In general, opinion polls produce information flows – originating among citizens and directed to public and private users – that are more extensive, detailed, and constant over time than those generated by actual elections (which are comparatively infrequent and feature generic semantic content). Surveys create information flows that are also directed towards citizenry via the diffusion of poll findings by the media. As mass media are the major source of political information, they contribute to a great extent to the determination of the most salient issues, and thus can affect public opinion. This has fed fear and reservations about the role of polls in the political life of contemporary society in that public opinion is deemed to be superficial, mediocre, and subject to manipulation (Noelle-Neumann, Reference Noelle-Neumann1984; Crespi, Reference Crespi1989; Price, Reference Price1992; Broughton, Reference Broughton1995; Ceri, Reference Ceri1997; Bishop, Reference Bishop2005). Among polls, a special status is reserved for those surveys concerning voting behaviour, especially when they attempt to record voting intentions and predict election results. Pre-election polls perform a legitimate political information function vis-à-vis voters: they convey the election ‘supply’ and make known, within limits, the corresponding demand (preferences and tendencies among the citizenry) (Corbetta and Gasperoni, Reference Corbetta and Gasperoni2007).
Pre-election polls (and, in general, polls on political issues), when they are shared in a public arena, can comprise an epistemic authority, providing the foundation for the particular type of heuristics based on the amount of support a candidate appears to enjoy (Lau and Redlaswsk, Reference Lau and Redlawsk2001), and theoretically can influence individual voting behaviour in a range of ways and with variable outcomes (Donsbach, Reference Donsbach2001). Does the circulation of pre-election polls affect preference and voting intentions or does it merely record them? Do voters actively seek out such information and allow it to shape their attitudes and behaviour? Such questions have inspired theoretical reflection and empirical research for decades, especially after Herbert Simon’s influential article contemplating how to integrate poll predictions’ effects into the predictions themselves (Simon, Reference Simon1954). In their comprehensive overview of the consequences of published opinion polls, Moy and Rinke (Reference Moy and Rinke2012) suggest that the latter may, on the one hand, influence voter participation – for example, mobilizing voters when polls suggest that leading candidates or parties enjoy similar levels of support, and that therefore the election is competitive. On the other hand, as regards voter preference, attention has traditionally focused (as per Simon’s work) on the juxtaposition of ‘bandwagon’ effects (changing one’s voting behaviour in favour of a candidate or party who is identified as likely to win) and ‘underdog’ effects (changing one’s voting behaviour in order to express empathetic support for a reportedly losing candidate or party). According to Moy and Rinke, ‘the extant literature can hardly conclude whether bandwagon or underdog effects are generally stronger or more widespread. The inability to do so stems primarily from theoretical and operational inconsistencies: researchers not only study different contexts but also emphasise different processes underlying these effects’ (Reference Moy and Rinke2012: 230). Many studies (Henshel and Johnston, Reference Henshel and Johnston1987; Skalaban, Reference Skalaban1988; McAllister and Studlar, Reference McAllister and Studlar1991; Nadeau et al., Reference Nadeau, Cloutier and Guay1993; Ansolabehere and Iyengar, Reference Ansolabehere and Iyengar1994; Morwitz and Pluzinski, Reference Morwitz and Pluzinski1996; Mehrabian, Reference Mehrabian1998; Irwin and Van Holsteyn, Reference Irwin and Van Holsteyn2002) suggest that the circulation of poll results probably affects voters’ behaviour (usually to the advantage of candidates whom surveys report as being ahead: Hardmeier and Roth, Reference Hardmeier and Roth2003). More recently, greater effort has been devoted to the exploration of the effect of polls on strategic voting, that is, the shifting of preferences to second-best options, especially in multi-party contexts, within frameworks that rely heavily on rational choice models of behaviour. Published polls may also engender attitudinal effects, involving political trust, political engagement, and opinion expression. One must keep in mind that most polls, however, are not rendered public by their sponsors, yet may be influential on voter behaviour to the extent that their findings help shape parties’ and candidates’ political communication, marketing, and voter mobilization strategies.
Studies on the direct effect of published pre-election surveys on voting intentions are neither exhaustive nor conclusive and usually point to the presence of multiple effects. Moreover, it is difficult to plan research designs capable of offering definitive answers in that the influence of polls must be separated from a thick network of other factors that contribute to shaping individual voting behaviour. One widespread approach – which is simple, but fraught with inferential constraints – estimates the effects of polls by comparing survey-based forecasts with actual election results. Another approach attempts to observe how political preferences and voting intentions vary in the light of exposure to poll findings in structured, controlled contexts, which allows researchers to distinguish polls from other factors that can affect voting preferences. This article reports a set of findings that can be placed in this second approach in that our study is centred on the execution of a large number of simulations in a DPTE. Our study aims to explore the perception of pre-election polls by voters and the role of exposure to poll findings on voting decisions, and their association with other voter characteristics.
Research design
This article reports a subset of findings of a research project called ‘Electoral Choice: Voters’ Heuristic Strategies and Information Processing’, which aimed to empirically study the information search strategies enacted by voters during an election campaign from the standpoint of heuristics, that is, cognitive shortcuts used by individuals in order to make decisions. The project was innovative in that (a) it involved the application in a new context – the Italian political and electoral system – of a technique, the dynamic information board described in the first section, heretofore used only in the United States; and (b) it adopted an unusual approach for the Italian research context of voting behaviour, traditionally based on ecological studies and/or sample surveys.
The project required the development of an online simulation of a mayoral election campaign via the DPTE mentioned in the first section. The simulation – developed ex novo for this project – begins by describing the election campaign setting, asking the voter (we will use this term to designate the participants in the study) to imagine that he/she has moved to a new city that will be electing a new mayor in a few weeks; there are four candidates, about whom the voter knows nothing, and whose ideological profiles range from far left to far right.
The campaign consists of a set of news items scrolling down the computer screen (flow items), which the voter can choose to open by clicking on them, which provides access to more information (see Appendix for more details). The campaign may be temporarily interrupted by ‘timed items’, that is, boxes that display information (e.g. a video advertisement) independently of the voter’s will. The general intention, of course, is to simulate the flow of information to which a typical voter is subject during a real election campaign. The campaign is defined by the contents of the flow and timed items that are programmed into the simulation; these contents must reflect the types of heuristics we wish to explore.
In this study, some types of heuristics were available for all voters, whereas others were made available only to subsamples, in an attempt to implement quasi-experimental research designs. The final sample comprises 895 participants, distributed among six different research units, which operated in different areas of Italy and pursued partly distinctive research goals. Fieldwork was carried out in the period stretching from March to December 2011. Recruitment of study participants was performed through quota sampling; the ensuing sample was not intended to be representative of the general electorate.
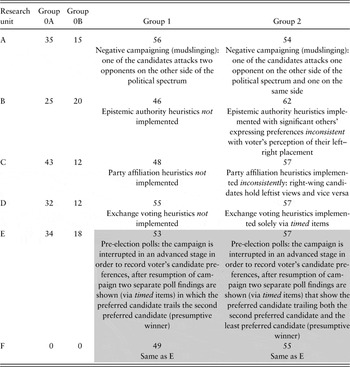
Within each research unit, participants were randomly assigned – according to pre-established quotas – to one of four groups that were associated with different potential heuristic profiles (see Appendix, especially Table A1). The general heuristic categoriesFootnote 1 involved candidates’ personal characteristics, party affiliation, ideology (positions on 14 different issues associated with seven politically relevant dimensions),Footnote 2 as well as endorsements expressed by relevant political and social groups and organizations, candidacy feasibility (candidates’ self-professed ability to win the elections or to govern the city effectively), voting preferences expressed by epistemic authorities, and opportunities for exchange voting. The opinion poll heuristic is expressed through four items announcing the results of a pre-election poll that is not focused specifically on voting intentions (see the following section).
Each flow item appears a certain number of times during the campaign (see Appendix, especially Table A2); the order of appearance is strictly random. Each campaign also comprises a set of four video ads that are displayed to all voters as timed items.
The campaign simulation is preceded by a brief questionnaire recording a set of voter characteristics and a short (90 second) ‘practice’ campaign aimed at familiarizing the voter with how the simulation works. After the end of the simulated campaign, participants are invited to ‘vote’ for one of the four candidates and respond to other questions concerning the candidates’ qualities and the simulated campaign (for a more detailed description of the overall project, see Corbetta and Colloca, Reference Corbetta and Colloca2013, for results concerning some of the non-poll-related heuristics, see Russo and Roccato, Reference Russo and Roccato2013; Corbetta and Colloca, Reference Corbetta and Colloca2014).
This article concerns, in particular, the use of the opinion poll heuristic and addresses it in two separate ways. First, it explores the attitudes and the actual access to opinion poll flow items among all study participants (N=895); the pertinent results will be examined in the following section. Second, it explores the effects on participants’ final voting decisions of ‘forced’ exposition to precisely tailored pre-election polls concerning voting intentions; the pertinent results (which involve only the participants in Groups 1 and 2 of units E and F, i.e. the shaded areas in Table A1) will be explored in the penultimate section, where we will also explain in greater detail the specific features of the research design for these groups.
Which age groups to involve in the study was a central methodological issue in the initial discussion of the voter recruitment technique. In particular, the research team debated whether or not to confine recruitment of participants to young people: a certain degree of familiarity and comfort with information technology (reading on a screen, use of a mouse for accessing information, etc.) appeared to be a prerequisite for effectively partaking in the campaign, and this attribute is predictably more widespread among younger voters, especially in a country such as Italy, in which the digital divide is still relatively marked. The final decision was to involve a full spectrum of participants in terms of age.
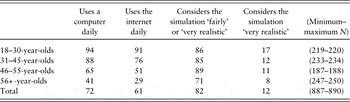
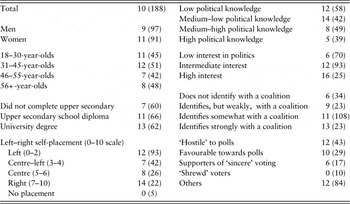
The actual findings are ambiguous on this point. Some findings suggest that the research technique may be less effective among older voters: younger participants report a greater frequency of use of computers and the internet and also state that to a relatively higher degree the campaign had appeared to them ‘realistic’ (Table 1). However, even among older voters, a great majority acknowledges that the simulated campaign was at least ‘fairly’ realistic, and the perception of the campaign’s verisimilitude is less differentiated than one might expect in the light of the varying levels of digital competency. On the whole, therefore, the participants’ opinions regarding the simulation’s realism suggest that the technique ‘works’.
Computer use, internet use, and perception of the simulated campaign as ‘realistic’ (percentages)

Are survey results an interesting source of information?
In this section, we will examine voters’ attitudes towards pre-election polls and the actual use of the opinion poll heuristic during the simulated electoral campaign. More specifically, we will examine voters’ perception of opinion polls’ reliability and usefulness, which are both – it is reasonable to assume – prerequisites for allowing polls results to affect one’s voting behaviour. Although we entertain no expectations as regards the prevalence of favourable or unfavourable attitudes, we do expect voters with higher levels of education, interest in politics, and political knowledge to adopt a more positive stance towards polls in that such voters should tend to welcome additional information sources in order to shape their decisions. This expectation leads us to expect more positive attitudes towards polls among men and leftist voters as well, at least at the bivariate level, in that they tend to manifest higher levels of political participation. As regards the actual use of polls in information search strategies, it would be reasonable to expect the same, above-mentioned subgroups of voters to display a more marked tendency to access poll-related flow items; in addition, obviously, one could reasonably hypothesize that voters with favourable attitudes towards surveys will be more likely to seek them.
As regards attitudes, participants were invited to answer two questions regarding pre-election polls. The first question concerned pre-election polls’ reliability and asked participants to place themselves on a seven-point scale anchored at the extremes by the following statements: ‘Pre-election polls, published in the media and aiming to predict the winner of an election, are not very reliable and do not reflect voters’ real intentions’ and ‘Pre-election polls almost always accurately predict election results’. The second question addresses voters’ perceived usefulness of pre-election polls and was centred on the following two statements: ‘Pre-election polls, published in the media and aiming to predict the winner of an election, are useful for citizens, in that everybody, if he/she wants, has more information at his/her disposal in order to decide whom to vote for’ and ‘Pre-election polls falsify election results because they persuade some citizens to vote differently than they otherwise would have’.Footnote 3 Respondents’ answers were scored from 1 to 7 in such a way that 7 corresponds to the statement expressing the highest degree of reliability/usefulness and 1 to the lowest. Whether voters view pre-election polls as reliable and useful is intrinsically interesting, of course, but this information will also prove valuable in the ensuing analyses in the penultimate section. It is reasonable to expect that voters who have more favourable attitudes towards voting intention surveys will be both more likely to seek out information drawn from such polls (i.e. will access flow items pertaining to polls in the simulation campaign) and allow their behaviour to change in light of their reported findings (i.e. will shift their candidate preference when polls suggest that there may be a good reason for doing so).
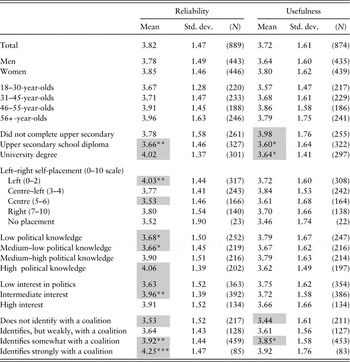
As far as pre-election poll reliability is concerned, voters distribute themselves in a roughly balanced way: 39% feel that polls tend to be unreliable (scores of 1, 2, or 3), 31% feel they are generally reliable (scores of 5, 6, or 7), and the remaining 30% place themselves at the same distance from the two statements. The average score (3.82: the scale’s mid-point is 4) verges slightly towards unreliability (Table 2).Footnote 4 Similar results are found in relation to polls’ usefulness: 42% believe they distort election results, 29% feel they are useful, 29% place themselves in the intermediate category, the mean score (3.72) leans towards the unfavourable statement.
Perception of pre-election poll reliability and usefulness

Mean scores on a 1–7 scale and standard deviations, Ns in parentheses.
Shaded values present statistically significant differences with respect to the category of the shaded value of the same variable not featuring the * symbol: *α⩽0.05; **α⩽0.01; ***α⩽0.001.
Younger people express more unfavourable attitudes towards pre-election polls than older people: there is a monotonic negative relationship between age and the perception of polls’ reliability and usefulness. The differences between age groups, however, are not statistically significant. Analogously, men hold more unfavourable views than women, but not significantly so. The level of education seems to discriminate vis-à-vis trust in pre-election polls: perception of reliability is highest among university graduates. However, well-educated voters also believe less than others in polls’ usefulness – a result which belies our initial expectations. Voters who place themselves on the far left of the left–right political continuum believe more than other voters in the predictive power of pre-election polls, and their positive attitude is statistically significant in comparison with voters at the centre.
Another distinctive trait is interest in politics: in terms of poll reliability, those who express an intermediate degree of interest show a high mean score (3.91), which is also significantly different from that registered among those with low interest (3.63). Similarly, voters with a high degree of political knowledgeFootnote 5 are significantly more likely to believe in poll reliability (4.06) with respect to those having low- or medium–low knowledge (3.68 and 3.66, respectively). These results reflect our initial expectations. Moreover, voters who identify at least to some degree with a political coalition perceive polls as being significantly more reliable and useful than voters with no coalition identification. (Identification with a coalition and interest in politics are positively associated with one another.)
It would be reasonable to expect usefulness and reliability to be positively correlated: if a voter believes that polls are reliable, he/she should be more likely to consider them useful. By and large, this is true: the correlation coefficient is 0.27. The strength of the correlation is particularly high among the youngest voters (0.36 among 18–30-year-olds), and then tapers off among older voters (0.29 among 31–45-year-olds, 0.27 among 46–55-year-olds, 0.19 among 56+-year-olds). A similar relationship holds regarding interest in politics: consistency among the two attitudes rises along with the level of interest.Footnote 6
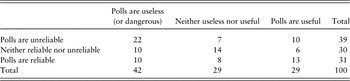
Combining these two variables in a typology (Table 3), we find that over one out of five respondents (22%) are outright ‘hostile’ towards pre-election polls: they consider them neither reliable nor useful. Only 13% of voters consider polls to be both reliable and useful. This is an important finding, for perception of polls’ usefulness and reliability is arguably a prerequisite for assigning a heuristic function to pre-election polls during an election campaign; this prerequisite is widely lacking. This belief is even less widespread among 18–30-year-olds (10%), who are also more likely to be ‘hostile’ (28%).
Typology of voters based on their perception of pre-election polls’ reliability and usefulness (percentages)

N=871.
The typology also highlights two groups, each comprising one-tenth of respondents, with apparently inconsistent views, linking reliability and uselessness (or even danger) on the one hand, unreliability and usefulness on the other hand. Perhaps the first group is made up of believers in ‘sincere’ voting: citizens should choose the candidate or party they most believe in, regardless of their chances of success. The second group is harder to interpret: perhaps they are ‘shrewd’ voters, who may think that poll results can be used to influence the electorate’s outlook, and thus, its behaviour (but in this case, the polls are not useful from the individual voter’s standpoint).
What happens when the campaign simulation starts? As mentioned in the second section and in the Appendix, the opinion poll heuristic was represented by four flow items announcing the results of a pre-election poll (that, however, did not concern voting intentions specifically, although this fact could not be inferred from the unopened box). Each item appeared twice during the campaign, and each participant could click on it as many times as he/she wanted (up to a maximum of eight times).Footnote 7
More than two out of five participants (43%) never opened any of the opinion poll item boxes; less than one out of three (28%) opened just one of them; almost one-third (29%) opened two or more flow items pertaining to a pre-election poll. In general, it would seem that voters are somewhat insensitive towards opinion polls during the campaign.
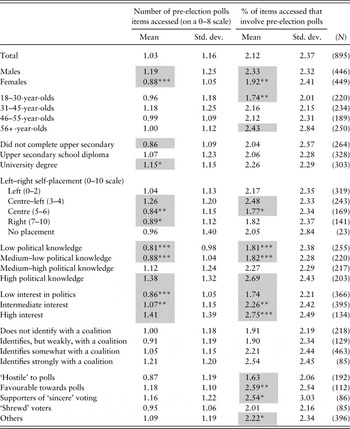
The intensity of use of the opinion poll heuristic can be operationalized in different ways; here we will examine two options. First, one may simply observe the number of times that one of the poll-related flow items was accessed: the ensuing variable may have a value between 0 and 8 (0 when none of the four pertinent flow items is ever clicked; 8 when each one of them is clicked twice, i.e. in each appearance). Second, one may calculate the ratio between the number of poll-related items that have been accessed and the total number of clicked flow items, pertaining to any information category (in Table 4 we report the ratio×100). We may consider these two options, respectively, as absolute and relative indicators of usage. As an aid to interpretation, we might stress the fact that if a respondent were to access items randomly or access each of the heuristic categories to a proportionally equal degree, the percentage of accessed poll-related items would be about 2.8%.
Pre-election poll flow items accessed by voters during the simulated election campaign

Means and standard deviations, corresponding Ns in parentheses.
Shaded values present statistically significant differences with respect to the category of the shaded value of the same variable not featuring the * symbol: *α⩽0.05; **α⩽0.01; ***α⩽0.001.
Table 4 suggests that males, voters highly interested in politics and with good political knowledge, and centre–left voters are more engaged by pre-election poll findings, regardless of the type of operational definition adopted. Coalition identification shows no appreciable association with use of the poll heuristic. Voters with at least an upper secondary school diploma resort more often to opinion polls, at least when the ‘absolute’ indicator is employed. Older voters behave in the same manner, according to the ‘relative’ usage indicator.
Use of the opinion poll heuristic is positively correlated with the perception of such polls’ reliability and usefulness, but only weakly and insignificantly so (0.10 and 0.04 for the absolute indicator, 0.15 and 0.07 for the relative one). As one might have expected, opinion polls were accessed more frequently by voters who believe polls are both useful and reliable (1.18 clicks, on average, according to the absolute indicator; 2.6% on the relative indicator), as well as supporters of ‘sincere’ voting (who believe polls are reliable, but useless/dangerous: 1.16 clicks; 2.5%), whereas subjects who are ‘hostile’ to polls (deemed both unreliable and useless/dangerous) did so less often (0.87 clicks; 1.6%).Footnote 8
Do survey results influence voting decisions?
In this section, we examine – via the simulated election campaign – whether voters actually shift preferences after being exposed to poll results that, in different ways, convey negative news about their preferred candidates’ chances. Two subsets of study participants, as mentioned earlier, were subjected to a simulated election campaign with significant variants with regard to its ‘standard’ version. For members of both subsets (Groups 1 and 2 in the shaded areas of Table A1), the campaign was suspended after 9 minutes (i.e. more than halfway through the simulation) in order to ask the participant to indicate which candidate he/she would most likely vote for, whom was the second preferred candidate and which of the four candidates was the least likely to receive his/her vote. The campaign flow items then resumed. After another 2 minutes, a timed item appeared on the screen and after another 2 minutes (i.e. about 1 minute before the end of the simulation), another timed item appeared. The content of these timed items was determined as follows by the voter’s candidate preferences.
In Group 1, the timed items reported the findings of two distinct pre-election polls that predicted the voter’s second preferred candidate would beat the most preferred candidate (by 4 or 5 percentage points); the other two candidates were described unequivocally as being out of the running. In theory, this news provided the participant with a good reason to transfer his/her preference to the second candidate, thus ‘jumping on the bandwagon’ without appreciably violating his/her preference profile. In Group 2, both timed items reported the findings of two distinct pre-election polls, according to which the voter’s least preferred candidate was ahead, beating the second preferred candidate (by 4 or 5 percentage points), who in turn, was ahead of the voter’s most preferred candidate (by another 4 or 5 percentage points). Again, the situation provides the voter with a good reason to transfer his/her preference to the second preferred candidate, in that doing so would mean voting for an ‘acceptable’ candidate in order to help prevent the worst possible outcome (i.e. victory of the least preferred candidate); this is a typical example of preventative tactical, or strategic, voting (Donsbach, Reference Donsbach2001). One might argue that Group 2 voters had a greater incentive than Group 1 voters to change their voting behaviour, in that failing to do so could contribute to a more undesirable outcome.
At the end of the campaign, the great majority of Groups 1 and 2 voters (161 out of 188, i.e. 86%) confirmed their initial preference, voting for a candidate that two pre-election polls predicted would lose.Footnote 9 Another eight voters switched their preference, but not in favour of the second preferred candidate; it is difficult to interpret these transfers as an effect of exposure to the pre-election poll findings. The remaining 19 voters (10% of the total) voted for the second preferred candidate; their behaviour may be plausibly attributed to knowledge of the pre-election poll findings (although, of course, other factors may have played a role, namely, the other information accessed during the latter phase of the campaign, which took place after recording the voter’s candidate preferences).Footnote 10 Of the 188 valid cases, 90 belonged to Group 1 (potential bandwagon effect) and 98 to Group 2 (potential strategic effect); eight and 11 voters, respectively (i.e. 9 and 11%), voted for the initially second preferred candidate, the difference between the two groups is too small to justify any conclusion concerning the greater intensity of one of the two effects, and thus, seemingly contradicts the expectation that Group 2 voters might have a greater incentive to switch.
In Table 5, the results for Groups 1 and 2 are pooled, underlining the percentage of voters enacting a vote change compatible with an effect owing to pre-election poll exposure. For many of the variables reported in the table, we do not have strong reasons to anticipate a significant link with vote-switching. Although one might expect voters with low interest and knowledge about politics, lower educational levels and weaker identification with a political coalition to be more amenable to poll influence, it is also true that voters belonging to these subgroups might be less motivated and/or less able to make use of poll findings. More pertinently, one might expect voters expressing favourable views towards polls to allow themselves more easily to be influenced by them in their behaviour.
Incidence of voters who transferred their vote from the most preferred to the second preferred candidate after exposure to pre-election polls unfavourable towards the former (percentages)

Ns in parentheses.
The actual findings suggest that voters more likely to switch are young, well-educated, poor in political knowledge, more interested in politics, hold extreme ideological stances, and strongly identify with a political coalition.Footnote 11 Surprisingly, voters who are hostile towards polls (i.e. who feel that they are neither reliable nor useful), who should thus be substantially less receptive to their effects, were the most likely to yield to them. Supporters of ‘sincere’ voting were, consistently, less prone to violating their initial preferences. These results, especially the counter-intuitive ones, are confirmed by the specific attitudes towards poll reliability and usefulness displayed by switching voters vs. non-switchers. Switchers deem pre-election polls to be comparatively less reliable (3.84 on the seven-point scale vs. 4.06 among non-switchers) and less useful (3.47 vs. 3.71). None of the differences commented here, however, is statistically significant.
After having expressed their final vote, participants in the study were asked to indicate how resolute they were in their decision and how difficult it was to make this choice. In regard to these variables, we may compare not only switchers with non-switchers, but also each of these subsamples with voters belonging to Groups 0A and 0B (see above and Table A1), who were subject to a ‘standard’ simulation. One might expect switchers to be, with respect to Groups 0A and 0B, less resolute in their final choice (in that they are not voting for their preferred candidate) and admit to having encountered greater difficulty in making their choice. Similarly, non-switchers might also be expected to be, with respect to Groups 0A and 0B, less resolute in their final choice (in that they are voting for a candidate who is predicted to lose) and acknowledge greater difficulty in making their choice. It is more challenging to express a persuasive hypothesis as regards the comparison between switchers and non-switchers.
Table 6 shows these expectations effectively hold as regards switchers, that is, voters influenced by pre-election polls that were negative for their preferred candidate: such voters are less resolute and more prone to admitting to difficulty in their decision making. Non-switchers, however, defy expectations, expressing relatively high degrees of resoluteness and low levels of difficulty. Within the subset of non-switchers, one might expect members of Group 2 (who decided not to transfer their vote to their second preferred candidate, even though this may have facilitated the success of the least preferred candidate) to be more conflicted than non-switchers in Group 1 (whose non-switching had no particularly negative consequence beyond the victory of the second preferred candidate). Yet, the two non-switcher subsets display the same level of resoluteness, and the Group 2 non-switchers are less prone than their Group 1 equivalents to decision-making difficulty (22 vs. 41%).
Incidence of resolute voters and voters encountering difficulty in their final voting decision (percentages)

Ns in parentheses.
Another set of hypotheses that may be explored regards the political relationship, so to speak, between voters’ first and second preferred candidates. For example, one might reasonably expect voters to be more willing to switch when both the first and second preferred candidates belong to the same half of the political spectrum, that is, when they both belong to the (far or moderate) left or to the (far or moderate) right, compared with situations when the two preferred candidates belong to different halves of the spectrum (this latter situation is relatively infrequent, occurring in little more than one out of four cases). This expectation, in the event, is only weakly reflected in the results: when both preferred candidates belonged to the same half of the political spectrum, 11% of voters (16 out of 146) switched to the second preferred candidate; when the two preferred candidates belong to different sides, only 7% of voters (three out of 42) did so.
Are voters who initially prefer candidates located at one of the extremes of the ideological spectrum (far left or far right) more likely to switch compared with voters who initially prefer one of the two more moderate candidates? One might assume that an extreme voter is less willing to switch than a moderate one, because the extreme preference signals a more intransigent attitude, or vice versa, that a moderate voter is less willing to switch in that he/she finds voting for an extreme candidate excessively objectionable. In any case, the difference between the two groups – that is, centripetal and centrifugal voters – is noteworthy: 16% of voters (13 out of 80) initially preferring extreme candidates switched to the second preferred candidate vs. 6% of voters (five out of 87) initially preferring moderate candidates.
Discussion
On the whole, voters participating in our simulated election campaign displayed somewhat negative attitudes towards pre-election polls: such polls, more often than not, are deemed useless (if not dangerous) and unreliable. This appears to be more the case among young people, who also have more consistent attitudes (linking reliability and usefulness). During the actual campaign simulation, pre-election polls were not used extensively as an information source by voters: on average, only one flow item out of four was accessed; over 40% of participants ignored the polls; participants with higher levels of education and interest in politics resorted to this information source more often than others. Absolute and relative indicators of poll usage produced similar, but not identical, results.
As regards the part of the study in which voters were forcibly exposed to polls that reported unfavourable predictions for their preferred candidates, again, pre-election polls seemed to enjoy little traction: only one-tenth of voters switched their votes, even though doing so would favour a second preferred candidate, and in some cases, contribute to defeating the least preferred candidate. Determining whether or not one-tenth is a noteworthy portion of voters (and ignoring the issue of statistical significance) is almost a question of taste: it may not seem like much if one considers that all voters in this part of the study had a good incentive to switch; however, it is often more than enough to decide an election.
In addition, vote-switching appeared to be more widespread among groups of voters who should have been – in light of their reported attitudes towards them – comparatively less receptive to pre-election polls. Switchers and non-switchers perceive their final voting decisions in appreciably different ways; namely, the latter are more resolute in their choices and confess to encountering lower degrees of difficulty.
It is possible that voters’ tendency to switch could be encouraged by increasing the margin separating predicted winners and voters’ preferred candidates (from the 4–5 percentage points used in this study to, say, 10 points). As the great majority of participants (especially among younger voters) judged the simulated campaign to be realistic, our findings should, nevertheless, be taken seriously: pre-election polls do not perform an important heuristic function for Italian voters.
Acknowledgements
Additional data collection was performed by Andrea Fabbri (see Research Unit F, below), towards whom the authors express their appreciation. Preliminary versions of this article were delivered as papers at the 65th World Association for Public Opinion Research Annual Conference (Hong Kong, June 2012) and the 26th Italian Political Science Society Annual Conference (Rome, September 2012).
Financial Support
This article reports a subset of findings of a research project called ‘Electoral Choice: Voters’ Heuristic Strategies and Information Processing’, which was carried out within the framework of the 2008 PRIN initiative (Programmi di Ricerca Scientifica di Rilevante Interesse Nazionale, i.e., Scientific Research Programmes of Significant National Interest), funded by the Italian University and Research Ministry (grant no. 2008XZR2TT). The project was directed by Piergiorgio Corbetta of the University of Bologna and carried out by research units associated with the Universities of Bologna, Modena, and Reggio Emilia, Turin, and Salerno.
Data
The replication dataset is available at http://thedata.harvard.edu/dvn/dv/ipsr-risp
Appendix
The online election campaign simulation – developed ex novo for this project – begins by describing the election campaign setting, asking participants to imagine that they have moved to a new city that will be electing a new mayor in a few weeks. The four candidates are introduced at the beginning of the campaign by displaying their names and photos.
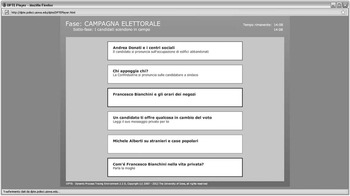
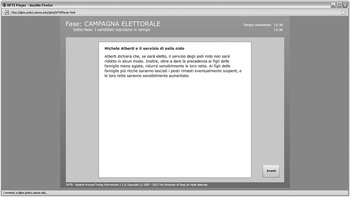
The campaign consists in a set of news items scrolling down the computer screen (flow items), which the voter can choose to open by clicking on them. The initial item boxes comprise a short text, such as those that appear in Figure A1 (which is an actual snapshot of the simulated campaign). The voter may (or may not) click on any box in order to access more detailed information, such as the text that appears in Figure A2; the more detailed box remains open until the voter decides to close it and return to the ongoing flow. The boxes have frames that are colour-coded when the corresponding items evidently refer to a specific candidate: each of the candidates is associated with a distinctive (politically neutral) colour. The campaign may be temporarily interrupted by timed items displaying information independently of the voter’s will. The DPTE records which flow items attract the voter’s attention (i.e. are actively accessed).
According to the original sampling frame, each of the eight following subgroups was supposed to be equally represented in the target sample (and the achieved sample closely mirrored this distribution)Footnote 12:
An example of flow items scrolling up the screen during the simulated election campaign.

An example of an accessed flow item.


Distribution of actual participants by research unit and campaign group

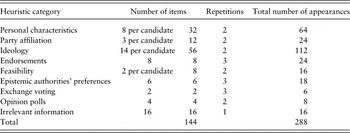
Heuristic categories, number of items, and number of appearances during a typical simulated campaign

The campaign is defined by the contents of the flow and timed items that are programmed into the simulation; these contents must reflect the types of heuristic we wish to explore. In this study, some types of heuristics were available for all voters, whereas others were made available only to subsamples, in an attempt to implement quasi-experimental research designs. The final sample comprises 895 participants, distributed among six different research units, which operated in different areas of Italy and pursued partly distinctive research goals. Within each research unit, participants were randomly assigned – according to pre-established quotas – to one of four groups that were associated with different potential heuristic profiles (Table A1). We hereby briefly describe the general heuristic categories. Personal characteristics are represented by 32 items (eight for each candidate) concerning candidates’ age, family, religious orientation, level of education, occupation, social commitment, personality, and previous political experience. Party affiliation is represented by 12 items pertaining to candidates’ party membership and being endorsed by two specific parties. Ideology, the heuristic that was most widely represented in the simulated campaign, is operationalized via 56 items pertaining to candidates’ positions on 14 different issues associated with seven politically relevant dimensions. Endorsements have to do with eight items expressing endorsements for one of the candidates by non-party organizations (religious associations, trade unions, etc.). Feasibility concerns the candidates’ self-professed ability to win the elections or to govern the city effectively (eight items). Epistemic authorities’ preferences correspond to the voting intentions and opinions on candidates’ platforms expressed by three of the voter’s significant others (six items). Exchange voting deals with personalized election promises addressed to the voter by a specific candidate directly and via a relative of the voter (two items). The opinion poll heuristic is expressed through four items announcing the results of a pre-election poll (see main text). Finally, 16 items deal with irrelevant information (news stories concerning celebrity gossip, scientific discoveries, disasters, etc.); these items perform a mere ‘distraction’ function and may serve as a benchmark for more pertinent heuristics.
The total number of flow items for Group 0A participants is thus 144; each item appears a predetermined number of times during the campaign (Table A2); the order of appearance is strictly random. Since a new flow item appears on the screen every three seconds, a Group 0A campaign (comprising 144 items and 288 distinct ‘shows’) lasts about 14-and-a-half minutes, plus approximately another minute for a set of 4 video ads that are displayed to all voters. Campaigns for other groups have a slightly longer or shorter duration, according to the specific heuristic profile employed.