Introduction
Starburst amacrine cells (SACs) of rabbit retina, identified in Golgi preparations, form two mirror-symmetric populations, serving ON and OFF pathways through the retina (Famiglietti, Reference Famiglietti1981, Reference Famiglietti1983a) and play a critical role in the retinal mechanism of directional selectivity, the latter first modeled from the visual responses of directionally selective (DS) ganglion cells (GCs) (Barlow et al., Reference Barlow, Hill and Levick1964; Barlow & Levick, Reference Barlow and Levick1965). The two populations of SACs were found to costratify in the inner plexiform layer (IPL) with the two levels of branching of type 1 bistratified (BS1) GCs (Famiglietti, Reference Famiglietti1981, Reference Famiglietti1983b, Reference Famiglietti1987, Reference Famiglietti1992b, Reference Famiglietti2002), proposed (Famiglietti, Reference Famiglietti1981, Reference Famiglietti1983b), and later identified as the ON-OFF DS GCs (Amthor et al., Reference Amthor, Oyster and Takahashi1984). Moreover, the principal synaptic output of SACs is directed to GCs (Famiglietti, Reference Famiglietti1983b, Reference Famiglietti1991), mainly BS1 and other DS GCs (Famiglietti, Reference Famiglietti1992b, Reference Famiglietti2005).
The distinctive neural architecture of SACs proclaimed their identity with cholinergic ACs (Famiglietti, Reference Famiglietti1981, Reference Famiglietti1983a), shown to synthesize acetylcholine (ACh) (Masland & Mills, Reference Masland and Mills1979). A functional relationship between SAC and DS GC was further suggested by studies showing powerful, excitatory nicotinic cholinergic effects on DS GCs (Masland & Ames, Reference Masland and Ames1976; Ariel & Daw, Reference Ariel and Daw1982a). SACs were also shown to contain choline acetyltransferase (ChAT), the synthetic enzyme for ACh (Famiglietti & Tumosa, Reference Famiglietti, Tumosa, Agardh and Ehinger1986; Brandon, Reference Brandon1987; Famiglietti & Tumosa, Reference Famiglietti and Tumosa1987). Unexpectedly, GABA was also found in SACs of rabbit retina (Brecha et al., Reference Brecha, Johnson, Peichl and Wässle1988; Vaney & Young, Reference Vaney and Young1988). GABA is present in more than one third of rabbit retinal ACs (Mosinger & Yazulla, Reference Mosinger and Yazulla1987), but its co-localization in SACs could have major significance for the DS mechanism (e.g., Vaney, Reference Vaney, Osborne and Chader1990), as blockade of GABAA receptors eliminates directional selectivity in DS GCs (Wyatt & Daw, Reference Wyatt and Daw1976; Caldwell et al., Reference Caldwell, Daw and Wyatt1978; Ariel & Daw, Reference Ariel and Daw1982b). Indeed, calcium signals in dendritic segments of type b SACs are DS (Euler et al., Reference Euler, Detwiler and Denk2002).
Multielectrode recording of GC populations in previsual developing perinatal retina demonstrated waves of activity passing across the retina (Meister et al., Reference Meister, Wong, Baylor and Shatz1991), when blockade of retinal activity blocks the eye-specific segregation of retinogeniculate afferents (Shatz & Stryker, Reference Shatz and Stryker1988). These waves, defined in rabbit as “stage II waves” (Syed et al., Reference Syed, Lee, Zheng and Zhou2004), were eliminated by nicotinic cholinergic antagonists (Feller et al., Reference Feller, Wellis, Stellwagen, Werblin and Shatz1996) that also interrupted segregation of retinogeniculate afferents (Penn et al., Reference Penn, Riquelme, Feller and Shatz1998). Cholinergic receptors on perinatal rabbit GCs (Masland, Reference Masland1977), the cholinergic identity of SACs, the presence of GABA in SACs, and the important developmental role of GABA in the brain (for review see Ben-Ari et al., Reference Ben-Ari, Khazipov, Leinekugel, Caillard and Gaiarsa1997), suggested to us an additional developmental role for SACs and prompted our initial immunocytochemical studies of the development of cholinergic and GABAergic neurotransmitter-related molecules in rabbit retina (Famiglietti & Sharpe, Reference Famiglietti and Sharpe1994).
Despite numerous physiological and pharmacological studies of rabbit SACs and their postsynaptic GCs, no comprehensive study of the postnatal expression of markers for cholinergic and GABAergic neurotransmission has been published for rabbit retina. The present immunocytochemical study demonstrates the postnatal (P) development from birth (P0) to P13 of ChAT, GABA, two glutamate decarboxylases (GAD65 and GAD67), and the GABA transporter GAT1 in rabbit amacrine cells (ACs). Recent studies of the relationship of SAC activity to retinal waves in rabbit retina (Zhou, Reference Zhou1998; Zhou & Zhao, Reference Zhou and Zhao2000; Zhou, Reference Zhou2001; Syed et al., Reference Syed, Lee, Zheng and Zhou2004; Zheng et al., Reference Zheng, Lee and Zhou2006) allow a temporal correlation and developmental analysis of neuronal responses and neurotransmitter expression, based on the immunocytochemical studies described in this report. Moreover, increasing presence of ChAT- and GABA-immunoreactivity (IR) in SACs, documented here during the first two postnatal weeks, correlates with the emergence of directional selectivity in DS GCs (Masland, Reference Masland1977).
Materials and methods
Golgi impregnation
The tissue preparation, Golgi impregnation, and analytical methods for studying retinal neurons have been laid out in detail elsewhere (Famiglietti, Reference Famiglietti1985, Reference Famiglietti1992a,Reference Famigliettib). A synopsis of these methods is presented here, as they pertain specifically to the early postnatal period. Briefly, black or brown rabbits up to 10 days of age from a mixed pigmented New Zealand background were enucleated, following euthanasia by approved protocols. The retinas were isolated from the posterior half of the eye under dim light in fixative consisting of 3% purified glutaraldehyde in 0.2 m cacodylate buffer supplemented by 0.04 m calcium chloride and were flattened by making radial cuts from the periphery toward the center. Each was then mounted in a sandwich of filter paper, which was held flat by a coverslip and rubber bands on a glass slide and was fixed for a further 2–3 h in the same fixative. The slide was immersed in a 5% glutaraldehyde–6% potassium dichromate mixture, and then in 1% silver nitrate, for a few days each. Retinas were dehydrated in ethanol and mounted whole on glass slides either in DPX or in sheets of Epon/Araldite. Whole mounts were viewed in a Zeiss microscope fitted with a drawing tube, and camera lucida drawings were made at initial magnifications ranging from 670 to 2000×. Photomicrographs were exposed digitally in a Zeiss microscope fitted with a five megapixel camera operating in RAW mode, using a 40× Neofluar objective lens, numerical aperture (N.A.) 0.75 (Fig. 1c), or a 100× Neofluar lens, N.A. 1.0 (Fig. 1e). Images were processed in Adobe Photoshop 6 for contrast and brightness.
Postnatal development of SAC morphology in whole-mounted Golgi preparations. (a) Camera lucida drawing of type b (displaced) SAC in ventral retina of adult rabbit. Synaptic boutons are confined to the distal annular dendritic zone, and dendrites of the intermediate zone are very slender. (b) Type b SAC in peripheral retina at postnatal day 5 (P5). Dendrites have a conventional (gradual) taper, and they are decorated with many dendritic appendages, but lack synaptic boutons. (c) At P10, shortly before eye opening, a type b SAC exhibits typical features of adult cells: thicker dendrites of the proximal dendritic zone, very thin dendrites of the intermediate zone, and boutons in the distal zone. The unistratified dendritic tree costratifies with the sublamina b branching of a BS1 (ON-OFF DS) GC, and its distal dendrites track those of the GC (arrows). (d) Graph of variation in dendritic field size of SACs with ventral distance from the visual streak. For adult retina type a (normally placed) and type b (displaced), cells are graphed separately. A straight line is fitted to the P5 data, and LOWESS curves to the data from P10 and adult. Filled symbol: type a, open symbols: type b. (e) Composite digital photomicrograph of optical sections through type a cone bipolar cell extending through 40 μm of depth in P5 retina: dendrites above, axon terminals below. Scale bars, 100 μm in (a), (b), and (c); 10 μm in (e).

Immunocytochemistry
Well-characterized primary antibodies used in this study were as follows: (1) rabbit anti-human ChAT, a gift of Louis B. Hersh, available as Chemicon AB143, for developing retina; (2) rabbit anti-chick ChAT, #1465, a gift of Myles Epstein, for adult retina; (3) anti-GABA, Chemicon MAB316; (4) mouse anti-rat GAD, GAD-6 (Gottlieb) from Developmental Studies Hybridoma Bank, University of Iowa, Iowa City, Iowa, specific for lower molecular weight GAD; (5) rabbit anti-cat (recombinant_DNA) GAD, “K2” (Kaufman/Tobin), Chemicon AB108, specific for higher molecular weight GAD; and (6) rabbit anti-GABA transporter-1 (c-terminus), a gift of N.C. Brecha via W.K. Stell, available as Chemicon AB1570. Monoclonal and polyclonal primary antibodies were combined in double-staining protocols. Because of the immunological characteristics of these antibodies, the most selective primary antibodies could readily be combined only in certain pairs, for example, anti-ChAT with anti-GABA or anti-GAD65, anti-GAD67 with anti-GABA or anti-GAD65, and anti-GAT1 with anti-GABA or anti-GAD65.
For developmental studies, rabbits of a pigmented New Zealand red strain, with darkly pigmented eyes, were bred in the University of Calgary animal facility, and experiments were conducted in conformity with University guidelines. Retinas were harvested at P0 (day of birth), and each following postnatal day through P9, as well as at P11 (about the time of eye opening) and P13. Adult eyes were harvested from adult female New Zealand red and New Zealand white rabbits. Adult rabbits were premedicated prior to tracheal intubation and then anesthetized with halothane. Eyes were enucleated successively under anesthesia, after which the animal was euthanized according to approved protocols. Perinatal rabbits were cooled and then decapitated. The anterior segment of the eye was removed in phosphate-buffered saline (PBS), and the posterior eyecup placed in fixative, consisting of 4% paraformaldehyde and 0.1% glutaraldehyde in 0.1 m Sorensen’s Phosphate buffer at pH = 7.2 for 15 min at room temperature. Enucleation and tissue fixation were carried out under ambient room light. After an hour in the same fixative at 4°C, the eyecups were left overnight in 4% paraformaldehyde buffered at pH = 10.4 by carbonate–bicarbonate buffer. The next day, after two 30 min rinses with and without sodium borohydride, the retina was dissected from the eyecup and cut into the required pieces. Pieces intended for frozen sectioning were placed in 30% sucrose with 0.1% sodium azide overnight. Material for sectioning was mounted in low-temperature agar, sectioned at −20°C generally at 12 μm. Sections were mounted on Fols subbed slides, stored at −20°C until processing.
Thawed slide-mounted sections were incubated in 10% normal goat serum for 30 min, rinsed in PBS, and then incubated overnight, within a humid chamber at room temperature, in primary antibody diluted in PBS containing sodium azide and Triton X-100, typically at 0.03%. Double labeling was usually employed and was achieved by using secondary antibodies conjugated to different fluorophores. After two PBS washes, sections were incubated in secondary antibodies appropriate to primary antibodies, conjugated either to FITC or to Cy3 for up to one and one-half hours, followed by two washes in PBS and mounting in glycerin or Fluorosave R. Slides were checked and then stored at −20°C for up to 2 weeks prior to photomicrographic documentation.
For the topographic analysis of ChAT-immunoreactive cells in adult rabbit retina, enucleated eyes of New Zealand white rabbits were cut around the limbus and the eyecups containing retina were separated from anterior segment and vitreous body. Eyecups were fixed for 2 h in 4% paraformaldehyde at 4°C. Each retina was then dissected from the choroid and optic nerve, and two cuts were made at the medullary rays. Retinas were washed twice for 30 min in 0.1 m PBS containing 5% sucrose. Each retina was transferred to 1 ml of 10% normal goat serum for 1 h at 4°C, then drained and placed in primary antibody: rabbit anti-chick ChAT at a dilution of 1:2000 at 4°C. After 3 days, primary antibody was changed, and at 6 days, retinas were washed in PBS and placed in secondary antibody overnight. After washing in PBS, retinas were placed in peroxidase–antiperoxidase at 1:250 for 3 h. Diaminobenzidine was applied for 10–12 min after PBS wash. After further washing in PBS, retinas were soaked for 2 h in 3:1 glycerin–PBS, then further radial cuts were placed to flatten the retina. Retinas were whole mounted on slides in the same glycerin–PBS mixture and the coverslips sealed with nail polish.
Slides of sectioned postnatal material were photographed in a Zeiss Universal fluorescence photomicroscope, using band-pass filter sets (Omega Optical, Inc., Brattleboro, VT) for FITC (ex. 485DF22; em. 530DF20 nm) and Texas Red (ex. 555DF27; em. 615DF45) to adequately separate signals from FITC and Cy3 fluorescence in the same double-labeled section. Water immersion Neofluar 16 and 25× lenses were used to image the fluorescent labels, and 35-mm film was exposed, either in black and white (Kodak T-MAX 400) or in color (Ektachrome Elite 400). Digital images were made from film or prints and were processed in Adobe Photoshop for contrast and brightness. Graphs were constructed in Sygraph (Systat™, Systat Software, Inc., Chicago, IL).
As a supplement to the analysis of stratification in the IPL, optical densitometry was used to quantify the positions of immunocytochemically demonstrated bands of label in transverse sections of retina. Photographs of individual sections, all printed at the same magnification, were digitized and imported into Image J, 1.40 g (NIH Image, rsbweb.nih.gov/ij/index.html), and densitometry performed using gel analysis software. Scans were compared in double-stained preparations. In comparisons of single stained preparations, scans were adjusted if necessary to equivalent thickness of the IPL. In the latter case, scans were generally aligned with reference to ChAT-IR to compare patterns of stratification for ChAT-, GABA-, GAD67-, GAD65-, and GAT1-IR.
Quantitative analysis of ChAT-immunoreactivity
Counts in developing retina were made of fluorescent ChAT-immunoreactive cells in the ganglion cell layer (GCL) in photomicrographs of cryosections from P0–P4, P7–P9, P11, and P13 rabbit retinas. Blocks of retina, measuring 500 μm to 1 mm in length, were sectioned in a plane perpendicular to the (horizontal) visual streak. This orientation has the advantage in central retina of including topographic features, such as the medullary rays with their prominent vascular loops, and/or the visual streak, allowing precise determination of retinal position in the sample. On the other hand, summation of the count perpendicular to the visual streak and to the vertically compressed isodensity lines in central retina has the effect of moderate “blunting” of topographic resolution centrally. Because the selection of photographed fields of immunofluorescent cells was not performed in random fashion, the peripheral fields sampled, where density is lowest, may have exhibited a higher density of cells than would be expected by random sampling. Counts of essentially spherical fluorescent cell bodies, ranging in average size from 9.5 to 12 μm in diameter, varying with age and with individual specimen, were made in 12-μm sections. Counts were corrected by Abercrombie’s method #1, considered adequate for the purposes of this study. Thus, the corrected count, P, is calculated from the expression A(M/(L + M)), where A, the actual count, is multiplied by a factor determined from the section thickness, M, and the diameter of the cell body, L. Because the retinal GCL in rabbit retina is essentially a monolayer, computing retinal areas for cell density measurements was a simple calculation: the product of section thickness and the linear extent of the GCL in the photographed field.
Counts in adult retina were made in whole-mounted retinas. These were initially traced at 10× and transferred to millimeter graph paper in microscope stage coordinates. A retina was chosen in which both well-stained ChAT-immunoreactive cells and lightly background-stained non-ChAT-immunoreactive displaced AC and GC bodies could be visualized in the GCL. The visual streak was carefully mapped, and then, locations for sampling along two vertical transects passing through the visual streak were measured and mapped. Samples were taken at 0.5- or 1-mm interval along these transects, using a 50× N.A. 1.0 oil immersion lens, a circular eyepiece graticule, and a Zeiss drawing tube. Camera lucida drawings were made of all neurons in the GCL in each field, 247 μm in diameter at 725× magnification.
Estimating the percentage of developing SACs labeled by ChAT-immunoreactivity
For the purposes of the present study, the provisional assumption was made that local ratio of SACs to GCs in the GCL, determined in adult retina, also applies to the developing retina. Corrections were made for the postnatal developmental decrease in GC number, a 26% loss, from about 380,000 to about 280,000 in adult albino retina (Robinson et al., Reference Robinson, Dreher and McCall1989). We have assumed a 26% loss of SACs, based on quantitative studies of cell death in mouse retina showing comparable losses of AC and GC (Young, Reference Young1984). A reasonable estimate of 150,000 type b SACs has been made for adult rabbit retina (Vaney, Reference Vaney, Osborne and Chader1990). A similar estimate can be calculated from the results of the present study, multiplying the density of type b ChAT-labeled cells in the GCL in midventral retina (300–350/mm2, see Fig. 13, below) by the area of adult rabbit retina (450–500 mm2). Consequently, the expected number of type b cells at birth is 150,000/0.74, or approximately 203,000. The uniformity of size and appearance of SACs in the first postnatal week (Fig. 1b and 1d, below, and Wong & Collin, Reference Wong and Collin1989) suggests a relatively uniform density distribution of SACs in that period and supports a calculation of 1800 type b cells/mm2 in midventral periphery at P0, based on a retinal area of 113 mm2 (Robinson et al., Reference Robinson, Dreher and McCall1989). Similar estimates of density were made for P6, P11, and P19 retinas, based on retinal areas and counts of GCs in the work of Robinson et al. (Reference Robinson, Dreher and McCall1989).
In order to extract topographic densities of GCs, with regard to distance from midvisual streak, from published maps of GC density (Robinson et al., Reference Robinson, Dreher and McCall1989), vertical transects were drawn through these illustrated retinas and distances calculated between the mapped isodensity lines, enabling the graphing of GC densities in these retinas. Predicted curves for the topographic variation of SAC were drawn, based on the topographic variation of the starburst AC/GC ratio determined in the adult. Because of the rapid rise in GC density with proximity to the visual streak, no attempt was made to estimate the numbers of displaced SACs near the streak, although in the first postnatal week, these curves are probably linear extensions from peripheral retina to midvisual streak (dvs = 0.0). Corrected densities of ChAT-immunoreactive cells in the GCL, calculated from counts in frozen sections, were plotted and then superimposed on these curves, to arrive at an estimate of the percentage of displaced (type b) SACs exhibiting ChAT-IR from P0 to P13.
Results
Development of SACs in rabbit retina
In adult rabbit retina, SACs exhibit a distinctive radial symmetry (Fig. 1a), from which their name derives (Famiglietti, Reference Famiglietti1981). Three concentric dendritic regions consist of a “proximal dendritic zone” of thicker dendrites, an “intermediate dendritic zone” of very thin dendritic branches, and a “distal dendritic zone,” where synaptic boutons (Famiglietti, Reference Famiglietti1985) and synaptic outputs to GCs occur (Famiglietti, Reference Famiglietti1983b, Reference Famiglietti1991). SACs are of two mirror-symmetrical types, type a (normally placed) cells and type b (displaced) cells (Famiglietti, Reference Famiglietti1983a). Narrowly stratified dendrites of the former branch in the middle of sublamina a and of the latter in the middle of sublamina b of the IPL, both labeled by ICC using antibodies to ChAT (Famiglietti & Tumosa, Reference Famiglietti and Tumosa1987). Type b cells are more accessible to microelectrodes and optical imaging in living whole-mount preparations and are the type that has been studied physiologically. All cells illustrated in Fig. 1 are type b cells.
At 5 days after birth (P5), SACs exhibit recognizable features, including radial symmetry and narrow dendritic stratification in the IPL, as well as a distal annular concentration of dendritic branches (Fig. 1b). At this age, dendrites are studded with numerous, long dendritic appendages, most of which are tipped with filopodia and growth cones. Rapid retinal development ensues after P5, and at P8, synaptic boutons have formed in the distal dendritic zone of the SAC’s larger dendritic fields, but dendrites retain conventional centrifugal taper: graded attenuation from soma to perimeter (data not shown). At P10, however, the adult pattern of radical dendritic attenuation is evident in the intermediate zone (Fig. 1c), and except for dendritic field size, SACs differ little from adult cells.
At P5, SACs exhibit only a small difference in dendritic field size and general appearance, when examples from central and more peripheral retina are compared (Fig. 1d). By P10, an increased gradient is observed, as well as a polyphasic gradient, characteristic of adult retina (Fig. 1d).
Immunohistochemistry of cholinergic and GABAergic systems in adult rabbit retina
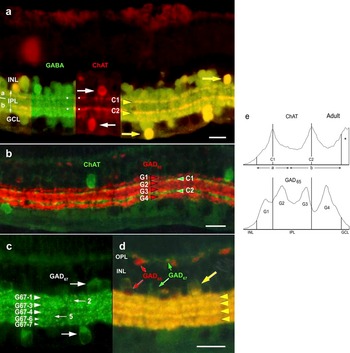
An essential point of reference for the present developmental studies of SACs that use immunocytochemical methods, the neurohistology of adult SACs is displayed in transverse sections of the retina, double labeled for ChAT- and GABA-IR (Fig. 2a). Single labeling for each marker is illustrated in two adjacent rectangular regions (left side in Fig. 2a) in which only the red channel (ChAT) or the green channel (GABA) is displayed. ChAT-IR labels SACs (Famiglietti & Tumosa, Reference Famiglietti, Tumosa, Agardh and Ehinger1986, Reference Famiglietti and Tumosa1987), the only cholinergic neurons in adult rabbit retina, and shows their mirror-symmetric organization: cell bodies on either side of the IPL (horizontal white arrows, Fig. 2a) and the narrow dendritic stratification of normally placed type a cells in the inner nuclear layer (INL) and type b cells displaced to the GCL, the former branching in sublamina a and the latter in sublamina b (dots, red channel, Fig. 2a).
Double-label ICC of adult rabbit retina in vertical sections. (a) A single section, double labeled for ChAT-IR (red) and GABA-IR (green), shows many GABA-immunoreactive cell bodies in the INL, adjacent to the IPL, and some GABA-immunoreactive cell bodies in the GCL. ChAT-immunoreactive SACs are mirror symmetrical about the a/b sublaminar border of the IPL with cell bodies (white arrowheads) in the INL (type a) and the GCL (type b). Two narrow bands of immunoreactive dendrites lie in the middle of the IPL’s sublamina a (a) and sublamina b (b), respectively, and these coincide with heavily labeled GABA-immunoreactive bands (white dots), as is evident in a double exposure (right side), in which double-labeled SAC bodies (arrows) and dendrites (arrowheads) are yellow. (b) Section double labeled for ChAT-IR (green) and GAD65-IR (red) illustrates lack of co-localization of the two markers. Four bands of GAD65-IR (G1–G4) span the IPL (rightward arrowheads), and the characteristic two bands of ChAT-immunoreactive starburst dendrites (C1 and C2, leftward arrowheads) lie in the gaps between G1 and G2 in sublamina a and between G3 and G4 in sublamina b. Typically, little GAD65-immunoreactive cell body labeling is observed in the INL and virtually none in the GCL of adult retina. (c) The pattern of GAD67-IR is more complicated than that of GAD65-IR. GAD67-immunoreactive cell bodies are labeled in both the INL and the GCL. Major bands of label (G67-1, G67-3, and G67-4) align with G1, G2, and G3 bands of GAD65-IR, but the portion of the IPL adjacent to the GCL, coinciding with the G4 band, appears to be split in two (small arrowheads, G67-6 and G67-7). Additionally, there is scattered punctate labeling in two bands (G67-2 and G67-5) corresponding to the positions of the two ChAT-immunoreactive bands, C1 and C2 (small arrows). (d) Section double labeled for GAD65-IR (red) and GAD67-IR (green), in a double exposure, shows that occasional AC bodies in the inner INL are lightly labeled, and horizontal cell bodies and thick processes in the outer INL and OPL may be heavily labeled with GAD65-IR (red arrows). Other AC bodies in the INL and GCL, as well as thin processes in the OPL, are GAD67-immunoreactive (green arrows). Occasional cell bodies in the INL are double labeled (large arrow). The four bands of GAD65-IR dominate in this double exposure (see text). (e) Optical density scans of the IPL in adult rabbit retina, double labeled for ChAT- and GAD65-IR. Two scans of the same area, perpendicular to the IPL, one for each label, are vertically aligned, illustrating the fact that the C1 band of ChAT-IR is positioned between the G1 and G2 bands of GAD65-IR and the C2 band between the G3 and G4 bands. Region indicated by asterisk marks the edge of a ChAT-immunoreactive cell body in the GCL. Scale bars, 20 μm. Bar in (d) applies to (c) and (d).

GABA-IR (green channel, Fig. 2a) labels many normally placed AC bodies, as well as displaced cells. Labeling in the IPL of many closely packed strata yields a first impression of diffuse labeling, but slightly more prominent labeling of the two narrow bands of cholinergic SAC dendrites can be detected, when adjacent ChAT- and GABA-IR are compared (dots, red and green channels, Fig. 2a). Double labeling (right side, Fig. 2a) shows that a small fraction of GABA-immunoreactive cell bodies in the INL, along with a majority of displaced AC bodies, exhibits the ChAT-IR of SACs (yellow arrows, Fig. 2a), as shown previously (Brecha et al., Reference Brecha, Johnson, Peichl and Wässle1988). The double-labeled narrow bands of SAC dendrites are prominent (yellow arrowheads, Fig. 2a) against the background of other GABA-immunoreactive dendrites.
Double labeling with antibodies to ChAT and GAD65 (Fig. 2b) reveals a lack of co-localization, as previously shown (Brandon, Reference Brandon1987), both in cell bodies in the nuclear layers and in stratified dendritic processes of the IPL. GAD65-IR (red) is present in cell bodies at either border of the INL, marking horizontal cells and normally placed ACs, but is rarely seen in cell bodies of the GCL. While GAD65-IR is present from one border of the IPL to the other, it is concentrated in four bands (right-pointing arrowheads, G1–G4) and is sparse where the two bands of ChAT-immunoreactive SAC processes lie (green, left-pointing arrowheads). Optical density scans of the IPL in a single area of another preparation double labeled for ChAT- and GAD65-IR are illustrated in Fig. 2e. The scans confirm the lack of alignment of the ChAT- and GAD65-immunoreactive bands and are consistent with the evidence for lack of co-localization.
In contrast to GAD65-IR, GAD67-IR in adult rabbit retina is inconsistent in respect to the variable degree of labeling from one animal to another. In the most successful cases, cell bodies are well labeled in the INL, and also in the GCL, where the cell bodies of type b SACs lie (large arrows, Fig. 2c). Labeling in the IPL at first glance appears rather diffuse, but horizontal banding of punctate labeling (puncta) can be discerned, which for the most part follows the pattern of GAD65 labeling (larger arrowheads, Fig. 2c), except that the GAD65-immunoreactive G4 band appears to be split (smaller arrowheads). Furthermore, delicate punctate labeling can be seen between major (G1–G4) bands at levels of stratification where starburst/cholinergic ACs branch (small arrows, Fig. 2c), as shown previously (Famiglietti & Sharpe, Reference Famiglietti and Sharpe1994; Brandon & Criswell, Reference Brandon and Criswell1995), yielding a total of at least seven GAD67-immunoreactive bands.
Double labeling for GAD65 and GAD67 isoforms illustrates similarities and differences in their distribution in adult rabbit retina (Fig. 2d). GAD67-IR (green) labels some cell bodies in the GCL and some in the INL (small arrow) as well as fine processes in the outer plexiform layer (OPL), whereas GAD65-IR (red) labels other ACs at the inner border of the INL as well as thick processes of type a horizontal cells at its outer border (small arrows). Some AC bodies are double labeled, confirming the partial co-localization of the two GAD isoforms (large arrow). Co-localization in the IPL is suggested by the vivid yellow labeling of four bands (arrowheads in Fig. 2d). The predominance of the four bands in this double exposure is probably due to a higher density of GAD65-immunoreactive boutons in these bands and to the predominance of GAD65-IR in double-labeled boutons (Kaufman et al., Reference Kaufman, Houser and Tobin1991).
Perinatal transitory neurons bearing cholinergic and GABAergic markers
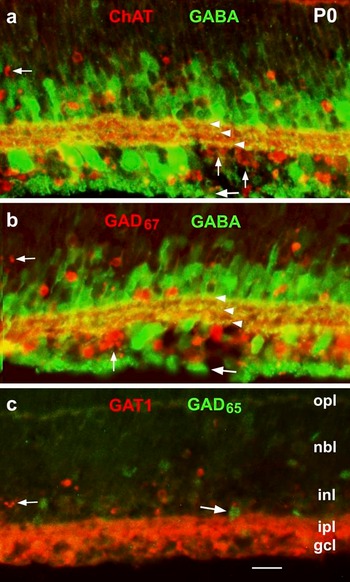
At birth (P0), the earliest developmental stage examined, ChAT-IR marks cell bodies in both the GCL and the incipient INL and labels the IPL diffusely (Fig. 3). Cellular fragmentation (apoptosis) is evident in many of the labeled cells in the INL (small horizontal arrow, Fig. 3a) and in most of the labeled cells in the GCL (small vertical arrows, Fig. 3a). In preparations double labeled for GABA-IR (Fig. 3a), there is no clear evidence for co-localization with apoptotic ChAT-immunoreactive neurons in the INL or GCL. GABA-IR labels a majority of AC bodies in the INL. Several of the labeled cell bodies in the GCL are too large, however, to be ACs, and their GC identity is further indicated by many axons coursing over the vitreal surface (large arrow, Fig. 3a). A novel tristratified pattern of GABAergic dendrites is evident in the IPL (white arrowheads, Fig. 3a and 3b), found at no later time during development.
Developmental expression of ICC markers in rabbit retina at birth (P0), in double-labeled preparations. (a) GABA-IR is present in small cell bodies in the INL and both small and large cell bodies in the GCL. In the IPL, three narrow strata of labeling are evident, marking the borders and the middle of the IPL (arrowheads in a and b). Immunoreactive GC axons course in loose bundles on the vitreal surface of the retina (large arrow in a and b). At P0, GABA-IR is uncorrelated with ChAT-IR. ChAT-IR is diffuse in the IPL, resides in different cell bodies in the INL and GCL, and includes fragmented cell bodies in the INL and GCL. Aggregates in the GCL are interpreted as apoptotic debris (small arrows). (b) Double labeling for GABA- and GAD67-IR shows the characteristic pattern of GABA-IR and a pattern of GAD67-IR indistinguishable from ChAT-IR, with prominent debris in the GCL (small arrows). (c) GAD65-IR is very faint at birth and is limited to the perikaryon of a few ACs in the INL (large arrow), while GAT1-IR exhibits the same pattern as ChAT- and GAD67-IR, including debris fragments (small arrow). Scale bar, 20 μm, applies to (a–c).

Polyclonal rabbit antibodies against ChAT and GAD67 made a double-labeling protocol using these two primary antibodies impractical. Nevertheless, it is evident in comparing Fig. 3a and 3b that the pattern of GAD67-IR is identical to that of ChAT-IR, with fragmented cell bodies in the INL (small horizontal arrow) and clusters of cellular fragments in the GCL (small vertical arrow, Fig. 3b). Double labeling for GABA-IR reveals, as for ChAT-IR, that there is no co-localization of GAD67-IR with GABA-IR. One may infer from the evidence presented in Fig. 3 that ChAT-IR and GAD67-IR are co-localized. Moreover, immunoreactivity for an antibody to the GABA transporter, GAT1, also gives the pattern of degeneration exhibited by ChAT-IR and GAD67-IR (Fig. 3c), including cellular fragments in the INL (small arrow). In contrast, GAD65-IR is very weak at P0 in this double-labeled preparation and is only present in a few scattered AC bodies in the INL (e.g., large arrow, Fig. 3c).
Postnatal development of ChAT-immunoreactivity
At P1, the pattern of ChAT-IR is very different from that at P0. Little debris is detected in the GCL, and instead, relatively small, scattered brightly labeled cell bodies are present, suggesting the first obvious ChAT-immunoreactive labeling of type b SACs (large arrows, Fig. 4a). Very light diffuse labeling of the IPL is present, as are rare cells in the position of type a SACs (small arrow, Fig. 4a). The process of the death of transitory cholinergic neurons is slower in the neuroblastic layer (NBL), and there, a later cohort of ChAT-IR cell bodies exhibits degeneration (arrowheads, Fig. 4a), as well as GAD67- and GABA-IR (see below, Figs. 5a and 6a), that continues to P4 in far peripheral retina.
Postnatal development of ChAT-IR. (a) At P1, labeling in the IPL is still diffuse, as at P0, but scattered cell bodies in the final position of displaced (type b) SACs are brightly labeled (long arrows) and a few in the position of normally placed (type a) SACs are faintly labeled (short arrow). Little apoptotic debris remains in the inner retina, but cell bodies of transitory ChAT-immunoreactive neurons in the neuroblastic layer appear to be undergoing apoptosis (arrowheads). (b) At P3, two narrow bands of ChAT-IR (arrowheads) emerge from the diffuse labeling of the IPL. (c) At P5, ChAT-IR differs little from that at P3, except that the two bands are more prominent. Optical density scanning was performed on boxed areas 1 and 2, and the results plotted in Fig. 10a. (d) By P7, the adult pattern emerges, and some type b cells (arrow) are also brightly GABA-IR (see Fig. 6c). (e) The fully adult pattern at P13 (arrow, type a cell). Scale bar, 20 μm, applies to (a–d).

Postnatal development of GAD67-IR. (a) At P1, labeling is indistinguishable from that of ChAT-IR (cf., Fig. 4a). Arrow indicates a brightly labeled cell body in the GCL. Arrowheads point to degenerating neurons in the neuroblastic layer. (b) At P3, the two narrow bands of starburst dendrites begin to emerge from the diffuse labeling of the IPL (arrowheads); cell body labeling in the INL is prominent. (c) At P6, the two narrow bands of label in the IPL are most readily seen (arrowheads). (d) At P8, diffuse labeling is somewhat diminished, but the two narrow bands of SAC dendrites are no longer visible. Faint cell body labeling in the middle of the INL (arrow) appears to mark Müller glia. (e) At P13, Müller cell labeling is more evident (vertical arrows), and other glial elements, possibly microglial, are labeled (horizontal arrows). Scale bar, 20 μm, applies to (a–e).

Postnatal development of GABA-IR. (a) A marked change from labeling at P0 is observed at P1, when the pattern converges with those of ChAT- and GAD67-IR (cf., Figs. 4a and 5a). Scattered brightly labeled cell bodies are seen in the GCL (large arrows). In the INL, a number of pyriform AC bodies are lightly labeled (small arrows). In the neuroblastic layer, weakly GABA-immunoreactive elements (arrowheads) occur in the location of degenerating neurons, seen more distinctly in ChAT- and GABA-immunoreactive preparations (cf., Figs. 4a and 5a). (b) At P4, the widespread labeling of AC and GC is reminiscent of that at P0, except that in the IPL, the trilaminar pattern of P0 is replaced by a bilaminar pattern (black arrowheads), detectable against diffuse labeling of the IPL. GABA-IR is observed in horizontal cells (white arrowheads). Type a and type b SAC bodies (arrows) and the two bands (black arrowheads) are double labeled for ChAT-IR (data not shown). (c) At P7, the adult pattern of GABA-IR is emerging, with multiple layers of labeling throughout the IPL, and the brightly labeled cell in the GCL are type b SACs. Significant numbers of GABA-immunoreactive GCs are still present, as attested by their cross-sectioned axons (arrows). (d) Optimum viewing of the multilayered stratification of GABA-IR in dendrites of ACs is afforded at P13, and seven narrow GABA-immunoreactive strata can be detected (small arrowheads). Boxed areas 1 and 2 were scanned, and the scans graphed in (e) and (f). White and black arrows indicate type a and type b starburst amacrine cells, respectively, which are also ChAT-immunoreactive (See Fig. 9). (e) Optical density scans of GABA-IR in boxed areas of (d); section double labeled for GABA-IR (d) and ChAT-IR (see double exposure in Fig. 9g). Six of the seven narrow bands are closely apposed to others, all together forming three distinct broader bands, comprising gb1, gb2, and gb3; gb4, gb5, and gb6; and gb7. The narrow bands are barely detectible by eye and by optical density scanning (cf., d and e). (f) Optical density scans of ChAT-IR in boxed areas of (d). The C1 and C2 bands of ChAT-IR (large arrowheads in d) align with the gb2 and gb5 bands of GABA-IR, where the two markers are apparently co-localized. Asterisks indicate the presence of thick primary dendrites of ChAT-immunoreactive cells at either border of the IPL. Scale bar, 20 μm, applies to (a–d).

ChAT-immunoreactive labeling of the narrowly stratified dendrites in the location of SAC dendrites is occasionally detectable in some preparations at P1 (data not shown) but is generally first evident at P2 in limited parts of central retina. At P3, two narrow substrata are seen throughout the retina (black arrowheads, Fig. 4b), against a background of diffuse labeling of the IPL. Labeling is initially more prominent in sublamina a than in sublamina b. Labeled cell bodies are widely scattered at P3 but are readily seen at P4 (data not shown). After P5, a pattern similar to that of the adult rapidly emerges, as observed at P7 (Fig. 4d), with brightly labeled type a and type b SAC bodies, two narrow bands of labeling in the IPL and a considerable reduction of diffuse labeling. ChAT-IR in P13 retina (Fig. 4e) is virtually indistinguishable from that observed in adult retina.
Development of GAD67-immunoreactivity
At P1, the pattern of GAD67-IR is identical to that of ChAT-IR, as at P0. Scattered, small brightly labeled cell bodies are present in the GCL (arrow, Fig. 5a), almost certainly the type b SACs apparently labeled by ChAT-IR at this stage (cf., Fig. 4a). In the upper INL, where it interdigitates with the neuroblastic layer, a cohort of GAD67-immunoreactive cells is undergoing fragmentation, like the ChAT-immunoreactive cells at P1.
At P3, diffuse labeling of the IPL increases slightly, as with ChAT-immunoreactive labeling, but the narrow bands of SAC dendrites can now be detected (arrowheads, Fig. 5b). GAD67-IR begins to diverge from ChAT-immunoreactive labeling at this stage, however, as many other GABAergic cell bodies label prominently in the proximal INL. At P6, the starburst substrata are most clearly visible against a relatively high background of diffuse labeling in the IPL (arrowheads, Fig. 5c), a pattern in the IPL that resembles that of ChAT-IR at P3–P5 (e.g., Fig. 4b).
At P8 (Fig. 5d), the starburst substrata are no longer visible, and the diffuse background labeling, seen at P6, is diminished in the outer 80% of the IPL, without the appearance of any narrow strata or puncta, indicative of neuronal labeling. Instead, the appearance of somatic labeling in the mid-INL (arrow, Fig. 5d) is consistent with Müller glial cell labeling. At P13, just after eye opening, background labeling of the IPL remains relatively high. Faint labeling of AC bodies in the INL and GCL is detectable, but labeling of glial elements is prominent, with somatic labeling of presumptive Müller cells (vertical arrows, Fig. 5e), and small irregular elements, some of which may be microglial (horizontal arrows, Fig. 5e). Evidently, the pattern of GAD67-IR is quite different from that of ChAT-IR at this stage (cf., Figs. 4e and 5e) and from the adult pattern of AC labeling (Fig. 2c).
Development of GABA-immunoreactivity
The very profuse GABA-IR of inner retinal neurons at birth falls off considerably at P1 (Fig. 6a), when no stratification of dendritic processes is detected and when only a small number of displaced AC bodies are prominently labeled (large arrows, Fig. 6a). In addition, a small number of normally placed AC bodies exhibit GABA-IR (small arrows, Fig. 6a). Faint amorphous GABA-IR can be seen occasionally in the IPL and in the outer neuroblastic part of the INL (arrowheads, Fig. 6a), indicative of persisting degenerative change. Altogether, the pattern of labeling resembles that of ChAT- and GAD67-IR at P1 (cf., Figs. 4a, 5a, and 6a).
By P4, robust GABA-IR is present in the INL, GCL, and IPL, labeling many ACs on both sides of the IPL and some larger (ganglion) cell bodies as well (Fig. 6b). Both type a and type b ChAT-immunoreactive SAC bodies are prominently labeled by GABA-immunoreactive as well at this stage (arrows, Fig. 6b), as determined in this double-labeled example (ChAT-IR not shown). Note that horizontal cells and their processes are prominently labeled at P4 (white arrowheads, Fig. 6b), brighter at P4 than at any other stage. Unlike the trilaminar pattern seen at P0 (Fig. 3), two prominent bands of GABA-IR stand out in the IPL at P4 (black arrowheads, Fig. 6b). These are ChAT-immunoreactive bands (data not shown) and represent the two starburst substrata detected at P3 (cf., Figs. 4b and 6b).
At P7, the adult pattern emerges with moderate labeling of AC bodies in the INL, prominent GABA-immunoreactive labeling of cell bodies in the GCL double labeled for ChAT-IR (cf., Figs. 4d and 6c). Strata of processes exhibiting GABA-IR are present throughout the IPL.
At P13, as at P4 and subsequently, a great number of cell bodies are labeled in the INL, some of which show ChAT-IR (white arrow; see Fig. 9g), and many cell bodies, both large and small, are labeled in the GCL. The former are undoubtedly GCs, as the axons are also labeled (“ax” in Fig. 6d). Among the small cell bodies in the GCL are brightly labeled examples (black arrow), which also exhibit ChAT-IR (see Fig. 9g).
In optimally sectioned central retina at P13, the best resolution of GABA-immunoreactive bands is achieved, revealing at least seven strata in the IPL (small arrowheads, Fig. 6d). These are not readily discernable in adult retina (cf., Fig. 2a), principally as a consequence of the attenuation of the IPL with retinal stretching during ocular growth. The seven bands, occurring in three separable broader layers, are barely detected in optical density scans (boxed areas, Fig. 6d; scans, Fig. 6e). Two pairs of bands, gb2 and gb3 and gb5 and gb6, are so close together that they are just resolvable in this preparation. Two bands, gb2 and gb5, correspond in position to the two ChAT-immunoreactive starburst substrata, C1 and C2 (large arrowheads, Fig. 6d; scans, Fig. 6f) seen in this double-labeled preparation, supporting the co-localization of ChAT- and GABA-IR in the dendrites of SACs.
Development of GAT1-immunoreactivity
As demonstrated above (Fig. 3), GAT1-IR has the same retinal distribution at birth as ChAT and GAD67. At P3, GAT1-IR is present in small cell bodies flanking the IPL, presumably those of SACs (arrows, Fig. 7a). GAT-IR is present in a broad band of processes at the outer border of the IPL and in a narrow band of processes that lie between the GAD65-labeled G3 and G4 bands (arrowhead, Fig. 7a) in this double-labeled preparation (GAD65-IR not shown), where the dendrites of type b SACs branch (cf., Fig. 2b).
Postnatal development of GAT1-IR. (a) By P3, a pattern of SAC labeling is evident (cf., Figs. 4 and 9), including a distinct substratum coinciding with the ChAT-immunoreactive starburst substratum in sublamina b (arrowhead). (b) At P8, in central retina, numerous presumed GABAergic ACs are GAT1-IR, but Müller cells also exhibit some GAT1-IR. Many distinct substrata of labeling are detected at this stage. Arrowhead marks substratum gt1-6. Optical density scans of boxed areas 1 and 2 are illustrated in (e) and (f). (c and d) At P9, double labeling for GAT1- and GABA-IR shows the faint persistence of GAT1-IR in the IPL and in brightly GABA-immunoreactive cell bodies of the GCL (arrows in c and d), which are those of type b SACs (cf., Fig. 4c). (e) Optical density scans of GAT1-IR at P8, boxed areas in (b). The two scans are complimentary, each in affording better resolution for certain bands. Overall, eight bands are readily detected. (f) Optical density scans of GAD65-IR in boxed areas of this double-labeled preparation (see double exposure in Fig. 9f). In this case, G2 and G3 bands are anomalously displaced (see text). (g) Optical density scan of another section from the same retina, double labeled for ChAT- and GAD65-IR and adjusted for comparable width of the IPL. Alignment of the C1 and C2 bands with the gt1 bands (e and g) shows that gt1-2 and gt1-6 correspond positionally to the C1 and C2 bands, respectively. It is likely that this alignment signifies colocalization (see text). Scale bars: 20 μm. Bar in (a) applies to (a) and (b). Bar in (c) applies to (c and d).

The stratification of GAT1-immunoreactive dendritic processes is more clearly seen at P8 in central retina (Fig. 7b). Two neighboring optical density scans (boxes 1 and 2, Fig. 7b) show that there are at least eight discernable bands of GAT1-IR in the IPL (gt-1 through gt-8, Fig. 7e). In this double-labeled preparation (cf., Fig. 9f), scanned in both locations, GAD65-IR is not helpful in deciding whether gt-5 or gt-6 coincides with the SAC band, C2, in sublamina b because in this particular case, the G2 and G3 bands are shifted anomalously toward the INL (Fig. 7f). In a second sample from the same retina, double stained for ChAT- and GAD65-IR, where the alignment and spacing of GAD65-immunoreactive bands is more typical (cf., Figs. 2e and 10), it is evidently the gt1-6 band (arrowhead, Fig. 7b) that coincides with the C2 band (Fig. 7e and 7g). The similar position of the gt1-2 band and the C1 band (cf., Fig. 7e and 7g) suggests colocalization of ChAT- and GAT1-IR in type a SACs at P8.
After P8, GAT1-IR declines in neurons (Fig. 7c), although it is still evident in the brightly GABA-immunoreactive cell bodies of type b SACs (arrows in Fig. 7c and 7d). In adult retina, however, GAT1-IR is present mainly in Müller glial cells (data not shown).
Development of GAD65-immunoreactivity
The development of GAD65-IR in rabbit retina is delayed with respect to GAD67-IR (and ChAT-IR), but it is rapid and monophasic. At P1, many cell bodies in the proximal INL exhibit GAD65-IR, but this immunoreactivity is more prominent in the primary dendrite of these pyriform ACs (large arrow, Fig. 8a) than in the perikaryon where it is seen at P0 (cf., Fig. 3c). At P1, strata of immunoreactive dendrites in the IPL are just starting to emerge (small arrow, Fig. 8a). Additionally, GAD65-IR begins to appear in newly formed horizontal cells adjacent to the OPL (arrowhead, Fig. 8a).
Postnatal development of GAD65-IR. (a) At P1 labeling is slightly advanced from P0, with prominent labeling in the apical dendrites of pyriform ACs in the INL (large arrow), and labeling is beginning to appear in cell bodies of horizontal cells (arrowhead). Stratification of dendrites in the IPL is just beginning to emerge (small arrow). (b) At P3, the adult pattern of four bands in the IPL is detectable (arrowheads). (c) At P5, the adult pattern of robust tetralaminar (G1–G4) labeling is present (arrowheads), but the immature pattern of prominent cell body labeling in the INL is at the maximum. (d) At P13, some cell bodies are still prominently labeled (arrow), but the four immunoreactive substrata have become more compact as in the adult, with progressive expansion and thinning of the retina. Scale bar, 20 μm, applies to (a–d).

At P3, four bands of GAD65-immunoreactive dendrites, characteristic of the adult, are detectable in the IPL (arrowheads, Fig. 8b). At P5, robust staining of the four bands, G1–G4, is present, together with the labeling of many cell bodies in the INL (Fig. 8c). In contrast, labeling of GAD65-immunoreactive cell bodies in the GCL is rare. At P13, a still more mature pattern is observed, with prominent bands of label in the IPL and less prominent cell body labeling (Fig. 8d).
Postnatal development of excitatory and inhibitory neurotransmitters in cholinergic and GABAergic ACs: Double-labeling protocols, P1–P13
The double-labeled preparations of Fig. 9 illustrate temporal correlations in the development of multiple neurotransmitters in SACs and in nonstarburst GABAergic ACs.
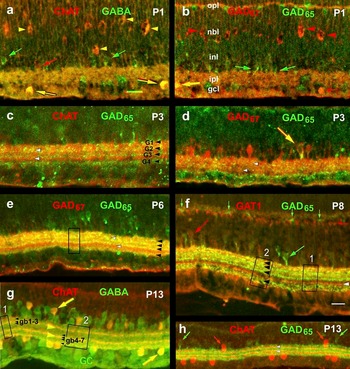
Double-label ICC for excitatory and inhibitory neurotransmitters in SACs, transitory cholinergic neurons, and non-starburst GABAergic ACs. (a) At P1, ChAT-IR labels scattered cell bodies in the GCL, which co-localize GABA (yellow arrows). They are thus identified as type b SACs. ChAT-IR also labels a few cells in the INL (red arrow). GABA-IR is not yet seen in these presumed type a SACs but instead labels a variety of normally placed AC bodies (green arrows) and some in the IPL. ChAT-IR also labels transitory apoptotic neurons in the neuroblastic layer (NBL) and INL, which co-localize GABA-IR (yellow arrowheads). (b) At P1, small (amacrine) cells in the GCL are GAD67-IR (red arrow), and these, by position and size, are type b SACs. Rarely, displaced (nonstarburst) ACs exhibit co-localization of GAD67- and GAD65-IR (yellow arrow). Small GAD65-immunoreactive AC bodies in the INL (green arrows) appear similar to the GABA-immunoreactive ACs in (a) and likely co-localize GABA-IR. Transitory apoptotic neurons in the neuroblastic layer (NBL) and INL exhibit GAD67-IR (red arrowheads), with the same cytological characteristics as those labeled by ChAT-IR (cf., a, yellow arrows), but they do not show GAD65-IR. Overall, the pattern of GAD67-IR is indistinguishable from the ChAT-IR in (a). (c) At P3, two narrow bands of ChAT-immunoreactive dendritic labeling (white arrowheads) stand out against a background of diffuse labeling; they lie between narrow bands of GAD65-immunoreactive dendrites (black arrowheads). Both emerge in the IPL at about the same time. ChAT- and GAD65-immunoreactive labeling of AC bodies is also detectable on either side of the IPL, but there is no co-localization (yellow hue) of ChAT- and GAD65-IR in cell bodies. (d) At P3, GAD67-IR is barely detectable in two bands of the IPL (arrowheads; cf., Fig. 5b). Occasionally GAD67-IR co-localizes with GAD65-IR in AC bodies (arrow) and presumably throughout the processes of those cells in the IPL. (e) At P6, the two bands of GAD67-IR in the IPL are optimally visualized (white arrowheads; cf., Fig. 5c), and the band in sublamina b is clearly seen between the inner two of the four GAD65-immunoreactive bands (black arrowheads), as in the adult. The boxed area is scanned separately for markers of each of the two GAD isoforms (see Fig. 10c). (f) At P8, in central retina, GAT1-IR is present in normally placed AC bodies (large red arrow), presumably including type a SACs. A nonoverlapping set exhibits GAD65-IR (large green arrow). Many thin bands of GAT1-IR are detected in the IPL, and one corresponds to the ChAT-immunoreactive band of type b SACs (white arrowhead) that lies between the G3 and G4 bands of GAD65-IR (black arrowheads), as viewed in the optical density scans (Fig. 7e–7g) of the two boxed areas. GAD65-IR is also present in horizontal cell bodies (small green arrows) and some adjacent (probably glial) elements (small red arrow). (g) At P13, seven narrow GABA-immunoreactive bands can be detected above some diffuse labeling in the IPL (black arrowheads; better seen in single labeled Fig. 6d). Two of these, gb2 and gb5, are double labeled for ChAT-IR (two yellow arrowheads; see scans of boxed areas in Fig. 6e and 6f). ChAT-immunoreactive cell bodies of type a and type b SACs are also labeled (e.g., yellow arrows). (h) At P13, in peripheral retina, double labeling for ChAT- and GAD65-IR in peripheral retina shows no co-localization: two separate sets of cell bodies (red and green arrows) and interleaved bands of label in the IPL (ChAT-IR marked by arrowheads), as in the adult. Scale bars, 20 μm; bar in (a) applies to (a–e) and (g); bar in (f) applies to (f and h).

At P1, the somata of type b SACs, characteristically displaced to the GCL, are brightly labeled and exhibit ChAT- and GABA-IR (yellow arrows, Fig. 9a), as in the adult. Cell bodies of the same size and location are also positive for GAD67-IR (small, red arrow Fig. 9b) but negative for GAD65-IR. Very rarely, GAD67- and GAD65-IR are co-localized in AC bodies of the GCL (large yellow arrow, Fig. 9b). At P1, normally placed AC bodies are labeled by ChAT-IR (red arrow, Fig. 9a) or GABA-IR (green arrows, Fig. 9a) but not both. Lack of co-localization suggests that ChAT-immunoreactive type a starburst amacrines do not yet contain significant amounts of GABA. The relatively higher frequency of GABA- and GAD65-immunoreactive cell bodies in the INL, as compared to ChAT- and GAD67-immunoreactive cell bodies, seen in Fig. 9a and 9b, indicates that the GABA in these cells is synthesized by GAD65 and not GAD67.
At P1, the remnant of the transitory population of cholinergic neurons or neuronal precursors exhibit ChAT-, GABA-, and GAD67-IR (arrowheads, Fig. 9a and 9b). They appear to be undergoing apoptosis and fragmentation in the neuroblastic layer, particularly in peripheral retina, as shown here.
At P3, dendritic labeling of starburst and nonstarburst GABAergic ACs is visualized in the IPL (Fig. 9c) as bands of ChAT-IR (white arrowheads) and GAD65-IR (black arrowheads, G1–G4), respectively. The inner band of ChAT-IR lies conspicuously between the inner two bands of GAD65-IR, as in the adult (cf., Fig. 2b and 2e).
At P6, GAD67-IR of the two starburst substrata is most prominent in the IPL (white arrowheads, Fig. 9e). The bands of GAD67-immunoreactive labeling are observed to lie between bands of GAD65-IR (black arrowheads, Fig. 9e), just as in the case of ChAT-IR viewed at P3 or P5.
In order to show graphically the difference in pattern between the bands of GAD65- and GAD67-IR at P6, and the coincidence of ChAT- and GAD67-immunoreactive bands, optical density scans were performed in the double-labeled preparation of Fig. 9e (boxed area), in P5 (boxed areas in Fig. 4c) and P7 retinal sections labeled with antibodies to ChAT, and in P5 sections labeled for GAD65-IR (boxed area in Fig. 8c). Alignment of the optical density peaks of labeling for ChAT-IR at different stages and in different animals is nevertheless very close (Fig. 10a). The two peaks of GAD67-IR align with the two peaks of ChAT-IR (Fig. 10a and 10c), supporting co-localization, whereas none of the peaks of GAD65-IR align with the peaks of ChAT-IR (Fig. 10b and 10c).
Optical density scans in retinal sections, perpendicular to the IPL (a + b), to locate bands of ChAT-, GAD67-, and GAD65-IR (cf., summary in Fig. 11). (a) Scans of ChAT-IR in P5 (boxed areas in Fig. 4c) and P7 retinas, each corrected for thickness of IPL and positioned horizontally by alignment of band in sublamina b (C2). Note relatively small scatter of C1 band peaks in retinas of different ages. Line centered through C1 band of one P5 scan. C1 and C2 bands lie approximately in the middle of sublamina a and sublamina b, respectively. Smaller peaks near IPL border due to thick ChAT-immunoreactive primary dendrites in strata 1 and 5 (cf., Fig. 1b). (b) Scan of GAD65-IR in P5 retina (boxed area in Fig. 8c). (c) Scan of GAD67- and GAD65-IR in P6 retina (boxed area in Fig. 9e). Alignment of peaks of 67G2 and 67G5 bands (cf., Fig. 11) matches C1 and C2 bands, respectively. None of the bands, G1–G4, aligns with the ChAT-immunoreactive bands in (a) or the two bands of GAD67-IR in (c).

Turning again to the double-labeled immunocytochemical preparations (Fig. 9), one observes that the distributions of GAD65- and GAD67-IR are largely separate through the first postnatal week (Fig. 9b, 9d, and 9e), although there is occasional co-localization in (non-starburst) ACs (yellow arrows, Fig. 9b and 9d). GAT1-IR, presumably in SACs, and GAD65-IR are also separate during development (large red and green arrows, Fig. 9f), and no instances of co-localization in cell bodies have been observed. As demonstrated in Fig. 7, above, a prominent band of GAT1 labeling in sublamina b of the IPL (white arrowhead in Fig. 9f) lies between the G3 and G4 bands of GAD65-IR and apparently marks type b AC dendrites.
Before the end of the second postnatal week, just after eye opening, SACs exhibit the neuronal architecture of the adult. They label prominently with ChAT-IR and constitute a fraction of the GABA-immunoreactive ACs (Fig. 9g). They exhibit the classic mirror symmetry of SACs (Famiglietti, Reference Famiglietti1983a; Famiglietti & Tumosa, Reference Famiglietti and Tumosa1987). As in the adult, the cell bodies of type b SACs are brightly GABA- and ChAT-IR (arrow in the GCL, Fig. 9g), whereas the cell bodies of type a SACs are only moderately labeled (arrow in the INL, Fig. 9g), like other normally placed GABA-immunoreactive ACs, under these conditions of preparation. The mirror symmetry of ChAT-immunoreactive SACs is evident in a section of P13 peripheral retina, double labeled for GAD65-IR (Fig. 9h), in which cell bodies are labeled either for ChAT-IR (red arrows) or for GAD65-IR (green arrows) but not both.
Summary: Development of cholinergic and GABAergic dendritic stratification in the IPL
The stratification diagram of Fig. 11 summarizes the results of the distinctive banding of each neurotransmitter marker studied here in the first two postnatal weeks, during the last stages of neuronal organization in rabbit retinal development, and also illustrates the final adult pattern. All labels are shown in relationship to the two bands of SAC dendrites, one in the middle of sublamina a and the other in the middle of sublamina b, each labeled by ChAT-IR (C1 and C2), and both indicated by hatching in Fig. 11.
Stratification diagram: IR in the IPL for cholinergic and GABAergic markers (top), with postnatal ages of expression (bottom). Two narrow bands of ChAT-IR, C1 and C2, in SACs become progressively more distinct against a decreasing background after P3. Bands of GABA-IR are completely different at birth and at P4, when multiple bands, the two SAC bands being most prominent, are present. The adult pattern of seven bands (gb1–gb7) is best visualized at P13. GAD67-IR is similar to ChAT-IR until the second postnatal week. The pattern of seven bands (67G1–67G7) and its similarity to the pattern of GABA-IR suggests that a majority of GABAergic ACs use the GABA synthetic enzyme GAD67 in adult rabbit. Many of those ACs are also GAT1-IR in the first postnatal week, but GAT1-IR is glial in the adult. The four bands of GAD65-IR, G1–G4, are established early at P1–P2 and represent a high proportion of GABAergic ACs, excepting SACs, and signify concentrated labeling of synaptic boutons. At P5, the robust adult pattern of IPL labeling is present. Hatching indicates two SAC substrata. Gray indicates diffuse background labeling.

At birth, the only marker exhibiting stratification in the IPL is GABA-IR, expressed as a three-banded pattern (gb1′, gb2′, gb3′ in Fig. 11), one band at each margin of the IPL and one band at the forming a/b sublamina border. This pattern is lost at P1, and a new pattern begins to emerge at P3–P4, developing into the adult pattern in the second postnatal week. The pattern consists of seven bands, gb1–gb7, best observed at P13.
At P3–P4, all the markers begin to emerge in the narrowly stratified dendrites of SACs, at first more clearly in type b cells than in type a cells. Even though conspicuous somatic labeling marks type b cells first, ChAT-IR, the definitive marker of SACs, is detectable simultaneously in both starburst substrata at P3. It is notable that when ChAT-IR first appears in SAC dendrites, the stratification is as narrow as it is in the adult. GAD67-IR is barely detectable in the starburst substrata at P3 and emerges more gradually than ChAT-IR. The four-banded appearance of GAD65-IR in the IPL slightly precedes that of ChAT-IR, for it is sometimes faintly visible at P1. Co-localization of GAD65- and GAD67-IR is relatively rare in the first two postnatal weeks but is more prevalent in adult, nonstarburst normally placed ACs. The correspondence is evident when bands of GABA-, GAD67-, and GAT1-IR are compared at the end of the first postnatal week. Although more distinct narrow strata of GAD67-IR are detected than of GAD65-IR, there is significant overlap of the two throughout the IPL, excepting G67-2 and G67-5, which correspond to the two cholinergic bands, C1 and C2. GAT1-IR appears transiently in starburst and other ACs, but in the second postnatal week, it shifts toward Müller glial cells, where it resides in adults.
Quantitative analysis of ChAT-immunoreactive somatic labeling of type b SACs
On examination of numerous vertical sections of rabbit retina taken during the first postnatal week and processed for ChAT-IR, we observed brightly labeled cell bodies in the GCL. Their frequency was much lower than expected, however, in view of (1) the relatively high density of SACs in adults (Famiglietti, Reference Famiglietti1983a; Masland et al., Reference Masland, Mills and Hayden1984; Famiglietti, Reference Famiglietti1985; Famiglietti & Tumosa, Reference Famiglietti, Tumosa, Agardh and Ehinger1986, Reference Famiglietti and Tumosa1987), (2) the assumption that SACs are postmitotic at birth (Hinds & Hinds, Reference Hinds and Hinds1978; Young, Reference Young1984; Galli-Resta et al., Reference Galli-Resta, Resta, Tan and Reese1997), (3) the evidence that they are elaborating dendritic trees during the first week (Fig. 1b and Hinds & Hinds, Reference Hinds and Hinds1983; Wong & Collin, Reference Wong and Collin1989), and (4) the fact that the area of the retina in the first postnatal week is only 15% that of adults. We therefore undertook a quantitative analysis of ChAT-immunoreactive cells in the GCL. Because no quantitative study of ChAT-immunoreactive ACs has been published for adult rabbit retina, however, we first needed to perform an analysis of adult retina, as a baseline for comparison.
Density of ChAT-immunoreactive type b SACs in adult retina
Several whole-mounted albino rabbit retinas, successfully reacted for ChAT-ICC, with diaminobenzidine (DAB) as the chromogen, were available for study. One offered the opportunity of visualizing the lightly stained cell bodies of GCs (“G” in Fig. 12b) and nonselectively stained displaced ACs (“A” in Fig. 12b) in the same fields as selectively ChAT-immunoreactive, displaced SACs (“S” in Fig. 12b).
ChAT-immunoreactive cells and other neurons in the GCL of adult rabbit retina. (a) Graph: density of ChAT-immunoreactive cells (stars), nonspecifically stained ACs, and GCs (diamonds, dashed line) in the GCL of adult rabbit retina, varying with distance from midvisual streak. Density of all neurons in the GCL (filled circles) rises to more than 5000/mm2 at midvisual streak. Density of ChAT-labeled cells and GCs is about the same in peripheral retina, but the density of GCs rises to more than 3500/mm2 in midvisual streak, while ChAT-labeled cells are only one fourth as numerous. Values for ChAT-labeled cells in a second retina are also plotted (open stars). (b) Photomicrograph: darkly labeled cells exhibiting ChAT-IR (S) stand out against the faint nonspecific labeling of non-SAC bodies (A) and GCs (G). (c) The variation in the ratio of ChAT-immunoreactive, displaced ACs to GCs, ranges from 25% in midvisual streak to 75% in the near ventral periphery to 100%, 5 mm ventral to the streak. VS = visual streak; Scale bar, 20 μm in (b).

Counts were made of cell bodies in the GCL of each of the three cell types in microscopic fields positioned at 1-mm interval, from 1 mm dorsal to 12 mm ventral to the visual streak, with the addition of two measurements at 0.5-mm intervals on either side of mid-visual streak. Nonselectively stained cell bodies could not be visualized adequately for quantitative purposes at the three most peripheral locations. One vertical transect perpendicular to the visual streak was supplemented by a second at the six most peripheral locations to increase the number of cells counted and thus to improve the statistical power of the counts.
Counts of ChAT-immunoreactive cell bodies from the two retinas (open and filled stars in Fig. 12a) differ to a degree centrally, with peak densities of 794 and 1051/mm2 at dvs = 0, but are nearly identical, in the range of 300/mm2, for +5 ≤ dvs ≤ +11. Counts of GC bodies (dashed line Fig. 12a) reach a peak density of about 3700/mm2 at dvs = 0, on the vertical transect sampled. The density of GCs decreases sharply both dorsally and ventrally, in the latter case to less than 250/mm2 in the far periphery. The total of all neurons in the GCL reaches a peak density of more than 5000/mm2 and declines to about 750/mm2 in the retinal periphery. In adult retina, the ratio of displaced ChAT-IR cell bodies to GC bodies is about 1 in peripheral retina, about 0.75 in the “near periphery,” and only declines significantly in and near the visual streak (Fig. 12c), where the density of GCs rises sharply (Fig. 12a). Using a mean value of 350 ChAT-labeled cell bodies in the GCL per millimeter square, and a retinal area of 450 mm2, we estimate the total number of type b SACs to be on the order of 150,000–160,000 in adult retina.
Frequency of ChAT-immunoreactive, type b SACs in developing retina
In Fig. 13, the densities are plotted of ChAT-immunofluorescent cell bodies in the GCL during the first two postnatal weeks. These densities are calculated from counts in frozen sections of retinal blocks taken at days P0, P1, P2, P3, P4, P7, P8, P9, P11, and P13. Also plotted are the data of Fig. 12a from adult retina for comparison. At P0–P4, the densities are generally lower than adult values but quite variable. By P7, densities have increased centrally, approaching those in adult retina, and there is a notable difference in the density of cells in and outside the visual streak. Between P9 and P13, densities are more consistent and are consistently higher than adult values. In the streak, they rise to more than 1000/mm2 and in the periphery to more than 500/mm2. Assuming that the number of displaced SACs in the retina at the end of the first postnatal week is equal to or greater than that in the adult (taking into account likely programmed cell death), these results are counterintuitive. One would expect the density of SACs to decline progressively as the diameter of the eye expands toward adult dimensions: to be highest at birth, less at P13, and lowest in adult retina.
Graph: density of displaced ACs in the GCL exhibiting ChAT-IR (i.e., type b SACs) on numbered postnatal days P0, P1, P2, P3, P4, P7, P8, P9, P11, and P13. Density data points are plotted as integers representing numerical age in days, density varying with distance from midvisual streak. Data for adult rabbit (from Fig. 12a) are superimposed (stars and thick line). Data from P13 retina are connected by a dashed line. Unexpectedly, densities are generally lower than adult values during the first postnatal week. During the second week, they are generally higher, as expected. (See text for explanation.)

The data displayed in Fig. 13 strongly suggest that not all SACs exhibit ChAT-IR before P13 and particularly in the early postnatal days. In order to arrive at a quantitative estimate of the percentage of SACs expressing ChAT-IR, it is necessary to estimate the densities of SACs during the first two postnatal weeks. Presently, there is no independent selective method of marking SAC bodies for quantitative estimates of density in developing rabbit retina. Since the density of type b SACs is now known in adult retina and the density of GCs is also known, it is possible to estimate the former from the density of the latter, based on a set of assumptions about the relationship between the two, grounded on the data from adults. A published study documenting changes in GC density during postnatal development exists for this purpose (Robinson et al., Reference Robinson, Dreher and McCall1989).
Estimated fractional expression of ChAT-immunoreactivity in type b SACs during early postnatal development
In order to determine the expected densities of SACs, both labeled and (presumably) unlabeled, at different times in the first two postnatal weeks, we used published data on density of GCs labeled by retrograde transport of horseradish peroxidase in developing rabbit retina (Robinson et al., Reference Robinson, Dreher and McCall1989). Corrections were made for postnatal decline in numbers of GCs, which undergo developmental apoptosis, decreasing from a total of about 380,000 at birth to about 280,000 in adults (Robinson et al., Reference Robinson, Dreher and McCall1989). The curves plotted in Fig. 14a represent data extracted from scaled drawings of P0, P6, P11, and P19 rabbit retinas, on which maps of GC isodensity lines were drawn (Robinson et al., Reference Robinson, Dreher and McCall1989). The provisional assumption was made that the ratio of SACs in the GCL to GCs is the same during development as in the adult, and the resulting calculated values were plotted together in Fig. 14b (see Materials and methods), together with adult data from Fig. 12a. Because of the rapidly changing densities of cells in and near the visual streak and the almost threefold decline in peak density of GCs in the streak from birth to adulthood, no attempt was made to estimate densities in or near the visual streak.
Graphs: topographic densities of cells in the GCL, and estimates of type b starburst amacrine cells during early postnatal development, varying with distance from midvisual streak. (a) GCs (data from figures of Robinson et al., Reference Robinson, Dreher and McCall1989). (b) SACs in the GCL, estimated from GC data (see text), with adult values for ChAT-labeled cells in the GCL from Fig. 13. (c–e) densities of ChAT-labeled cells from measurements at different postnatal ages (numbers) compared with calculated SAC densities at similar ages (from b). SAC and ChAT densities do not coincide until the latter part of the second postnatal week, indicating a gradual increase of postnatal neurotransmitter expression in the population of type b SACs (see text for explanation).

In Fig. 14c–14e, pairs of curves representing two developmental stages each were plotted as expected upper and lower temporal bounds, together with the densities of early postnatal ChAT-immunoreactive cells in the GCL obtained in the present study (Fig. 13). Our data set was subdivided into three time periods: P1–P4, P7–P9, and P11–P13, each accompanied by two temporally proximate estimates for the density of SACs. The evidence presented in Fig. 14c indicates that only a small fraction of displaced SACs exhibit ChAT-IR at P0–P4. At P9, samples from the ventral periphery indicate that, at least in that location, about half of type b SACs are ChAT-immunoreactive (Fig. 14d). Only at P13, in peripheral retina, where the most reliable data are available for comparison, does the evidence favor expression of ChAT-IR in all displaced SACs (Fig. 14e). Note that from P0 to P13, all cell bodies in the GCL exhibiting ChAT-IR were also immunoreactive for GABA in double-labeled preparations.
Discussion
We have followed the expression of markers of cholinergic and GABAergic neurotransmission in the inner retina of rabbit by immunocytochemical methods, during the first two postnatal weeks of development, from birth through eye opening. The timelines of expression ChAT, GABA, GAD67, GAD65, and GAT1 are illustrated in the summary chart of Fig. 15a, where they are compared with those of previsual synchronous activity (waves) in retinal GCs (Fig. 15b), and the responses of immature SACs (Fig. 15c) from the work of others (Zhou & Zhao, Reference Zhou and Zhao2000; Syed et al., Reference Syed, Lee, Zheng and Zhou2004; Zheng et al., Reference Zheng, Lee and Zhou2004, Reference Zheng, Lee and Zhou2006).
Graphs: temporal phases in the postnatal development of cholinergic and GABAergic mechanisms of inner rabbit retina, a comparison of ICC, neuropharmacological, and electrophysiological data. (a) Neurotransmitter ICC. At birth (postnatal day 0 or P0), IR for ChAT, GAD67, and GAT1 antibodies is very similar, exhibiting many apoptotic cells, believed to be transitory interneurons (top blue line). In the locations where SACs are expected, very few cell bodies show IR for ChAT (second line), GAD67, and GABA until P1, and IR for GAT1 until P3. Diffuse staining of the IPL is present for ChAT-IR (third line) and GABA-IR until about P5. Adult patterns of ChAT-IR and GABA-IR are achieved in the IPL by P7–P8. GAD67-IR (red lines) is clearly evident in the two starburst substrata of the IPL from P3–P6 and thereafter is also present at significant levels in many other ACs. GAD65-IR is never present in SACs and shows a steady developmental progression from P0 through P5, with the rapid emergence of four substrata in the IPL, as in adult retina. See text for further explanation. (b) Previsual synchronous activity of retinal GCs, from the work Zhou et al. (Zhou & Zhao, Reference Zhou and Zhao2000; Syed et al., Reference Syed, Lee, Zheng and Zhou2004). Stage II waves (blue line) in GCs, driven through nicotinic cholinergic receptor (AChR) activation, occur from E24 through P1, and disappear by P4. Both apoptotic transient cholinergic interneurons, (putative ACs), and SACs may account for nicotinic, stage II waves. Stage III waves, driven by ACh via muscarinic cholinergic receptors (green line) and by glutatmate via AMPA/kainate (AMPA/KA) receptors (black line), are seen at P2, but are increasingly suppressed through GABAA and GABAC receptors after P6, and disappear after P11, around the time of eye opening (black bar, abscissa scale). The increasing inhibition that suppresses stage III waves (red line) is best accounted for by GAD65-immunoreactive ACs (red line, in a) and the shift of GABA effects in the retina from excitatory to inhibitory. (c) Starburst amacrine cell physiology and pharmacology, from the work of Zhou et al. (Zheng et al., Reference Zheng, Lee and Zhou2004, Reference Zheng, Lee and Zhou2006). Synchronous low-frequency bursting in SACs is correlated with and contributes to the formation of stage II and stage III waves in GCs (first line, blue and green). SACs bear nicotinic cholinergic receptors at birth and are reciprocally excited through such receptors, up to P11, contributing to stage II waves until P4 (second and third lines, blue). Reciprocal excitation of SACs via GABAA receptors turns to reciprocal inhibition between E29 and P5. The pharmacology of SACs would allow them to participate in cholinergic and GABAergic mechanisms, but in the latter case, because they lack output to bipolar cells (Famiglietti, Reference Famiglietti1991), they cannot inhibit glutamate excitation of GCs to suppress stage III waves, as can the more numerous GAD65-immunoreactive ACs (red lines in a), which make numerous synaptic contacts with bipolar axon terminals (Vaughn et al., Reference Vaughn, Famiglietti, Barber, Saito, Roberts and Ribak1981).

Postnatal development of ChAT-immunoreactivity: Qualitative analysis
On the day of birth, P0, destruction of ChAT-immunoreactive cell bodies is extensive, in both the INL and the GCL, as well as in the neuroblastic layer. We interpret this destruction as apoptosis mainly of transitory cholinergic neurons, which continues in the neuroblastic layer up to P4 in peripheral retina (Figs. 3 and 15a). We assume that a small proportion of this destruction includes SACs, in accordance with evidence on postnatal elimination of ACs in mouse retina (Young, Reference Young1984). Narrowly stratified SACs with recognizable morphology, and in their final positions, are undoubtedly present at P0 (Wong & Collin, Reference Wong and Collin1989), although ChAT-IR does not appear in their dendrites until P2–P3. We infer that in the late prenatal period and for a few days after birth, SACs are accompanied by other transitory cholinergic retinal neurons.
After most of the ChAT-immunoreactive debris is cleared in the inner retina at P1, ChAT-immunoreactive cell bodies are easily visualized in the distinctive mirror-symmetrical positions of SACs, flanking the IPL. The time course of the appearance of ChAT-IR in cell bodies and dendrites of ACs is charted in Fig. 15a, lines 2–4. From P1, a steady progression can be followed in the maturation of SACs, first in their somatic expression of ChAT and then in the spread of ChAT-IR to distal dendrites, detectable as two narrow bands of IR in the IPL at P2–P3. The nearly continuous bands of ChAT-immunoreactive dendrites in 12-μm sections, seen at P3 (Fig. 4b), attest to the high degree of dendritic field overlap of SACs, previously documented in adult retina (Famiglietti, Reference Famiglietti1983a; Tauchi & Masland, Reference Tauchi and Masland1984; Famiglietti, Reference Famiglietti1985). The diffuse ChAT-IR in the IPL, which fades postnatally and disappears by P7, is more difficult to assign to particular cells in the inner retina. In another study focused on the neurokinin 1 receptor, using albino rabbits and a mouse monoclonal antibody directed at human ChAT, the faint and narrow dendritic stratification of SACs was detected at P0 (Casini et al., Reference Casini, Dal Monte, Fornai, Bosco, Willems, Yang, Zhou and Bagnoli2004).
Postnatal development of ChAT-immunoreactivity in other mammals
In tree shrew retina, ChAT-immunoreactive cell bodies are detected before birth, but dendritic labeling does not occur until P1, labeling in sublamina b preceding that in sublamina a, as in rabbit (Knabe et al., Reference Knabe, Washausen, Happel and Kuhn2007). In rat retina, ChAT-IR is also detected in cell bodies in the IPL before birth, and type b cells are labeled before type a cells, but dendritic labeling is not evident until P3, as in rabbit (Kim et al., Reference Kim, Lee, Kim, Park and Chun2000). Similarly, in mouse retina, ChAT-immunoreactive type a and type b cells are observed at P0, and their dendritic strata appear at P3–P5. In cat retina, both type a and type b cells are identified at birth, with the two dendritic strata, but numbers are low, doubling in the first 5 days (Dann, Reference Dann1989). In ferret retina, type a and type b cells are also detected at birth, but two discrete dendritic strata are not observed until the end of the first postnatal week (Reese et al., Reference Reese, Raven, Giannotti and Johnson2001).
Consistent with our evidence for transient cholinergic neurons in developing rabbit retina, histological evidence for apoptosis of ACs in both the AC and the GC layers is observed in mouse retina from birth until the second postnatal week (Young, Reference Young1984). In rat retina, there is a reported overproduction of ChAT-immunoreactive ACs that are significantly reduced by P6 (Galli-Resta & Novelli, Reference Galli-Resta and Novelli2000; Resta et al., Reference Resta, Novelli, Di Virgilio and Galli-Resta2005), and ChAT-immunoreactive cellular debris, similar to that shown above in Fig. 3, is observed at P2 after injection of ATP, reported to induce “normal” cell death of developing ChAT-immunoreactive retinal neurons (Resta et al., Reference Resta, Novelli, Di Virgilio and Galli-Resta2005).
A third type of (non-starburst) ChAT-immunoreactive AC, reminiscent of that found in nonmammalian retinas (e.g., Millar et al., Reference Millar, Ishimoto, Johnson, Epstein, Chubb and Morgan1985), has been reported in some mammalian retinas, including tree shrew (Conley et al., Reference Conley, Fitzpatrick and Lachica1986), cat (Vaney, Reference Vaney, Osborne and Chader1990), opossum (Camargo De Moura Campos & Hokoc, Reference Camargo De Moura Campos and Hokoc1999), and ground squirrel (Cuenca et al., Reference Cuenca, Deng, Linberg, Fisher and Kolb2003). It is not seen in mouse, rat, rabbit, and ferret retinas, or in adult primate retinas (Rodieck & Marshak, Reference Rodieck and Marshak1992). Cell bodies of this third type are found only in the INL and toward the middle of that layer. Thus, the transient cholinergic neurons that we have reported at P0, adjacent to and on either side of the IPL, would not be candidates for a “lost” type-three cell population. Degenerating ChAT-immunoreactive cell bodies in the neuroblastic and mid-INL, observed from P1–P4, evidently immature as they appear, are unlikely to include a transient type-three cell population.
Postnatal reorganization of GABA-immunoreactive neurons in inner retina
Prior results marking GABA-IR in developing rabbit retina are in general agreement with the present study: GABA is present in ACs by E25 (Osborne et al., Reference Osborne, Patel, Beaton and Neuhoff1986; Messersmith & Redburn, Reference Messersmith and Redburn1992; Pow et al., Reference Pow, Crook and Wong1994) and in GCs through the postnatal period (Pow et al., Reference Pow, Crook and Wong1994). The distinctive trilaminar distribution of dendrites in the perinatal IPL (Figs. 3 and 15a) has not been observed previously, however, apparently for lack of sampling at P0 (cf., Messersmith & Redburn, Reference Messersmith and Redburn1992; Pow et al., Reference Pow, Crook and Wong1994). Beginning at P2, a bisublaminar distribution of GABAergic processes, colocalizing ChAT-IR, gradually emerges, a process that reflects the maturation of ChAT-IR SACs and their synthesis of GABA by GAD67. This bisublamination of GABA-IR, most prominent at P4–P5 (Fig. 6b and Pow et al., Reference Pow, Crook and Wong1994), is gradually supplemented in the first postnatal week by a multilayered distribution of seven narrow strata through the full depth of the IPL (Figs. 6d and 11; Fig. 15a, line 16). There may also be labeling of diffusely branching or broadly stratified ACs, but this is difficult to determine in our preparations.
The fact that at P0, ChAT-, GAD67-, and GAT1-IR are found in apoptotic neurons, while GABA is expressed in a different pattern in unaffected AC and GC at first seems anomalous. Lack of GABA in apoptotic cells can be explained as leakage or metabolism, while the antigenic epitopes of the inactivated synthetic enzymes have not yet been destroyed in those cells. The absence of synthetic enzymes in the intact GABA-containing AC and GC could be explained by uptake of unmetabolized GABA synthesized by and lost from the dying cells and/or a presently unidentified embryonic GAD in perinatal GABA-containing neurons. Two prior studies support the likelihood of perinatal GABA transport (Crook & Pow, Reference Crook and Pow1997; Hu et al., Reference Hu, Bruun and Ehinger1999). The transient appearance of GAT1-IR in starburst and other ACs and its shift toward Müller glial cells in the second postnatal week is puzzling, unless its presence is associated primarily with developmental and sustentacular roles.
Incremental postnatal expression of GAD65-immunoreactivity
GAD65-IR is present at birth only in a few scattered ACs bodies (Fig. 3c; Fig. 15, line 17) and first appears in the IPL at P1 (Fig. 8a; Fig. 15a, line 18). The expression of GAD65-IR is monophasic in respect to dendritic labeling in the IPL. At P3, GAD65-IR is detected in four substrata, and at P5, a robust tetralaminar distribution of GAD65-immunoreactive dendrites is present, as in the adult (Fig. 10). Cell bodies are highly immunoreactive at P5, but somatic GAD65-IR later subsides, and in adult retina, only lightly labeled widely scattered cell bodies are observed, almost exclusively in the INL. Consistent with evidence in adult rabbit (Famiglietti & Tumosa, Reference Famiglietti, Tumosa, Agardh and Ehinger1986; Brandon, Reference Brandon1987; Famiglietti & Tumosa, Reference Famiglietti and Tumosa1987; Brandon & Criswell, Reference Brandon and Criswell1995), GAD65 never co-localizes with ChAT-IR and thus never occurs in SACs. In the adult retina, GAD65 is found on synaptic vesicles and in the cytoplasm of GAD-immunoreactive boutons presynaptic to bipolar cell axon terminals (Vaughn et al., Reference Vaughn, Famiglietti, Barber, Saito, Roberts and Ribak1981). These GAD-positive boutons apparently constitute the major inhibitory influence on excitatory glutamatergic neurotransmission in the inner retina, acting at GABAA and GABAC receptors on bipolar cells (e.g., Shields et al., Reference Shields, Tran, Wong and Lukasiewicz2000).
Correlation of the postnatal development of cholinergic, GABAergic, and glutamatergic systems with previsual synchronous GC activity and SAC pharmacology
Previsual synchronous activity (waves) of GCs has been observed in several animals, including ferret and cat (Meister et al., Reference Meister, Wong, Baylor and Shatz1991), mouse (Mooney et al., Reference Mooney, Penn, Gallego and Shatz1996), chick (Catsicas et al., Reference Catsicas, Bonness, Becker and Mobbs1998; Wong et al., Reference Wong, Sanes and Wong1998), and turtle (Sernagor & Grzywacz, Reference Sernagor and Grzywacz1999). In all cases observed, cholinergic antagonists reduced or blocked waves, and GABAA antagonists increased waves (for review, see Wong, Reference Wong1999). In turtle retina, GABA, acting at GABAA receptors, modulates retinal waves, as it shifts in effect from excitation to inhibition, shutting off the generation of synchronous activity, possibly under the influence of visual experience (Sernagor et al., Reference Sernagor, Young and Eglen2003). In rabbit, on the other hand, suppression of waves occurs before eye opening (Fig. 15b, and see below).
In rabbit, stage I retinal waves in retinal GCs occur briefly before birth, around E22 (Syed et al., Reference Syed, Lee, Zheng and Zhou2004). The time course of stage II and stage III retinal waves and their pharmacological dependency is charted in Fig. 15b (blue and green lines, respectively).
Stage II waves (Fig. 15b, line 1), occurring between E24 and P1–P2, are mediated by nicotinic cholinergic receptors, but unlike stage I and stage III waves, they are not modulated by GABA. Initiation of stage II waves has been attributed to SACs (Zheng et al., Reference Zheng, Lee and Zhou2004, Reference Zheng, Lee and Zhou2006). It has been suggested that the widespread nicotinic effects of ACh on GCs at birth, reflected in stage II waves, are due to the broader stratification of SAC dendrites at P0 (Zheng et al., Reference Zheng, Lee and Zhou2004). The extent of this spread of dendritic appendages is minimal, however (Wong & Collin, Reference Wong and Collin1989), and cannot account for the diffuse ChAT-IR observed at birth (Fig. 3, and A. Ahmed & Z.J. Zhou, unpublished data, cited in Zheng et al., Reference Zheng, Lee and Zhou2004). Our evidence favors the transient presence of other cholinergic neurons perinatally (top blue line; Fig. 15a, line 1), which could provide common mode input to SACs and contribute to the excitatory networks supporting stage II waves that, like the rhythmic currents in SACs with which they are correlated (Zheng et al., Reference Zheng, Lee and Zhou2006), are blocked neither by glutamate nor by GABA antagonists (Zheng et al., Reference Zheng, Lee and Zhou2004). Although GABA is present in SACs (Fig. 9a) and can be released from SACs at P1 (Zheng et al., Reference Zheng, Lee and Zhou2004), it apparently plays no role in stage II waves.
Stage III waves (Fig. 15b, lines 2 and 3), induced by (1) ACh at muscarinic receptors and (2) glutamate at AMPA receptors (Zhou & Zhao, Reference Zhou and Zhao2000), begin at P0–P1 (Fig. 15b, green and black lines, respectively). P1 also marks the beginning of GABAA/C receptor–mediated suppression of stage III waves (Fig. 15b, line 4, red). This inhibition strongly suppresses stage III waves by P6–P7 and effectively blocks them after P8 (Syed et al., Reference Syed, Lee, Zheng and Zhou2004).
The time course of perinatal pharmacology in SACs is charted in Fig. 15c. Synchronous low-frequency bursting of SACs (Fig. 15c, line 1), and thus potential rhythmic release of neurotransmitters on GCs, begins before birth and lasts until P7 (Zheng et al., Reference Zheng, Lee and Zhou2004). To the extent that they express ChAT and release ACh, therefore, SACs can play a role in both stage II and stage III waves, at nicotinic and muscarinic receptors, respectively (Fig. 15b, lines 1 and 2, blue and green). Nicotinic autoreceptors on SACs appear to support an excitatory network of SACs that persists until the end of the first postnatal week, and such a network is believed to underlie the production of stage II and stage III waves (Zheng et al., Reference Zheng, Lee and Zhou2006). Such a network could also act to recruit starburst amacrine that express subthreshold amounts of ChAT and release little ACh into the production of stage II and stage III waves, particularly if SACs can be shown to produce other molecules excitatory to GCs.
SACs (and GCs) exhibit significant ionotropic GABA-induced currents (see Syed et al., Reference Syed, Lee, Zheng and Zhou2004). At E29, these are excitatory, as is common at certain stages of brain development (e.g., Ben-Ari et al., Reference Ben-Ari, Khazipov, Leinekugel, Caillard and Gaiarsa1997), and then they become inhibitory on or before P5. There is evidence that GABA is released from SACs in a Ca2+-dependent manner, both before and after the transition from GABAergic excitation to inhibition (Fig. 15c, lines 4 and 5), around P2, and that in the later phase, SACs inhibit one another via GABAA receptors (Zheng et al., Reference Zheng, Lee and Zhou2004). It is not clear at present, however, that inhibition by GABA released from SACs plays a role either in stage II or in stage III waves or any developmental role.
The emerging expression of GAD67 and GABA in SACs and of GAD65 and GABA in other ACs both occur in the first postnatal week (Fig. 15a). Nevertheless, the onset of GAD65-IR in the IPL at P1–P2, and its mature expression at P5, is better correlated with the suppression of stage III waves (red lines, Fig. 15a and b) and is localized where GABA can directly influence the release of glutamate from bipolar cells, on their axon terminals. Ribbon synapses, marking glutamate-releasing bipolar cell axon terminals, are not seen in the IPL until P9 (McArdle et al., Reference McArdle, Dowling and Masland1977). Before P9, all synapses are coded ultrastructurally as “conventional” (i.e., presumed to originate from ACs) (McArdle et al., Reference McArdle, Dowling and Masland1977). Because axon terminals exhibit a relatively mature appearance light microscopically at P5 (Fig. 1e), however, it is very likely that glutamate is released from bipolar cell axon terminals earlier at synapses coded as conventional. Thus, the suppression of stage III waves is likely to occur mainly at bipolar cell axon terminals but could also occur “downstream” at the dendrites of SACs, blocking their release of ACh.
Developmental roles of SACs
As noted above, if GABA in SACs plays a specific excitatory or inhibitory role in retinal development, that role has yet to be defined. As cholinergic neurons, however, they clearly play a role at nicotinic receptors in generating stage II waves in GCs (Zheng et al., Reference Zheng, Lee and Zhou2004, Reference Zheng, Lee and Zhou2006). Our evidence suggests that they share this role with transitory cholinergic neurons. Moreover, a role for SACs in muscarinic pharmacology during the brief period of stage III waves is possible, although spontaneous intrinsic bursting disappears in SACs after P6 (Zheng et al., Reference Zheng, Lee and Zhou2006). Cell division in outer retina continues until eye opening (P11–P12), when postmitotic cells cease to respond to muscarinic agonists, which raise cytosolic Ca+2 (Wong, Reference Wong1995). It is interesting to consider the possibility that SACs, presumably the only cholinergic neurons in rabbit retina after P4, even though narrowly stratified in the IPL, could provide nonsynaptic signals to late retinal progenitor cells in the outer retina, to the extent that acetylcholinesterase is not yet fully effective (see Feller, Reference Feller2004), and ACh released by SACs is therefore available to act at a distance.
Quantitative analysis of ChAT-immunoreactivity: Baseline in adult rabbit retina
Given the variability in peak density of rabbit GCs from individual to individual, and lower densities in albino retinas, the values we obtained for nonspecifically stained cell bodies judged to be GCs are close to those obtained in other studies using different methods of labeling (Oyster et al., Reference Oyster, Takahashi and Hurst1981, Reference Oyster, Takahashi, Fry and Lam1987; Robinson et al., Reference Robinson, Horsburgh, Dreher and McCall1987). The curve fitted to the sums of all neurons in the GCL (three types) (Fig. 12a) is very similar to that determined in another study of total neurons in the GCL of Nissl-stained retinas (Masland et al., Reference Masland, Mills and Hayden1984). Moreover, the lower curve of ChAT-immunoreactive cells (Fig. 12a) is very similar to the curve determined for 4′,6-diamidino-2-phenylindole (DAPI)- accumulating (presumed starburst) ACs in the GCL in that same study (Masland et al., Reference Masland, Mills and Hayden1984). Our estimate of 150,000–160,000 SACs in the GCL is close to previous estimates of 150,000 based on different methods (reviewed in Vaney, Reference Vaney, Osborne and Chader1990).
Quantitative analysis of ChAT-immunoreactivity: Postnatal development
ChAT-IR can be detected in a few intact cell bodies in the INL and GCL, despite the extensive apoptosis of ChAT-immunoreactive neurons in the inner retina at P0. At P1, ChAT- and GABA-IR are detected simultaneously in a small portion of displaced SACs (Fig. 9a), but ChAT-IR is rarely seen in normally placed SACs at P1. The number of ChAT-immunoreactive cells remains low throughout the first postnatal week (Fig. 13), when normally placed type a cells become labeled. Our estimates of type b SACs, ranging from 1800 to 800 cells/mm2 in midperipheral retina during the 10 days after birth, and our findings that ChAT-immunoreactive cells are present at a density generally less than 600/mm2, during that period, indicate that only a minority and gradually increasing fraction of displaced SACs expresses their characteristic neurotransmitters until the middle of the second postnatal week.
Quantitative analysis of ChAT-immunoreactivity during postnatal development in other mammals
In rat retina, a quantitative study of type a and type b ChAT-immunoreactive ACs was performed on whole mounts of E17 to P21 retinas and adult retinas (Kim et al., Reference Kim, Lee, Kim, Park and Chun2000). Calculations indicated a steady increase in the number of cells up to P15 and a decline thereafter. In that study, the increase was attributed to addition of new cells and the decrease to cell death or loss of ChAT expression. Work in mouse and rat retinas indicates, however, that few displaced ACs (the majority of which are SACs) are born after P0 (Reese & Colello, Reference Reese and Colello1992; Farah & Easter, Reference Farah and Easter2005). Thus, the increase of ChAT-immunoreactive ACs observed in rat, closely similar in temporal phase to our observations in rabbit, is likely due to increase expression of ChAT-IR in SACs, as we have concluded for rabbit.
Postnatal development of neurotransmitters in SACs and the emergence of directional selectivity: A temporal correlation
SACs are believed to play a role in the organization of co-stratifying DS GC dendrites during their development (Stacy & Wong, Reference Stacy and Wong2003). There is presently no evidence regarding its molecular basis, although homophilic interaction within individual substrata of the IPL via members of the immunoglobulin superfamily (Yamagata & Sanes, Reference Yamagata and Sanes2008) is a possibility. On the other hand, strong evidence favors a significant role for SACs in the retinal mechanism of directional selectivity in adult rabbit retina by virtue of their dendritic costratification with DS GCs and their utilization of the neurotransmitters ACh and GABA (Famiglietti, Reference Famiglietti1981; Ariel & Daw, Reference Ariel and Daw1982b; Famiglietti, Reference Famiglietti1983b; Masland et al., Reference Masland, Mills and Hayden1984; Tauchi & Masland, Reference Tauchi and Masland1984; Famiglietti & Tumosa, Reference Famiglietti and Tumosa1987; Brecha et al., Reference Brecha, Johnson, Peichl and Wässle1988; Famiglietti, Reference Famiglietti1991), as well as their DS responses (Euler et al., Reference Euler, Detwiler and Denk2002).
In the present immunocytochemical study, we have found a much smaller number of ChAT- and GABA-immunoreactive cells than the expected number of SACs in rabbit retinal samples taken during the first week of life (Fig. 13). Using data from another developmental study of rabbit retina (Robinson et al., Reference Robinson, Dreher and McCall1989), together with our own, we have estimated the number of displaced SACs at several stages during the early postnatal period (Fig. 14) and then calculated the percentage of SACs labeled by ChAT- and GABA-IR (Fig. 16a). From P0 to P7, the mean estimated percentage of labeled starburst cells rises from 7% only to 35% (Fig. 16a), even though the adult pattern of ChAT-IR is present at the end of the first postnatal week (Fig. 4d). Morphological evidence indicates that by P8, adult morphology of distal SAC synaptic boutons is discerned in Golgi preparations (data not shown), except that the attenuation of intermediate and distal dendrites, characteristic of adult SACs, has not yet occurred. At P10, SACs have the key structural characteristics of adult cells (Fig. 1c and Wong & Collin, Reference Wong and Collin1989), particularly in regard to the attenuation of intermediate and distal dendritic branches. In the second week, the percentage of ChAT-immunoreactive SACs rises from 30% to more than 85%. A curve drawn by hand through the scatter of points reaches 100% at P14 (Fig. 16a).
Graphs: temporal comparison of the estimated percentage of SACs expressing neurotransmitter markers to physiological responses of GCs during postnatal development. (a) Calculated increase in percent of type b SACs expressing ChAT-IR (and GABA-IR) with increasing postnatal age, from Fig. 14c–14e. Curve fitted by eye. (b) GC responses. GCs are responsive to ACh at birth and first exhibit photic responses at P8. DS and center-surround responses occur at P10, and DS GCs reach adult levels at P14, shortly after eye opening. Thus, it appears that about 50% of type b SACs express mature neurotransmitter markers, when the first DS responses are observed. At P14–P15, there is temporal coincidence in adult frequencies of DS cells and in adult percentages of starburst expressing neurotransmitters.

A comparison of the temporal course of estimated percentage increase of neurotransmitter expression in SACs and the appearance of DS GCs in rabbit retina (Masland, Reference Masland1977), in Fig. 16, shows that the first visual responses are detected at P8 (Fig. 16b), when it is estimated that only a third of SACs express ChAT-IR. The first DS responses appear at P10, when approximately 50% of displaced SACs are labeled by ChAT-IR (and GABA-IR). From this time forward, therefore, SACs begin to play their adult nicotinic excitatory role (and possibly a GABAergic inhibitory role) in retinal information processing. The adult percentage of DS GCs is reached by P14, just after eye opening (Fig. 16b) (Masland, Reference Masland1977), when all type b SACs are presumably labeled (Fig. 16a). One interpretation of the present study, as well as other developmental studies, and the results of chronic ablation (e.g., Yoshida et al., Reference Yoshida, Watanabe, Ishikane, Tachibana, Pastan and Nakanishi2001; Amthor et al., Reference Amthor, Keyser and Dmitrieva2002), taken altogether, is that SACs function in a network that depends on a critical density of cells for its operation in the DS mechanism.
A role for SACs in the DS mechanism
It has been demonstrated that the distal dendrites of adult SACs exhibit DS responses (Euler et al., Reference Euler, Detwiler and Denk2002). Curiously, however, GABAA antagonists, which should block both DS responses in DS GCs and mutual inhibition in a network of SACs, do not block directional selectivity in the dendrites of SACs (Euler et al., Reference Euler, Detwiler and Denk2002). Two recent studies suggest on the one hand that the DS responses of SACs may arise from a combination of their intrinsic geometry and a proximodistal voltage gradient (Hausselt et al., Reference Hausselt, Euler, Detwiler and Denk2007) and on the other that a differential proximodistal distribution of synaptic inputs, first demonstrated by electron microscopy (Famiglietti, Reference Famiglietti1991), in combination with mutual GABAergic inhibition is responsible for DS responses in SACs (Lee & Zhou, Reference Lee and Zhou2006). In view of these apparently contradictory results, it is unclear at present whether network or intrinsic properties of SACs are responsible for their DS responses. Moreover, it is not yet certain that the DS responses of SACs are directly responsible for the DS responses of DS GCs. Other synaptic elements to consider are bipolar cell axon terminals and their GAD65-IR inputs, which could contribute to DS responses in both SACs and DS GCs (Famiglietti, Reference Famiglietti1993, Reference Famiglietti2002, Reference Famiglietti2005).
Acknowledgments
This work was supported in part by the Natural Science and Engineering Research Council of Canada, the Alberta Heritage Foundation for Medical Research, and the Lions Sight Centre of the University of Calgary and was initiated in the Neuroscience Research Group and the Department of Anatomy, University of Calgary, Faculty of Medicine, Calgary, Alberta, Canada. We are grateful to L.B. Hersh, P.V. Sarthy, N.C. Brecha, and W.K. Stell for provision of several antibodies used in this study and to W.K. Stell and A.L. Kyle for advice. N.W. Daw, C.B. Barnstable, and unidentified reviewers made helpful comments on the manuscript. D.M. Moxham provided unstinting moral support.