I. INTRODUCTION
Cu–Be alloys have been the most widely used elastic copper alloy because of their combination of super high strength, good electrical conductivity, excellent wear resistant, and corrosion resistant. Reference Hasegawa, Takagawa, Watanabe and Monzen1–Reference Henmi and Nagai3 The hardness of commercial Cu–2Be alloy was over 350 HV after cold rolled by 37% and aged at 275 °C for 2 h. Reference Henmi and Nagai3 Recently, a series of elastic copper alloy such as Cu–Ni–Sn, Cu–Ti, Cu–Ni–Si, and Cu–Ni–Al alloys have been developed to substitute the toxic Cu–Be alloys. It was reported that hardness and tensile strength of Cu–10Ni–3Al–0.8Si alloy could reach up to 380 HV and 1124 MPa, which made Cu–Ni–Al alloy the most promising elastic material in a series of applications, such as springs, bearings, tubes, and gears. Reference Shen, Li, Dong, Xiao, Wang, He and Lei4,Reference Shen, Li, Dong, Xiao, Li and Lei5 Hot deformation processes such as forging, rolling, and extrusion, are applied to manufacture bulk copper alloys. The deformation ability of copper alloys influences their microstructures and properties. The hot compression tests are used to simulate the actual forming operations in terms of stress state and strain rate, to select the optimal condition with excellent workability, identify microstructure, and crystal orientation. Reference Oh, Semiatin and Jonas6 During hot compression, deformation bands (DBs) and textures form due to the heavy deformation, while dynamic recovery and dynamic recrystallization occur because of relatively high temperature, resulting in the changes of the texture and microstructure. Reference Petkovic, Luton and Jonas7–Reference Lei, Li, Wang, Li, Zhang and Dong9 However, the evolution of microstructure and crystal orientation of Cu–Ni–Al–Si alloy during hot compression process have not been fully investigated.
In this paper, the hot deformation behavior of Cu–10Ni–3Al–0.8Si alloy was studied. The influence of temperature and strain rate on microstructure and crystal orientation was also investigated. The processing map was established and the optimal condition of this alloy for processing was determined.
II. EXPERIMENTAL PROCEDURE
A. Material preparation
The designed Cu–10Ni–3Al–0.8Si alloy (wt%) was prepared in an intermediate frequency furnace. After the surface defects were removed, the ingot was isothermal treated at 920 °C for 2 h and then cut into cylinder samples with dimension of Φ8 mm × 12 mm by a wire electrical discharge machining.
B. The hot compressing tests
The hot deformation experiments were conducted on a Gleeble-3500 thermal simulator (Dynamic Systems Inc., Redmond, Washington) under Ar atmosphere. The experimental temperatures were 750, 800, 850, 900, and 950 °C, and the strain rates were 0.01, 0.1, 1, and 5 s−1, respectively. The lubricants were a mixture solution of graphite, No. 45 engine oil and tricresyl nitrate ester with volume ratio of 15:4:1. All the samples were hot compressed by 60% and then quenched in water. The friction between the samples and machine can be reduced by application of lubricant, but cannot be eliminated completely. To obtain accurate true stress–strain curves and thermal activation energy, the model based on the upper-bound theorem was applied to estimate the friction during hot compression tests. Reference Drucker10 The amended true stress can be calculated as following Reference Ebrahimi and Najafizadeh11,Reference Avitzur12 :
 $$\sigma = {{P{{\left( {{{2mR} \over h}} \right)}^2}} \over {2\left[ {\exp \left( {{{2mR} \over h}} \right) - {{2mR} \over h} - 1} \right]}}\quad ,$$
 $$R = {R_0}\sqrt {{{{h_0}} \over h}} \quad ,$$
 $$m = {{3\sqrt 3 {R_1}\left( {{R_{\rm{M}}} - {R_1}} \right)} \over {3{R_1}h - 2{h_1}\left( {{R_{\rm{M}}} - {R_1}} \right)}}\quad ,$$
 $${R_1} = \sqrt {3{{{h_0}} \over {{h_1}}}{R_0}^2 - 2{R_{\rm{M}}}^2} \quad ,$$
where, P is the initial true stress, m is the friction factor; h 0 is the initial height of the sample; ∆h is the displacement; h is the instantaneous height of the sample, and h = h 0 − ∆h; h 1 is the height of the sample after compression; R 0 is the initial radius of the sample; R is the instantaneous radius of the sample, R M is the maximum radius of the sample after compression; and R 1 is the radius of the bottom of sample.
C. Microstructure observation
The optical microstructure (OM) observation was conducted on a Leica optical microscope (Leica Microsystems, Wetzlar, Germany). Texture measurements were carried out on a Bruker D8 Discover machine (Bruker Corporation, Karlsruhe, Germany). Inverse pole figures of the planes {200}, {220}, and {222} were measured. Defocusing correction was carried out by a random specimen of pressed and sintered high purity Cu powder. The electron backscatter diffraction (EBSD) observation was performed on a FEI Sirion 200 scanning electron microscope (FEI Company, Eindhoven, The Netherlands). The results were analyzed using the Orientation Imaging Microscopy (OIM) Analysis 5 software. The samples for texture measurements and EBSD observation were sectioned parallel to the compression axis along the direction of centerline, then abraded and electrolytic polished in a mixing solution of H3PO4 and ethanol with a ratio of 1:1 at room temperature. Transmission electron microscopy (TEM) observation and selected area diffraction patterns (SADP) were performed on a JEM-2100F (JEOL Ltd., Tokyo, Japan), with the operation voltage of 200 kV. The specimens for TEM observation were mechanically reduced to 0.06 mm and then electron-polished by the standard twin-jet electro-polishing method using the methanol-nitric acid solution with a ratio of 3:1 at a temperature between −20 and −30 °C.
III. RESULTS AND DISCUSSION
A. Flow stress behavior
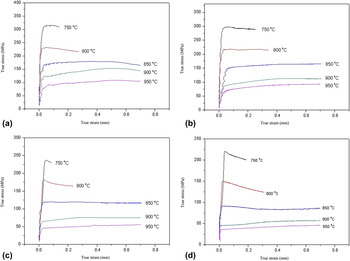
The true stress–strain curves of isothermal treated Cu–10Ni–3Al–0.8Si alloy are shown in Fig. 1. The results indicated that true stress increased rapidly initially until the peak values approached. The work hardening played the main role at the initial stage of compression. A plenty of dislocations were introduced during hot compressing. Those dislocations were able to interact with secondary phases or tangle with each other, resulting in the increase of strength and true stress. As hot compressed at low temperature (between 750 and 800 °C), the samples broke as true strain increased. Increasing compression temperature, the peak value of true stress decreased and the true stress remained its peak value as true stain further increased. Except for work hardening, recovery and recrystallization also occurred during hot compression process and decreased the amount of dislocation and crystal defects, resulting in the decrease of true stress. The effect of both work hardening, recovery and recrystallization almost kept balance, as a result, the true stress remained unchanged. Recovery and recrystallization were thermal active processes, which would be promoted with evaluated compression temperature and decrease of strain rate (increase of hot compressing time), resulting in the decrease of resisting force of hot compression. Therefore, the peak value of true stress slightly decreased as temperature increased and strain rate decreased.
True stress–strain curves of Cu–10Ni–3Al–0.8Si alloy with different strain rates and temperatures (a) 5 s−1; (b) 1 s−1; (c) 0.1 s−1; (d) 0.01 s−1.

According to the flow stress–strain model, Reference Wanjara, Jahazi, Monajati, Yue and Immarigeon13 the influence of strain rate, thermal activation energy, and hot compression temperature on true stress can be explained as following:
 $$\dot \varepsilon = AF\left( \sigma \right)\,\exp \left( { - {Q \over {RT}}} \right)\quad ,$$
where,
 $\dot \varepsilon$
is strain rate; σ is the flow stress; Q is thermal activation energy; T is hot compression temperature; A is a constant, and R is the gas constant.
And F(σ) is closely related to the stress Reference Zhang, Li, Lei, Qiu and Luo14 :
 $$\left\{ \matrix{ F\left( \sigma \right) = \exp \left( {\beta \sigma } \right)\,\,\,\,\,\,\,\,\,\,\,\,\,\,\,\alpha \sigma > 1.2 \hfill \cr F\left( \sigma \right) = {\sigma ^n}\,\,\,\,\,\,\,\,\,\,\,\,\,\,\,\,\,\,\,\,\,\,\,\,\,\,\,\,\hskip+2pt\alpha \sigma \hskip3pt\lt \hskip3pt0.8 \hfill \cr F\left( \sigma \right) = {\left[ {\sinh \left( {\alpha \sigma } \right)} \right]^n}\,\,\,\,\,\,\,{\rm{for\ all\ the\ values}} \hfill \cr} \right.$$
here, n, β, and α are constants, while α = β/n.
Combining Eqs. (5) and (6), the thermal activation energy can be calculated as following:
 $$Q = R\left\{ {{{\partial \ln \,\dot \varepsilon } \over {\partial \ln \left[ {\sinh \left( {\alpha \sigma } \right)} \right]}}} \right\}\left\{ {{{\partial \ln \left[ {\sinh \left( {\alpha \sigma } \right)} \right]} \over {\partial \left( {{1 \mathord{\left/ {\vphantom {1 T}} \right. \kern-\nulldelimiterspace} T}} \right)}}} \right\} = Rn'S\quad ,$$
where, n′ and S are constants.
Figure 2 presents the plots of ln
 $\dot \varepsilon$
versus σ, ln
 $\dot \varepsilon$
versus ln σ, ln[sinh(ασ)] versus ln
 $\dot \varepsilon$
and 1000/T versus ln[sinh(ασ)]. The value of β, n, n′, and S was obtained by calculating the average value of the slope of the straight lines in each figure. The value of β, n, n′, and S was about 0.055, 8.09, 5.81, and 8.21, respectively, while the value of α and ln A is 0.0068 and 40.76, respectively. Therefore, the calculated thermal activation energy of Cu–10Ni–3Al–0.8Si alloy during hot compression was about 396.57 kJ/mol.
The (a) ln[sinh(ασ)] − ln
 $\dot \varepsilon$
, (b)
 $\ln \,\dot \varepsilon - \ln \,\sigma$
, (c)
 $\ln \,\dot \varepsilon - \sigma$
and (d) ln[sinh(ασ)] − 1000/T curves of Cu–10Ni–3Al–0.8Si alloy.

B. Processing map
Based on the dynamic material modeling, Reference Prasad, Gegel, Doraivelu, Malas, Morgan, Lark and Barker15,Reference Anbuselvan and Ramanathan16 the processing map of hot compressed alloy can be established by calculating the power dissipation efficiency factor and Rheological unstable zone:
 $$\eta = {{2m} \over {m + 1}}\quad ,$$
 $$\xi \left( {\dot \varepsilon } \right) = {{\partial \ln \left( {{m \over {m + 1}}} \right)} \over {\partial \ln \,\dot \varepsilon }} + m \lt 0\quad ,$$
 $$m = {{\partial \ln \,\sigma } \over {\partial \ln \,\dot \varepsilon }}\quad ,$$
where, η is the power dissipation efficiency factor;
 $\xi \left( {\dot \varepsilon } \right)$
is criterion of Rheological instability; and m is the sensitivity index of strain rate.
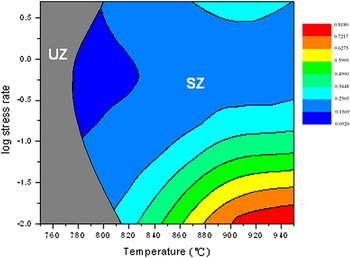
Figure 3 shows the processing map with strain rate of 0.6. The hot compression conditions with different power dissipation efficiencies were shown with different colors. The shaded area presented the Rheological instable zone, indicating that flow stress was unstable when hot compression temperature was below 820 °C. The appropriate compression temperature for Cu–10Ni–3Al–0.8Si alloy was between 900 and 950 °C.
The processing map of Cu–10Ni–3Al–0.8Si alloy.

C. Texture evolution
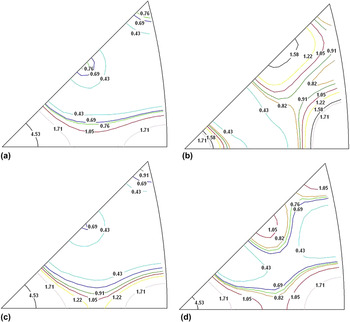
The inverse pole figures of Cu–10Ni–3Al–0.8Si alloy after hot compressed at different temperatures and strain rates are shown in Fig. 4, and the polar density of each type of texture is shown in Table I. As compressed at 750 °C with low strain rate, the typical texture of hot compressed sample was 〈001〉 and 〈011〉 fiber texture, and the polar density of 〈001〉 and 〈011〉 fiber texture was 3.24 and 3.53, respectively; while, the polar density of 〈001〉 and 〈111〉 fiber texture increased significantly with the increase of temperature, however, that of 〈011〉 and 〈112〉 fiber texture slightly decreased. When the hot compression temperature was fixed, the polar density of 〈001〉 fiber texture decreased and that of 〈011〉 and 〈112〉 fiber texture increased with the decrease of strain rate.
The inverse pole figures of Cu–10Ni–3Al–0.8Si alloy after hot compressed at different temperatures and strain rates (a) 5 s−1 at 750 °C; (b) 0.01 s−1 at 750 °C; (c) 5 s−1 at 950 °C; (d) 0.01 s−1 at 950 °C.

The polar density of texture after hot compressed at different hot compression conditions.

During hot compression, the formation of micro slipping band resulted from the slipping of atomic plans. The accumulation of micro slipping band resulted in the deformation and torsion of the grain. Except for slipping, recrystallization also occurred during hot compression. Both the movement of dislocations and the nucleation of recrystallization are thermal active processes, which increase with the hot compression temperature. Reference Baudin, Etter and Penelle17 When the alloy was hot compressed at 750 °C, the deformation resist force decreased with the decrease of strain rate, then the original grains with 〈001〉 texture rotated easily, resulting in the increase of 〈011〉 texture. As the compression temperature increased to 950 °C, recrystallization was accelerated, as a result, the amount of recrystallization 〈001〉 texture (also the original texture) increased.
D. Microstructure observation
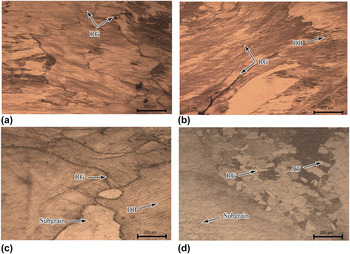
The microstructure of Cu–10Ni–3Al–0.8Si alloy with different hot compression conditions is shown in Fig. 5. DBs formed, while a few recrystallization grains (RGs) were observed in the samples after hot compressed at 750 °C with strain rate of 5 and 0.01 s−1 [Figs. 5(a) and 5(b)]. As the sample hot compressed at 950 °C with strain rate of 5 s−1, RGs nucleated both along the grain boundary and in the grains, while subgrains and DBs were observed in part of the grains [Fig. 5(c)]. When the sample was compressed at 950 °C with strain rate of 0.01 s−1, RG coarsened rapidly and annealing twins formed, while the amount of subgrains decreased [Fig. 5(d)]. The typical observation OM of the alloy indicated that both recrystallization and recovery were accelerated as the strain rate decreased and temperature increased.
The microstructure of Cu–10Ni–3Al–0.8Si alloy after hot compressed at different temperatures and strain rates (a) 5 s−1 at 750 °C; (b) 0.01 s−1 at 750 °C; (c) 5 s−1 at 950 °C; (d) 0.01 s−1 at 950 °C.

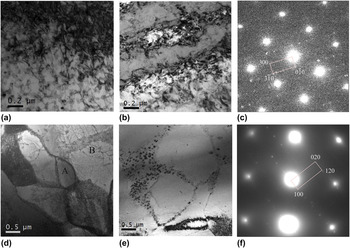
Figure 6 shows the bright field micrographs of the alloy after hot compressed at different temperature with different strain rate. After hot compressed at 750 °C with strain rate of 5 s−1, except for Ni2Si precipitates, a plenty of dislocations formed in the sample. Those dislocations tangled with each other and interacted with precipitates [Figs. 6(a) and 6(c)], resulting in work hardening and the increase of deformation resisting force. As the amount of dislocations increased to the limits, micro-crack formed, resulting in the crack of the samples. As strain rate decreased to 0.01 s−1, the amount of dislocations decreased, indicating that recovery was accelerated [Fig. 6(b)]. When the sample was hot compressed at 950 °C with strain rate of 5 s−1, only a few Ni2Si particles precipitated [Figs. 6(d) and 6(f)]. Besides, dynamic discontinuous recrystallization occurred and equiaxed grains with size of about 0.5 μm formed (marked as Grain A); while dislocations remained and subgrain boundaries was observed in part of the grain (marked as Grain B), indicating that continuous recrystallization resulting from recovery occurred [Fig. 6(d)]. Further decreasing strain rate to 0.01 s−1, recrystallization completed [Figs. 6(e) and 5(d)]. Since the amount of precipitates and dislocations decreased while recrystallization and recovery increased as hot compression temperature increased to 950 °C, the hot deformation resist force decreased.
The TEM micrographs of Cu–10Ni–3Al–0.8Si alloy after hot compressed at different temperatures and strain rates (a) 5 s−1 at 750 °C; (b) 0.01 s−1 at 750 °C; (c) the SADP of (a); (d) 5 s−1 at 950 °C; (e) 0.01 s−1 at 950 °C; (f) the SADP of (d).

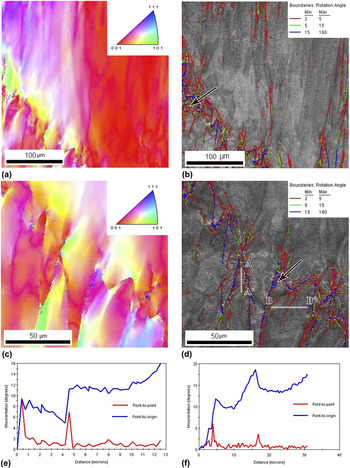
The EBSD maps of isothermal treated samples after hot compressed at 750 °C with strain rate of 0.01 and 5 s−1 are shown in Fig. 7. Nonuniform deformation occurred in an individual grain and dynamic discontinuous RGs nucleated along the grain boundary in both samples [Figs. 7(a) and 7(c)]. Discontinuous RGs were able to nucleate in the Cu–10Ni–3Al–0.8Si alloy because of its low stacking fault energy. Reference Zhao, Zhu, Liao, Horita and Langdon18 The different parts of the grain rotated and were divided by small-angle boundaries (SAB, rotation angle <5°) [Figs. 7(b) and 7(d)]. The normal direction of most grains was nearly parallel to 〈001〉 direction. Besides, a plenty of micro-DBs formed in the grains as strain rate increased to 5 s−1 [marked with black arrow in Fig. 7(d)], and the average angle between those micro-DBs and compression deformation axis was about 48°. Misorientation was observed across those micro-DBs, as shown in Fig. 7(e). The misorientation accumulated and a continuous rotation exhibited in the grain [Fig. 7(f)], due to the difference of stress in different parts of the grain.
The EBSD maps of isothermal treated alloy after hot compressed at 750 °C with different strain rate. (a) Orientation map of 0.01 s−1; (b) corresponding Image Quality (IQ) map of 0.01 s−1; (c) orientation map of 5 s−1; (d) corresponding IQ map of 5 s−1; (e) the measured misorientations along A–A′; (f) the measured misorientations along B–B′.

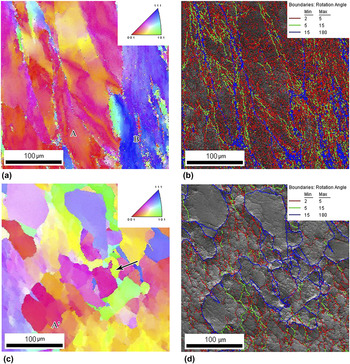
Figures 8(a) and 8(b) present the EBSD observation of isothermal treated alloy after hot compressed at 950 °C with strain rate of 5 s−1. Compared with the sample hot compressed at 750 °C with strain rate of 5 s−1, uniform plastic deformation was observed in the grains after compressed at 950 °C with the same strain rate. Except for DBs, two types of typical grains were observed, which were marked with grain A and grain B in Fig. 8(a). A plenty of subgrains formed in the grain A with normal direction along 〈001〉; while subgrains with dislocation boundaries formed due to the decrease of deformation resistance and accumulation of a great many of dislocations after hot compressed at evaluated temperature. Reference Su, Nelson, Mishra and Mahoney19 Besides, small equiaxed grains with large-angle boundary (LAB, rotation angle >15°) formed in grain B with normal direction along 〈111〉, indicating the nucleation of dynamic discontinuous recrystallization. The average grain size of those discontinuous RGs was about 4 μm. As strain rate further decreased to 0.01 s−1 [Figs. 8(c) and 8(d)], the equiaxed discontinuous RGs without dislocation boundaries grew up to about 20 μm (marked with black arrows). Especially, trace of dislocation boundaries was observed in the grain with normal direction along 〈001〉 (marked with grain A′), indicating that the growth of subgrains resulted from the dynamic recovery but out from the nucleus. Such evolution can be referred to dynamic continuous recrystallization. Reference Gourdet and Montheillet20 The driving force of growth of the subgrains is the decrease of strain-induced energy. The dislocations reacted with each other and encouraged the coalescence of adjacent cells during recovery, leading to increase of the subgrain size and decrease of dislocation boundaries. Reference Lei, Li, Wang, Xie, Chen, Li, Gao and Li21
The EBSD maps of isothermal treated alloy after hot compressed at 950 °C with different strain rates. (a) Orientation map of 5 s−1; (b) corresponding IQ map of 5 s−1; (c) orientation map of 0.01 s−1; (d) corresponding IQ map of 0.01 s−1.

To further analyze the influence of hot compression conditions on the evolution of microstructure, the Zener–Hollomon parameter (temperature-corrected strain rate) Z is applied, which can be expressed in terms of the thermal activation energy, temperature, and strain rate Reference Li, Zhang, Tao and Lu22,Reference Jafari and Najafizadeh23 :
 $$Z = \dot \varepsilon \,\exp \left( {{Q \over {RT}}} \right)\quad .$$
The calculated results of the Zener–Hollomon parameter under different hot compression conditions are shown in Table II. The Zener–Hollomon parameter of the sample hot compressed at 750 °C with strain rate of 5 s−1 was 8.88 × 10²⁰, while that of the sample compressed at 950 °C with strain rate of 0.01 s−1 decreased to 8.67 × 10¹⁴, indicating that the Zener–Hollomon parameter decreased as compression temperature increased or strain rate decreased.
The calculated Zener–Hollomon parameter under different hot compression conditions.

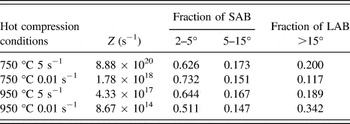
The relationship between the fraction of boundaries with different misorientation angles and Zener–Hollomon parameter is shown in Table III. When the alloy was hot compressed at low temperature, both recovery and discontinuous recrystallization occurred, while the fraction of very small-angle boundary (2–5°) increased as Zener–Hollomon value decreased, indicating that dynamic discontinuous recrystallization was the main softening mechanism of the alloy. Reference Tan and Tan24 Further decreasing the Zener–Hollomon value, the fraction of small-angle boundary and dislocation boundaries decreased, while that of large-angle boundary increased and the grain size of subgrains coarsened. The analysis was in accordance with the observation of microstructure [Figs. 5(a), 5(b), 7, and 8]. Continuous recrystallization resulting from dynamic recovery occurred at high temperature. Reference Gourdet and Montheillet25 Both continuous recrystallization and dynamic discontinuous recrystallization were softening mechanisms of the Cu–10Ni–3Al–0.8Si alloy.
The fraction of boundaries with different misorientation angles under different hot compression conditions.

IV. CONCLUSIONS
-
(1) The true stress increased rapidly at the initial stage of hot compression. After reaching up to the peak values, true stress remained the same or slightly decreased. The peak value of true stress and the Zener–Hollomon parameter decreased with the increase of temperature and decrease of strain rate.
-
(2) The calculated thermal activation energy of Cu–10Ni–3Al–0.8Si alloy was about 396.57 kJ/mol. The processing map was established and the appropriate compression temperature was between 900 and 950 °C.
-
(3) The typical texture of hot compressed samples was 〈001〉 and 〈011〉 fiber texture. Increasing compressing temperature or strain rate, the polar density of 〈001〉 fiber texture increased, while that of 〈011〉 fiber texture decreased.
-
(4) Dynamic discontinuous recrystallization nucleated and DBs formed at 750 °C. The formation of continuous recrystallization and equiaxed discontinuous RGs was accelerated with the increase of temperature and the decrease of strain rate.
ACKNOWLEDGMENTS
The work was supported by the Grants from the Project of Innovation-driven Plan in Central South University, the National Natural Science Foundation of China (51271203), the Open-End Fund for the Valuable and Precision Instruments of Central South University (CSUZC201522), the Aid program for Science and Technology Innovative Research Teams in Higher Educational Institutions of Hunan Province, and the State Key Laboratory of Powder Metallurgy of Central South University.