Introduction
Visual information is processed through multiple parallel pathways in the retina (Wässle, Reference Wässle2004). Retinal bipolar cells, which relay visual information from photoreceptors to retinal third-order neurons, consist of multiple types of cells with diverse physiological properties (Awatramani & Slaughter, Reference Awatramani and Slaughter2000; Euler & Masland, Reference Euler and Masland2000; Wu et al., Reference Wu, Gao and Maple2000). The existence of multiple bipolar cell types is believed to be the important anatomical substrate for segregating visual information into parallel pathways. Increasing evidence suggests that voltage-dependent membrane channels may contribute to the diverse physiological properties of bipolar cells (Burrone & Lagnado, Reference Burrone and Lagnado1997; Mao et al., Reference Mao, MacLeish and Victor1998; Zenisek & Matthews, Reference Zenisek and Matthews1998; Protti et al., Reference Protti, Flores-Herr and von Gersdorff2000; Ma et al., Reference Ma, Cui and Pan2005). Among these channels, voltage-dependent Ca2+ channels may be particularly important, since the activation of these channels could depolarize the membrane potentials and thereby shape the response waveform of bipolar cells, as well as initiate neurotransmitter release at their axon terminals.
Voltage-dependent Ca2+ channels in retinal bipolar cells consist primarily of the sustained L-type (Kaneko et al., Reference Kaneko, Suzuki, Pinto and Tachibana1991; Heidelberger & Matthews, Reference Heidelberger and Matthews1992; Tachibana et al., Reference Tachibana, Okada, Arimura and Kobayashi1993; Protti et al., Reference Protti, Flores-Herr and von Gersdorff2000) and the transient T-type (Kaneko et al., Reference Kaneko, Pinto and Tachibana1989; Maguire et al., Reference Maguire, Maple, Lukasiewicz and Werblin1989; Protti & Llano, Reference Protti and Llano1998; Satoh et al., Reference Satoh, Aoki, Watanabe and Kaneko1998, Pan, Reference Pan2000). Previous studies have reported the heterogeneous expression of L- and T-type currents among bipolar cells (Protti & Llano, Reference Protti and Llano1998; Pan, Reference Pan2000). Three Ca2+ channel α subunits, α1G (CaV3.1), α1H (CaV3.2), and α1I (CaV3.3), are known to underlie T-type Ca2+ currents (Perez-Reyes et al., Reference Perez-Reyes, Cribbs, Daud, Lacerda, Barclay, Williamson, Fox, Rees and Lee1998; Perez-Reyes, Reference Perez-Reyes2003). The Ca2+ current of each α subunit exhibits unique pharmacological and biophysical properties (Lee et al., Reference Lee, Gomora, Cribbs and Perez-Reyes1999; McRory et al., Reference McRory, Santi, Hamming, Mezeyova, Sutton, Baillie, Stea and Snutch2001; Todorovic et al., Reference Todorovic, Jevtovic-Todorovic, Meyenburg, Mennerick, Perez-Reyes, Romano, Olney and Zorumski2001). The messenger RNA of all three of these α subunits has been detected in the retina and in retinal bipolar cells (Pan et al., Reference Pan, Hu, Perring and Andrade2001). The cellular expression pattern of L- versus T-type Ca2+ currents among retinal cone bipolar cells, however, remains unclear. Furthermore, the detailed pharmacological and biophysical properties of T-type Ca2+ currents in retinal bipolar cells still remain to be studied.
In this study, we used whole-cell patch-clamp recordings to investigate the properties of T-type Ca2+ currents in acutely dissociated retinal bipolar cells from rats. We observed one broad group of cone bipolar cells with prominent T-type Ca2+ currents (T-rich), in contrast to another broad group of cone bipolar cells with prominent L-type Ca2+ currents (L-rich). Furthermore, the T-rich cone bipolar cells could be divided into three subgroups, each of which predominantly expresses a single dominant T-type Ca2+ channel subunit.
Materials and methods
Preparation of isolated bipolar cells
Bipolar cells were isolated from Long–Evans rats (>4 weeks old) using previously described dissociation methods (Pan, Reference Pan2000). All animal experiments and procedures were approved by the Institutional Animal Care Committee at Wayne State University and were in accordance with the NIH Guide for the Care and Use of Laboratory Animals. In brief, animals were deeply anesthetized with CO2 and killed by decapitation. Retinas were removed and placed in Hanks’ solution (normal Hanks’) containing (in mM) 138 NaCl, 1 NaHCO3, 0.3 Na2HPO4, 5 KCl, 0.3 KH2PO4, 1.25 CaCl2, 0.5 MgSO4, 0.5 MgCl2, 5 HEPES, 22.2 glucose, and 0.001% (v/v) phenol red, with the pH adjusted to 7.2 using 0.3 N NaOH. The retinas were incubated for ~50 min at 34–37°C in an enzyme solution that consisted of Hanks’ solution supplemented with 0.2 mg/ml dl-cysteine, 0.2 mg/ml bovine serum albumin, and 1.6 U/ml papain, with the pH adjusted to 7.2 using 0.3 N NaOH. After several rinses in Hanks’ solution, retinas were mechanically dissociated by gentle trituration with a glass pipette. The resulting cell suspension was plated onto culture dishes, and cells were usually used for recordings within 5 h after dissociation.
Bipolar cells were identified based on their characteristic morphology (Karschin & Wässle Reference Karschin and Wässle1990). Identification of dissociated rod and cone bipolar cells has been previously described (Pan, Reference Pan2000). In brief, rod bipolar cells had long and thick axons and usually retained axon terminals. Cone bipolar cells, on the other hand, had sparser dendritic trees and thinner axons, but their terminal varicosities were mostly absent.
HEK cell culture and DNA transfection
HEK-293 cells were maintained in Dulbecco’s modified Eagle’s medium (Gibco/BRL, Grand Island, NY) supplemented with 10% fetal bovine serum, 100 U/ml penicillin G, and 100 μg/ml streptomycin at 37°C in a humidified atmosphere of 95% air and 5% CO2. For preparing DNA transfection, cells were seeded in 35-mm dishes, each with 3–5 × 10⁴ counts. When the cells had reached 70% confluence, they were transfected with cDNA of rat α1G, human α1H, or rat α1I kindly provided by Dr. Perez-Reyes using Lipofectamine (Invitrogen, San Diego, CA) according to the manufacturer’s instructions. All experiments were carried out 16–48 h after transfection. Before recording, the culture medium was replaced with normal Hank’s solution containing 2.5 mM Ca2+.
Electrophysiological recordings
Recordings with patch electrodes in the whole-cell configuration were made using standard procedures (Hamill et al., Reference Hamill, Marty, Neher, Sakmann and Sigworth1981) at room temperature (20–25°C) with an EPC-9 amplifier and PULSE software (Heka Electronik, Lambrecht/Pfalz, Germany). Electrodes were coated with silicone elastomer (Sylgard; Dow Corning, Midland, MI) and fire-polished. The resistance of the electrode was 7–14 MΩ. Series resistance ranged from 12 to 40 MΩ and was not compensated. Cell capacitance was canceled and recorded using the PULSE software. Recordings were made either in the Hanks’ solution (with 2.5 mM Ca2+), described in the preceding text, or in high-Ca2+ (10 mM) extracellular solution containing (in mM) 95 NaCl, 5 KCl, 10 CsCl, 20 tetraethylammonium (TEA)-Cl, 1 MgCl2, 10 CaCl2, 5 HEPES, 22.2 glucose, and 0.001% (v/v) phenol red, with the pH adjusted to 7.2. The electrode solution contained (in mM) 120 CsCl, 20 TEA-Cl, 1 MgCl2, 0.5 CaCl2, 5 EGTA, 10 HEPES, 0.5 Na-GTP, and 2 Na-ATP, with the pH adjusted to 7.4 using CsOH. The electrode solution in the current clamp contained (in mM) 133 K-gluconate, 7 KCl, 1 MgCl2, 0.5 CaCl2, 5 EGTA, 10 HEPES, 0.5 Na-GTP, and 2 Na-ATP, with the pH adjusted to 7.4 using KOH. Liquid junction potentials were corrected according to the procedure described by Neher (Reference Neher1992). Chemical agents were applied by local perfusion using gravity-driven superfusion pipettes placed ~200–300 μm away from the cell being recorded. The recording interval was 10 s, and only stable traces were used for analysis.
To examine voltage-gated Ca2+ currents, recordings were made in 10 mM Ca2+ extracellular solutions, and voltage-activated K+ currents were suppressed by the inclusion of Cs (10 mM) and TEA (10 mM) in the recording electrode and extracellular solutions. Bipolar cells were usually held at −80 mV and depolarized by a voltage ramp from −80 to +40 mV at a speed of 100 mV/s and by either a single 400-ms test pulse to −40 mV or a series of test pulses ranging from −60 to +40 mV. Some cone bipolar cells were also recorded in the current-clamp mode. In these cases, cells were first recorded in voltage-clamp mode at the holding potential of −80 mV. The recordings were then switched to current-clamp mode in which the amplifier delivered sufficient current to maintain the cell at the holding potential used in the voltage clamp.
Data were analyzed off-line using ORIGIN software (Microcal Software, Northampton, MA). The redox modulation, Ca2+/Ba2+ permeability, and Ni2+ inhibition of T-type currents were measured according to peak currents in response to the step pulse to −40 mV from a holding potential of −80 mV. Traces that could be repeated at least twice were deemed stable and were included in the analyses. Differences between groups were analyzed by one-way analysis of variance (ANOVA), and P values <0.05 were considered significant unless indicated otherwise. All data are presented as mean ± s.d.
Chemicals
Drugs were applied by dissolving the drugs at known concentrations in the extracellular recording solutions. Ni2+ and dithiothreitol (DTT) were prepared as 100 mM stocks in water, 5,5′-dithio-bis(2-nitrobenzoic acid) (DTNB) was prepared as 100 mM stock, and nimodipine was prepared as 10 mM stock in dimethyl sulfoxide (DMSO). DMSO (0.5%) had no effects on Ca2+ currents when tested alone in isolated retinal bipolar cells or HEK cells transfected with Ca2+ channel subunit complementary DNAs. To test the relative permeability of Ba2+versus Ca2+, CaCl2 (10 mM) was replaced by an equal molar concentration of BaCl2. In some recordings, 1 μM tetrodotoxin (TTX) was included in the extracellular recording solutions to block possible voltage-gated Na+ currents in cone bipolar cells. Mibefradil was a kind gift from F. Hoffmann (La Roche, Basel, Switzerland). All other chemicals were purchased from Sigma (St. Louis, MO).
Results
Expression patterns of T- and L-type Ca2+ currents in retinal cone bipolar cells
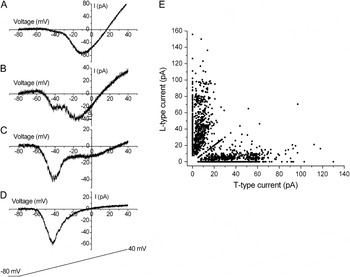
Two types of Ca2+ currents, T- and L-types, were observed in retinal cone bipolar cells from rats. Using voltage ramp stimulation, the T-type Ca2+ currents were activated at a membrane potential near −60 mV, and they reached their peak around −40 mV. In contrast, the L-type Ca2+ currents were activated at a higher membrane potential (near −40 to −30 mV), and they reached their peak around −20 or −10 mV (Fig. 1A). Based on the magnitude of T- and L-type currents, we were able to distinguish three groups of cone bipolar cells. The first group showed prominent L-type currents with small or no apparent T-type current (n = 990, Fig. 1A). The second group displayed both prominent T- and L-type currents (n = 27, Fig. 1B), and the third group showed prominent T-type currents with small or no apparent L-type current (n = 783, Fig. 1C and 1D). Fig. 1E illustrates the amplitude of the T- and L-type Ca2+ currents for all recorded cone bipolar cells. Most of the cone bipolar cells clearly fell into two groups: one with a prominent T-type Ca2+ current and the other with a prominent L-type Ca2+ current. For brevity, they will be referred to in this study as T- and L-rich cone bipolar cells, respectively. Conversely, cone bipolar cells that showed both prominent T- and L-type Ca2+ currents were rarely encountered. Most of these recordings were made from cells with a large number of surviving terminal varicosities or cells with their terminals still attached to tissue. This suggests that one of these two Ca2+ currents, T- or L-type, is located primarily in the terminals of cone bipolar cells. In addition, we noticed that if the retinas were treated in enzymatic solution for a longer period or if the recordings were performed after a longer waiting period following cell dissociation, we observed only cone bipolar cells with either T- or L-type Ca2+ current. This finding suggests that the small T- or L-type currents observed in the L- or T-rich cone bipolar cells, respectively, are vulnerable to cell dissociation or culturing.
Profile of T- and L-type Ca2+ currents of isolated cone bipolar cells. Two peak-inward Ca2+ currents (T- and L-types) were evoked in response to stimulation in which the voltage was ramped up to +40 mV from a holding potential of −80 mV. Three groups of cone bipolar cells were observed based on the amplitudes of T- and L-type Ca2+ currents. (A) Cone bipolar cells displaying primarily L-type Ca2+ currents; (B) cone bipolar cells displaying prominent T- and L-type Ca2+ currents; (C and D) cone bipolar cells displaying primarily T-type Ca2+ currents; (E) distribution plot of T- and L-type currents in cone bipolar cells (n = 1800).

In addition, the T- and L-rich cone bipolar cells appeared to have different sizes. Morphologically, the soma size of the L-rich cone bipolar cells appeared to be larger in general than that of the T-rich cone bipolar cells. Consistently, these two cell groups differed in whole-cell capacitance values. The T-rich cone bipolar cells had an average whole-cell capacitance of 2.2 ± 1.9 pF (n = 783). The L-rich group, on the other hand, had an average whole-cell capacitance of 3.1 ± 2.1 pF (n = 990). These two values were significantly different (one-way ANOVA, P < 0.05).
Three subgroups of T-rich cone bipolar cells with distinct T-type Ca2+ currents
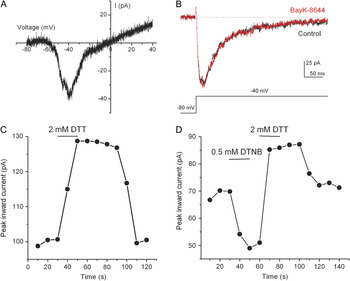
Next, we focused on characterizing the properties of T-type Ca2+ currents in the T-rich cone bipolar cells. The Ca2+ currents were evoked by stepwise test pulses so that both the magnitude and the kinetics of the current could be examined. The T-rich cone bipolar cells contained both T- and L-type Ca2+ currents, although the latter were small; the two types of currents could be isolated from each other using a test pulse to −40 mV from a holding potential of −80 mV as a representative recording shown in Fig. 2A and 2B. First, a prominent T-type Ca2+ current was evident with the ramp stimulation (Fig. 2A). From the same cell, a fast-transient current was elicited by the test pulse to −40 mV from a holding potential of −80 mV (dark trace in Fig. 2B). The current remained the same when BayK-8644, an L-type Ca2+ channel agonist, was applied (Fig. 2B). These results indicate that the test pulse to −40 mV from a holding potential of −80 mV did not significantly activate L-type Ca2+ currents in T-rich cone bipolar cells under our recording conditions.
(Color online) Redox modulation of T-type Ca2+ current in some T-rich cone bipolar cells. (A) A representative recording of T-type Ca2+ currents from T-rich cone bipolar cells evoked by a voltage ramp to +40 mV from a holding potential of −80 mV. (B) Currents evoked by a voltage step pulse to −40 mV from a holding potential of −80 mV did not increase in the presence of 1 μM BayK-8644. (C) Application of DTT increased the peak T-type Ca2+ current, which had a fast onset and a relatively slow offset. (D) Application of DTNB decreased the peak T-type Ca2+ current. The effect of DTNB could be quickly reversed by DTT. The T-type currents were evoked by step pulses to −40 mV from a holding potential of −80 mV.

Three Ca2+ channel α subunits, α1G, α1H, and α1I, are known to underlie the T-type Ca2+ currents (Perez-Reyes, Reference Perez-Reyes2003). Previous studies have reported distinct pharmacological and biophysical properties of T-type Ca2+ currents formed by these Ca2+ channel subunits (Cribbs et al., Reference Cribbs, Lee, Yang, Satin, Zhang, Daud, Barcley, Williamson, Fox, Rees and Perez-Reyes1998; Lee et al., Reference Lee, Gomora, Cribbs and Perez-Reyes1999; McRory et al., Reference McRory, Santi, Hamming, Mezeyova, Sutton, Baillie, Stea and Snutch2001; Todorovic et al., Reference Todorovic, Jevtovic-Todorovic, Meyenburg, Mennerick, Perez-Reyes, Romano, Olney and Zorumski2001). In particular, the current due to the α1H subunit is sensitive to redox modulation (Cribbs et al., Reference Cribbs, Lee, Yang, Satin, Zhang, Daud, Barcley, Williamson, Fox, Rees and Perez-Reyes1998; Todorovic et al., Reference Todorovic, Jevtovic-Todorovic, Meyenburg, Mennerick, Perez-Reyes, Romano, Olney and Zorumski2001). To determine if there is a differential expression of the α1H subunit among bipolar cells, we first examined the effects of redox agents on the T-type current in T-rich cone bipolar cells. We found that application of 2 mM DTT, a reducing agent, enhanced the T-type Ca2+ current in about one third of cone bipolar cells in this group (see below). Modulation by DTT showed a fast onset and a relatively slow offset (Fig. 2C). No current desensitization was observed when the same concentration of DTT was repeatedly applied or when DTT was applied for up to 5 min (n = 4, data not shown). Conversely, application of 0.5 mM DTNB, an oxidizing agent, reduced the T-type Ca2+ currents. The reduction of the current by DTNB could be reversed by subsequent application of DTT (Fig. 2D). Since redox modulation of T-type Ca2+ currents was observed in a portion of T-rich cone bipolar cells, these results suggest that a subgroup of T-rich cone bipolar cells expresses α1H T-type Ca2+ channels.
We further asked whether there is a differential expression of the three T-type Ca2+ channel subunits among cone bipolar cells. Since T-type Ca2+ channels of the three subunits are also known to differ in their Ca2+/Ba2+ permeability and sensitivity to Ni2+ inhibition (Lee et al., Reference Lee, Gomora, Cribbs and Perez-Reyes1999; McRory et al., Reference McRory, Santi, Hamming, Mezeyova, Sutton, Baillie, Stea and Snutch2001), we examined these properties of T-type currents in T-rich cone bipolar cells. Indeed, we found that T-rich cone bipolar cells could be divided into three subgroups based on the extent to which their T-type currents were sensitive to DTT modulation, permeable to Ca2+versus Ba2+, and sensitive to Ni2+ inhibition.
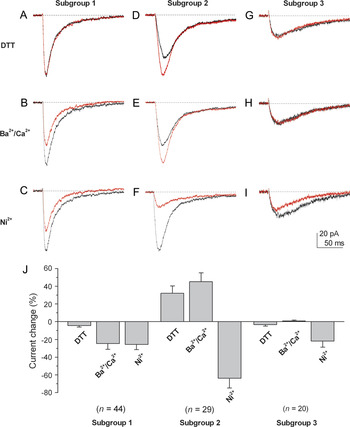
The T-type Ca2+ current in the first subgroup was not significantly modulated by DTT (Fig. 3A). The T-type Ca2+ current after the application of DTT (2 mM) was reduced only by 4.2 ± 1.9% (n = 44) (Fig. 3J). The T-type currents in this same group were less permeable to Ba2+ than to Ca2+ (Fig. 3B). The peak currents were reduced to 75.5 ± 6.7% (n = 44) of the control when extracellular Ca2+ was replaced with Ba2+ (Fig. 3J). Furthermore, the T-type Ca2+ current of this subgroup showed relatively low sensitivity to Ni2+ inhibition (Fig. 3C). Application of 20 μM Ni2+ reduced the current by 25.6 ± 6.0% (n = 44, Fig. 3J).
(Color online) Comparison of the properties of redox modulation, permeability for Ca2+versus Ba2+, and Ni2+ inhibition of T-type Ca2+ currents among three subgroups of T-rich cone bipolar cells. Currents were evoked by a voltage step pulse to −40 mV from a holding potential of −80 mV. Three subgroups of cone bipolar cells were observed based on the extent to which their T-type Ca2+ currents were sensitive to modulation by 2 mM DTT, were permeable to Ca2+versus Ba2+, and were sensitive to 20 μM Ni2+. (A–C) The T-type Ca2+ currents in the first subgroup did not show significant DTT modulation (A), they were less permeable to Ba2+ than to Ca2+ (B), and they showed low sensitivity to Ni2+ inhibition (C). (D–F) The T-type Ca2+ currents in the second subgroup were potentiated by DTT (D). In addition, they were more permeable to Ba2+ than to Ca2+ (E), and they were more sensitive to Ni2+ inhibition (F). (G–I) The T-type currents in the third subgroup did not show significant modulation by DTT, they were equally permeable to Ca2+ and Ba2+, and they had low sensitivity to Ni2+ inhibition. (J) The bar graphs are the sums of the percentage changes to control of T-type currents in DTT modulation, permeability to Ca2+versus Ba2+, and Ni2+ inhibition in three subgroups of cone bipolar cells. The T-type currents in the second subgroup of cone bipolar cells were significantly more sensitive to Ni2+ inhibition than those of the other two subgroups (P < 0.05). Error bars indicate the s.d.

The T-type Ca2+ current of the second subgroup of T-rich cone bipolar cells was sensitive to modulation by 2 mM DTT (Fig. 3D). The current was enhanced by 32.2 ± 8.2% (n = 29) in the presence of 2 mM DTT (Fig. 3J). The current showed higher permeability to Ba2+ than to Ca2+ (Fig. 3E). The current increased to 145.2 ± 11% (n = 29) of the control (Fig. 3J) when Ca2+ was replaced with Ba2+. In addition, the T-type Ca2+ current was highly sensitive to Ni2+ inhibition (Fig. 3F). Application of 20 μM Ni2+ reduced the current by 64 ± 11% (n = 29, Fig. 3J).
The T-type Ca2+ current of the third group was not significantly modulated by 2 mM DTT. The current was reduced by 3.4 ± 1.7% (n = 20, Fig. 3G) in the presence of 2 mM DTT. The current was equally permeable to Ca2+ and Ba2+ (Fig. 3H). The current only reduced to 99 ± 0.9% (n = 20) of the control (Fig. 3J) when Ca2+ was replaced with Ba2+. The current showed relatively low sensitivity to Ni2+ inhibition (Fig. 3I). Application of 20 μM Ni2+ reduced the current by only 22 ± 8.0% (Fig. 3J).
In addition, the T-type Ca2+ current for the third subgroup showed the smallest amplitude among the three subgroups (30 ± 17 pA, n = 20). In contrast, the average values for the first and second subgroups were 76 ± 22 pA (n = 44) and 80 ± 17 pA (n = 29), respectively.
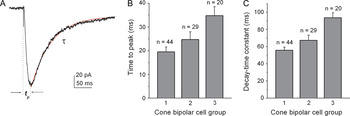
We also measured the activation and inactivation kinetics of the T-type Ca2+ currents in the three subgroups of cone bipolar cells because these properties have also been reported to differ among three T-type Ca2+ channel subunits (McRory et al., Reference McRory, Santi, Hamming, Mezeyova, Sutton, Baillie, Stea and Snutch2001). For this purpose, the time-to-peak value and decay time constant of the T-type Ca2+ currents were measured (Fig. 4A). The T-type Ca2+ current in the first subgroup had the fastest activation and inactivation among the three subgroups. As shown in Fig. 4B and 4C, the average time-to-peak value and decay time constant were 19.5 ± 2.1 and 55.6 ± 3.8 ms (n = 44), respectively. For the T-type Ca2+ current in the second subgroup, the time-to-peak value and decay time constant were 24.7 ± 3.3 and 67.2 ± 6.2 ms (n = 29), respectively. The T-type Ca2+ current of the third subgroup had the slowest activation and inactivation kinetics; the time-to-peak value and decay time constant were 34.8 ± 3.7 and 93.5 ± 5.8 ms (n = 20), respectively.
(Color online) Comparison of the kinetic properties of T-type currents among three subgroups of isolated T-rich cone bipolar cells. (A) Typical recording of T-type currents in T-rich cone bipolar cells and measurement of time-to-peak (t p) values and the inactivation time constant (τ). The currents were evoked by a voltage pulse to −40 mV from a holding potential of −80 mV in the presence of 10 mM Ca2+. (B) Average time-to-peak value and (C) inactivation time constant of T-type Ca2+ currents recorded from the three subgroups of T-rich cone bipolar cells. Error bars indicate the s.d.

Properties of T-type Ca2+ channel subunits in HEK cells
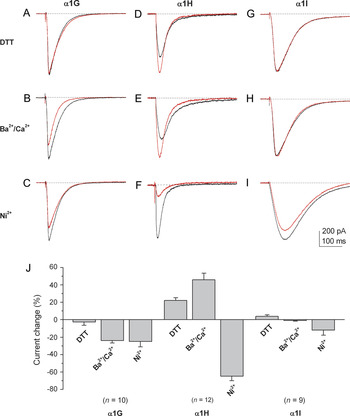
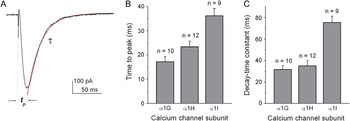
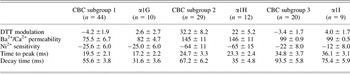
For a quantitative comparison between the properties of the T-type Ca2+ currents of three subgroups of cone bipolar cells and the recombinant T-type Ca2+ currents, we examined the pharmacological and biophysical properties of three cloned T-type subunits, α1G, α1H and α1I, in HEK cells under the same recording conditions. The representative recordings along with the average results for DTT modulation, Ca2+/Ba2+ permeability, and Ni2+ sensitivity are shown in Fig. 5. The average values for the time peak and decay constants are shown in Fig. 6. The comparison of the data between three subgroups of cone bipolar cells and the three recombinant T-type Ca2+ subunits is shown in Table 1.
(Color online) The properties of Ca2+ currents recorded from HEK-293 cells transiently expressing α1G, α1H, or α1I Ca2+ channel subunits. Currents were evoked by a voltage pulse to −40 mV from a holding potential of −80 mV. (A–C) α1G currents did not show significant DTT modulation (A), they were less permeable to Ba2+ than to Ca2+ (B), and they had relatively low sensitivity to 20 μM Ni2+ inhibition. (D–F) α1H currents were potentiated by DTT (D). They were more permeable to Ba2+ than to Ca2+ (E) and more sensitive to 20 μM Ni2+ inhibition (F). (G–I) α1I currents did not show significant DTT modulation (G), they were equally permeable to Ca2+ and Ba2+ (H), and they show low sensitivity to Ni2+ (I). (J) Bar graphs show the percentage change in control of T-type currents of three subunits for DTT modulation, permeability to Ca2+versus Ba2+, and Ni2+ inhibition. The α1H subunit showed significantly higher sensitivity to Ni2+ inhibition than the other two subunits (P < 0.05). Error bars indicate the s.d.

(Color online) Summary of the kinetic properties of T-type Ca2+ currents from HEK-293 cells transiently expressing α1G, α1H, or α1I calcium channel subunits. (A) Typical recording of T-type currents and measurements of time-to-peak (t p) values and the inactivation time constant (τ). Currents were evoked by a voltage pulse to −40 mV from a holding potential of −80 mV. (B) Average time-to-peak values and (C) inactivation time constants of the T-type subunit currents.

The summary and comparison of the T-type Ca2+ current properties between the three subgroups of T-rich cone bipolar cells (CBCs) and the three T-type Ca2+ channel subunits

The data for the DTT modulation are presented as the percentage of increase (+) or decrease (−) compared to control after the application of 2 mM DTT. The data for Ba2+/Ca2+ permeability are presented as the percentage of the Ba2+ current normalized to the Ca2+ current when 10 mM extracellular Ca2+ was replaced by 10 mM Ba2+. The data for the Ni2+ sensitivity are presented as the percentage of the blockade after the application of 20 μM Ni2+. All data are presented as mean ± s.d. from the indicated number of cells.
The results indicate that the overall properties of T-type Ca2+ currents in the three subgroups of cone bipolar cells resemble those of the α1G, α1H, and α1I Ca2+ currents, respectively.
Properties of T-type Ca2+ current in rod bipolar cells
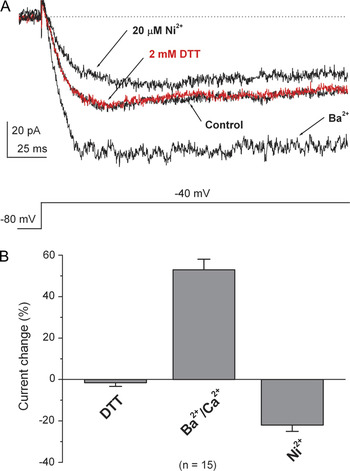
The T-type Ca2+ current in rod bipolar cells has been reported to show properties that are different from those of cone bipolar cells (Pan, Reference Pan2000). We therefore examined the properties of T-type Ca2+ current in rod bipolar cells. We found that application of DTT did not significantly affect the current. The current in the presence of 2 mM DTT was increased by only 1.5 ± 1.8% (n = 15) (Fig. 7A and 7B). Consistent with previous findings (Pan, Reference Pan2000), the current showed higher permeability to Ba2+ than to Ca2+ and relatively low sensitivity to Ni2+ inhibition (Fig. 7A). The peak amplitude of the current increased by 53 ± 5.1% (n = 15) when Ca2+ was replaced with Ba2+. Application of 20 μM Ni2+ reduced the current by only 22 ± 4.3% (n = 15, Fig. 7B). These results indicate that the T-type Ca2+ current in rod bipolar cells does not resemble any of the currents observed in cone bipolar cells.
(Color online) The properties of T-type Ca2+ currents in rod bipolar cells. (A) The T-type Ca2+ currents in rod bipolar cells were not modulated by 2 mM DTT. The currents showed more permeability to Ba2+ than to Ca2+. These T-type currents were only slightly inhibited by 20 μM Ni2+. (B) Bar graphs show the percentage change to control of T-type currents in rod bipolar cells on DTT modulation, permeability to Ca2+versus Ba2+, and Ni2+ inhibition. Error bars indicate the s.d.

Contribution of T-type Ca2+ currents to the voltage response in cone bipolar cells
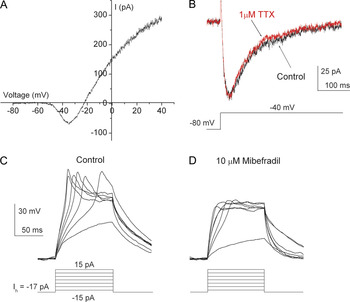
In the central nervous system (CNS), T-type Ca2+ currents have been shown to play an important role in the generation of low-threshold spikes. To examine the possible functional role of T-type Ca2+ currents in T-rich cone bipolar cells, we examined the contribution of T-type Ca2+ currents to the voltage response of bipolar cells. The recordings were made in an extracellular solution containing 2.5 mM Ca2+ and without blocking K+ channels. Under these recording conditions, prominent T-type Ca2+ currents were still observed by voltage ramp stimulation or by step pulse to −40 mV from a holding potential of −80 mV (Fig. 8A and 8B). The current was not affected by 1 μM TTX, indicating the absence of voltage-gated Na+ current. In current-clamp recordings, stepwise current injections elicited regenerative membrane potentials in these cells. Fig. 8C shows a representative recording from a T-rich cone bipolar cell. The regenerative potentials showed a spike-like component on the top of the regenerative plateau potentials in an all-or-nothing manner. The spike-like regenerative potentials persisted in the presence of 1 μM TTX (data not shown), confirming that voltage-gated Na+ channels were not involved. Conversely, application of 10 μM mibefradil, a T-type Ca2+ channel antagonist, blocked the spike-like component but not the regenerative plateau potentials (Fig. 8D). Similar results were observed in other T-rich cone bipolar cells (n = 25).
(Color online) Low-threshold spikes mediated by T-type Ca2+ currents. Recordings were made in an extracellular solution containing 2.5 mM Ca2+ without blockade of , but they did potassium channels. (A) The large voltage-gated K+ currents did not mask the T-type currentsmask L-type currents in response to ramp stimulation voltage ranging from −80 to 40 mV (H hold = −80 mV). (B) The step pulse to −40 mV evoked typical T-type currents (V hold = −80 mV). The current was not affected by the application of 1 μM TTX. (C) The regenerative potentials were evoked in the current-clamp mode. (D) The regenerative potentials were blocked by 10 μM mibefradil.

Discussion
Two broad groups of isolated cone bipolar cells
The results of this study have shown that based on the expression pattern of T- and L-type Ca2+ currents, two broad groups of retinal cone bipolar cells exist in rats. We also recorded 210 isolated cone bipolar cells from mouse retinas. Similarly, two groups of cone bipolar cells were observed based on the expression of T- and L-type Ca2+ currents (data not shown). One broad group of cone bipolar cells, referred to as T-rich cone bipolar cells, shows prominent T-type Ca2+ currents, whereas the second group, referred to as L-rich cone bipolar cells, shows prominent L-type currents. It should be emphasized that most of the distal dendrites and terminal varicosities of cone bipolar cells in our preparation were lost during the cell dissociation (Pan, Reference Pan2000). Therefore, the Ca2+ currents observed under our conditions should primarily originate in the soma. In addition, we did not notice a correlation between the T- or L-rich cone bipolar cells and the extent of surviving dendrites and axon terminals. Therefore, the observation of T- and L-rich cone bipolar cells should not be due to variation in the intactness of axon terminals and/or dendrites. Rather, our results suggest that there are two groups of cone bipolar cells, with each predominantly expressing either T- or L-type Ca2+ channels in their somata.
It should also be noted that the T- and L-rich cone bipolar cells usually displayed small L- and T-type Ca2+ currents, respectively. Interestingly, these small T- or L-type currents were vulnerable to cell dissociation or culturing. Since the distal dendrites and/or axon terminals might more easily deteriorate during long enzyme exposure or cell culture, these small T- and L-type currents might be located in the distal dendrites and/or axon terminals. This interpretation is consistent with the observation that the group of cone bipolar cells that displayed both large T- and L-type Ca2+ currents usually had relatively intact axon terminals. Our results suggest that in L-rich cone bipolar cells, the T-type Ca2+ channels are located primarily in distal dendrites and/or axon terminals, whereas in T-rich cone bipolar cells, the L-type Ca2+ channels are located primarily in distal dendrites and/or axon terminals. Taken together, our results suggest a differential distribution of T- and L-type Ca2+ channels in the two broad groups of cone bipolar cells.
For rod bipolar cells in the rat and mouse, previous studies have shown that the L-type Ca2+ channels localize to the axon terminals (Hartveit, Reference Hartveit1997; de la Villa, et al., Reference de la Villa, Vaquero and Kaneko1998; Pan, Reference Pan2000), whereas the T-type Ca2+ channels are located both in the soma and at the axon terminals (Pan et al., Reference Pan, Hu, Perring and Andrade2001). Since isolated rod bipolar cells display prominent T-type Ca2+ currents (Pan, Reference Pan2000), rod bipolar cells therefore belong to the T-rich group.
In addition, we found that the T- and L-rich cone bipolar cells appeared to have different somatic sizes based on their morphological appearance and their whole-cell capacitance. The T-rich cone bipolar cells were generally smaller in size than the L-rich cone bipolar cells. At least nine types of cone bipolar cells have been classified in the mammalian retina based on their terminal stratification in the interplexiform layer (Euler & Wässle, Reference Euler and Wässle1995; Hartveit, Reference Hartveit1997). Cone bipolar cells are further divided into ON- and OFF-types on the basis of their polarity in response to light (Werblin & Dowling, Reference Werblin and Dowling1969). Furthermore, the sustained and transient responses in the retina have been reported to originate, in part, in bipolar cells (Awatramani & Slaughter, Reference Awatramani and Slaughter2000). It would be interesting for future studies to determine whether these two groups of bipolar cells correspond to different functional types of cone bipolar cells.
Three subgroups of T-rich cone bipolar cells with distinct T-type Ca2+ currents
We have also shown that T-rich cone bipolar cells can be divided into three subgroups based on pharmacological and biophysical properties of their T-type currents: redox modulation, permeability of Ca2+versus Ba2+, and sensitivity to Ni2+ inhibition. Notably, these properties of the T-type currents in these three subgroups of cone bipolar cells were found to closely resemble those of the recombinant T-type Ca2+ channel subunits, α1G, α1H, and α1I, respectively, as previously reported in HEK cells (Lee et al., Reference Lee, Gomora, Cribbs and Perez-Reyes1999; McRory et al., Reference McRory, Santi, Hamming, Mezeyova, Sutton, Baillie, Stea and Snutch2001; Todorovic et al., Reference Todorovic, Jevtovic-Todorovic, Meyenburg, Mennerick, Perez-Reyes, Romano, Olney and Zorumski2001) and confirmed in this study. Furthermore, the activation kinetics of the T-type Ca2+ currents observed among these three subgroups also largely resembled those of the three recombinant Ca2+ channel subunits (McRory et al., Reference McRory, Santi, Hamming, Mezeyova, Sutton, Baillie, Stea and Snutch2001). However, the decay time constants of the T-type Ca2+ currents in the three subgroups of cone bipolar cells were found to be substantially longer than those of their corresponding recombinant Ca2+ channel currents. This discrepancy might arise from the presence of accessory subunits (Hobom et al., Reference Hobom, Dai, Marais, Lacinova, Hofmann and Klugbauer2000), alternative splicing (Murbartian et al., Reference Murbartian, Arias, Lee, Gomora and Perez-Reyes2002), or possible posttranslational modifications of the T-type Ca2+ channels in bipolar cells (Chemin et al., Reference Chemin, Traboulsie and Lory2006). Nevertheless, our results suggest that each subgroup of T-rich cone bipolar cells predominantly expresses a single subunit of the T-type Ca2+ channel in the soma. Interestingly, there is a similar finding in pain pathways, where one type of small-size spinal dorsal root ganglion cells (T-rich) expresses primarily the α1H subunit (Talley et al., Reference Talley, Cribbs, Lee, Daud, Perez-Reyes and Bayliss1999; Jevtovic-Todorovic & Todorovic, Reference Jevtovic-Todorovic and Todorovic2006).
As mentioned above, rod bipolar cells belong to the T-rich cell group. Interestingly, the properties of T-type Ca2+ currents in rod bipolar cells did not fully match those of any of the recombinant T-type Ca2+ channel subunits. Comparing the properties of Ca2+ currents in rod bipolar cells with those of the three recombinant T-type Ca2+ channel subunits, however, suggests that the properties of the Ca2+ currents in rod bipolar cells more closely resemble those of the recombinant α1I subunit than other subunits. In particular, activation and inactivation of the T-type Ca2+ current in rod bipolar cells are extremely slow (Pan, Reference Pan2000), a marked property of the α1I Ca2+ current (Monteil et al., Reference Monteil, Chemin, Leuranguer, Altier, Mennessier, Bourinet, Lory and Nargeot2000; McRory et al., Reference McRory, Santi, Hamming, Mezeyova, Sutton, Baillie, Stea and Snutch2001). The only major discrepancy between the Ca2+ current of rod bipolar cells and α1I Ca2+ current is the Ba2+/Ca2+ permeability: the current in rod bipolar cells is more permeable to Ba2+ than to Ca2+, while the α1I Ca2+ channel is equally permeable to Ca2+ and Ba2+. To date, only three T-type Ca2+ channel genes have been cloned, but multiple splicing variants of these subunits have been reported (Perez-Reyes, Reference Perez-Reyes2003). A recent study identified certain charged amino acid residues in T-type Ca2+ channels that could influence the divalent cation selectivity (Cens et al., Reference Cens, Rousset, Kajava and Charnet2007). Therefore, the atypical properties of the T-type Ca2+ current in rod bipolar cells may arise from a splicing variant or mutant of the α1I Ca2+ channel. It is also possible that the properties of the T-type Ca2+ channel in rod bipolar cells are altered by the presence of accessory subunits or posttranslational modifications.
Implications of T-type calcium channel functions in bipolar cells
One of the important functions of T-type Ca2+ channels in the CNS is to support the generation of low-threshold Ca2+ spikes (LTSs). LTSs are usually generated in the dendrites and propagated through the whole-cell membrane, thus activating high-threshold spikes that are mediated by L-type Ca2+ channels (Huguenard, Reference Huguenard1998; Jevtovic-Todorovic & Todorovic, Reference Jevtovic-Todorovic and Todorovic2006; Bobkov & Ache, Reference Bobkov and Ache2007). T-type Ca2+ currents were previously shown to be essential for the initiation of the spontaneous activity in bipolar cells in vitro (Ma & Pan, Reference Ma and Pan2003). As shown in this study, regenerative spike-like potentials mediated by the T-type Ca2+ current could occur in T-rich cone bipolar cells. Interestingly, after the blockade of T-type Ca2+ current, regenerative plateau potentials were still present (Fig. 8D). Regenerative action potentials mediated by L-type Ca2+ channels have been reported in bipolar cells of goldfish (Protti et al., Reference Protti, Flores-Herr and von Gersdorff2000). Therefore, it is possible that the interplay of T- and L-type Ca2+ channels may also shape the waveform of mammalian bipolar cells.
Furthermore, this study shows the existence of three subgroups of T-rich cone bipolar cells. Each subgroup predominantly expresses a single type of T-type Ca2+ channel subunit in their somata, while rod bipolar cells express an atypical T-type Ca2+ channel. Therefore, bipolar cells of different types could express T-type Ca2+ channels with different activation and inactivation kinetics. In addition, the function of these different T-type Ca2+ channels could be subjected to the regulation by endogenous substances (Chemin et al., Reference Chemin, Traboulsie and Lory2006; Hildebrand et al., Reference Hildebrand, David, Hamid, Mulatz, Garcia, Zamponi and Snutch2007; Nelson et al., Reference Nelson, Joksovic, Su, Kang, Deusen, Baumgart, David, Snutch, Barrett, Lee, Zorumski, Perez-Reyes and Todorovic2007). Furthermore, previous studies showed that the activation of T-type Ca2+ channels at the axon terminal of bipolar cells could trigger transmitter release (Pan et al., Reference Pan, Hu, Perring and Andrade2001; Singer & Diamond, Reference Singer and Diamond2003). Together, the differential expression of multiple T-type Ca2+ channels may contribute to the diverse signal processing of bipolar cells.
The functional significance of T-type Ca2+ channels in bipolar cells would be dependent on the membrane potential range of the bipolar cells. The true membrane potential range of bipolar cells in vivo remains unclear. The dark membrane potentials of mammalian bipolar cells were reported to be in the range of −60 to −25 mV (Kaneko et al., Reference Kaneko, Pinto and Tachibana1989; Karschin & Wässle, Reference Karschin and Wässle1990; Gillette & Dacheux, Reference Gillette and Dacheux1995; Berntson & Taylor, Reference Berntson and Taylor2000; Euler & Masland, Reference Euler and Masland2000). A wider range has been reported in lower vertebrates (Tessier-Lavigne et al., Reference Tessier-Lavigne, Attwell, Mobbs and Wilson1988; Connaughton & Maguire, Reference Connaughton and Maguire1998). The operating range of the membrane potential of a bipolar cell would be dependent on light conditions and the functional type of the bipolar cell, ON versus OFF. In addition, the operating range could be subjected to modulation by neurotransmitters (Lukasiewicz & Werblin, Reference Lukasiewicz and Werblin1994; Pan & Lipton, Reference Pan and Lipton1995; Euler & Wässle, Reference Euler and Wässle1998; Cui et al., Reference Cui, Ma, Lipton and Pan2003) or neuromodulators (Yu et al., Reference Yu, Satoh, Wu and Marshak2008) or influenced by the membrane potential of other neurons through gap junctions (Xin & Bloomfield, Reference Xin and Bloomfield1999; Trexler et al., Reference Trexler, Li, Mills and Massey2001). It is possible that under certain conditions, the membrane potential of certain bipolar cells may operate over a range in which a significant portion of T-type Ca2+ channels is activated (Pan, Reference Pan2000). It is worth pointing out here that certain types of retinal cone bipolar cells express voltage-dependent Na+ channels, which also require a relatively negative membrane potential for function. Na+ channels in retinal bipolar cells have been shown to play a functional role in retinal information processing (Ichinose et al., Reference Ichinose, Shields and Lukasiewicz2005; Ichinose & Lukasiewicz, Reference Ichinose and Lukasiewicz2007; Mojumder et al., Reference Mojumder, Sherry and Frishman2008). Thus, it will be of interest for future studies to investigate the functional role of the differential expression of multiple T-type Ca2+ channels in retinal bipolar cells.
Acknowledgments
We thank Dr. E. Perez-Reyes for providing us the recombinant α1G, α1H, and α1I Ca2+ channel subunits. This research was supported by NIH grant EY12180 (Z.-H.P.) and core grant EY04068 to the Department of Anatomy and Cell Biology at Wayne State University.