Introduction
Depressive disorders are common in old age. Prevalence of major depressive disorders in the community of adults aged 65 years and older is reported to be between 1% and 5% (Fiske et al., Reference Fiske, Wetherell and Gatz2009), while depressive symptoms are present in almost 20% of community-dwelling older adults (Riedel-Heller et al., Reference Riedel-Heller, Busse and Angermeyer2006; Luppa et al., Reference Luppa2010). Since depressive symptoms in the elderly have potential clinical relevance and are associated with a number of risk factors (Djernes, Reference Djernes2006; Fiske et al., Reference Fiske, Wetherell and Gatz2009), research has increasingly focused on depressive symptoms in the elderly that do not fulfill the criteria for a diagnosis of major depression (for an overview see Blazer, Reference Blazer2003; Fiske et al., Reference Fiske, Wetherell and Gatz2009). Depressive symptoms are reported to be clearly associated with female gender, somatic illness, cognitive and functional impairment, lack of social support, and a history of depression (Djernes, Reference Djernes2006; Fiske et al., Reference Fiske, Wetherell and Gatz2009). Results for other potential risk factors such as age, educational level, and financial circumstances have proved inconsistent (Blazer, Reference Blazer2003; Djernes, Reference Djernes2006). In particular, the impact of age on the prevalence of depressive symptoms in the elderly has been widely discussed. It is supposed that the prevalence of depressive symptoms may run a different course for men and women across the old age range (Luppa et al., Reference Luppa2010); however, very few community-based studies have reported age- and gender-specific prevalence of depressive symptoms in the elderly (Sonnenberg et al., Reference Sonnenberg, Beekman, Deeg and Tilburg2000; Stordal et al., Reference Stordal, Bjartveit, Dahl, Kruger, Mykletun and Dahl2001; Angst et al., Reference Angst, Gamma, Gastpar, Lepine, Mendlewicz and Tylee2002; Luppa et al., Reference Luppa2010), and in recent reviews this issue was not addressed (Cole and Dendukuri, Reference Cole and Dendukuri2003; Djernes, Reference Djernes2006). However, with regard to demographic change, detailed information on the prevalence of and risk factors for depressive disorders in old age is of considerable interest for the assessment of future needs of the health care system for prevention and treatment. The aim of the study is to determine age- and gender-specific prevalence of major depression, minor depression, and depressive symptoms of a representative sample of the German population aged 60 to 85 years and to analyze the risk factors associated with depressive symptoms for the total sample, and for men and women separately.
Methods
Subjects
A representative sample of the German general population was selected with the assistance of a demographic consulting company (USUMA, Berlin, Germany). Germany was divided into 258 sample areas representing the different regions of the country. Households in each respective area and the members of this household fulfilling the inclusion criteria (age ≥14 years, able to read and understand the German language, able to complete a self-report questionnaire) were selected randomly. All participants were informed about the study and gave their informed consent. The sample was aimed to be representative in terms of age, gender, and education. A first attempt was made using 8,368 addresses, of which 8,116 were valid. If not at home, a maximum of three attempts were made to contact the selected person. All subjects were visited by a study assistant, informed about the investigation, and self-rating questionnaires were presented. The assistant waited until participants answered all questionnaires and offered help if the meaning of questions was not clear. In all, 1,982 subjects (24.4%) refused participation, 1,029 subjects (12.7%) were not reached after four attempts, and 67 subjects (0.8%) refused participation because of severe health problems, and 5 interviews (0.06%) could not be used because of incompleteness. A total of 5,033 people agreed to participate, completing the self-rating questionnaires in May and June 2008 (participation rate: 62.1%). Only those participants aged 60 to 85 years are included in this study.
Instruments
Diagnostics of depression
To assess depression, the German version of the Depression Module of the Patient Health Questionnaire (PHQ-9) (Kroenke et al., Reference Kroenke, Spitzer and Williams2001) was used because it offers the opportunity to calculate a dimensional depression score (depressive symptoms) as well as categorical syndromes (major depression and minor depression). Addressing the dimensional approach, a continuous depression score was calculated, using the sum of the answers to the nine items, ranging from 0 to 27. Scores are usually interpreted as follows: 0–4 = no relevant depressive symptoms, 5–9 = mild depressive symptoms, 10–14 = moderate depression, 15–19 = severe depression. In our dimensional analysis a score of 5 and above was interpreted as presence of “depressive symptoms”. Moreover, the categorical interpretation allows determining “major depressive syndrome” (MD) and “minor depressive syndrome” (MiD). The PHQ-9 shows good validity and reliability for psychiatric case definition in primary care. Compared with structured clinical interviews, 98% sensitivity and 80% specificity was shown across all age groups (Lowe et al., Reference Lowe, Kroenke, Herzog and Grafe2004; Kroenke et al., Reference Kroenke, Spitzer, Williams and Lowe2010) and in the elderly (Phelan et al., Reference Phelan2010).
Physical morbidity
The number and severity of chronic diseases was assessed using an instrument developed by Bayliss and colleagues (Reference Bayliss, Ellis and Steiner2005; Reference Bayliss, Ellis and Steiner2007; Reference Bayliss, Ellis and Steiner2009). This is a self-report questionnaire based on a list of 24 common chronic diseases. The number of chronic medical conditions was calculated. A validation against medical records revealed that median sensitivity relative to a “gold standard” of chart review was 75% (range 35–100%), and median specificity was 92% (range 61–100%) (Bayliss et al., Reference Bayliss, Ellis and Steiner2005).
Social support
Social support was assessed with the three-item Oslo Social Support Scale (Dowrick et al., Reference Dowrick1998; Dalgard et al., Reference Dalgard2006; Fiske et al., Reference Fiske, Wetherell and Gatz2009). It includes three questions about the respondent's perception of the social support from their family, friends and neighbors. It has been used in several studies, confirming feasibility and predictive validity with respect to psychological distress. The total score of the three items was used in our study.
In addition to the above instruments, a comprehensive assessment of sociodemographic characteristics was performed.
Statistical analysis
Statistical analyses were conducted with the PASW for Windows, version 18.0. To determine risk factors associated with depressive symptoms, linear regression analyses were performed, including the total score of the PHQ-9 as the dependent variable and age, gender, education (five groups, see Table 1), household income (three groups: <€1250, €1250–2500, >€2500), social support (total score of the Oslo Social Support Scale, number of medical conditions according to Bayliss et al., Reference Bayliss, Ellis and Steiner2005) and living with a partner (yes/no) as independent variables. The selection of risk factors was hypothesis driven. It was based on findings and reported shortcomings of studies in current reviews on risk factors for depression in the elderly (Djernes, Reference Djernes2006; Fiske, Reference Fiske, Wetherell and Gatz2009). Model 1 comprises the whole sample; Models 2 and 3 comprise women only and men only, respectively.
Sociodemographic characteristics of the study sample
Results
Sample characteristics
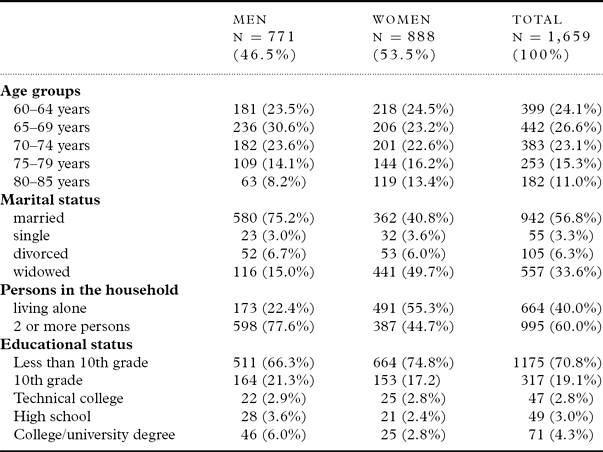
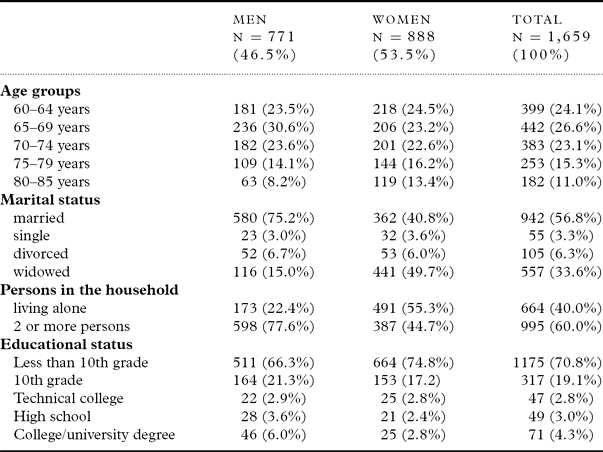
Table 1 gives an overview of the demographic characteristics of the subsample of the elderly (N = 1,659). Both genders differ significantly with respect to the sociodemographic characteristics. Women are over-represented in the higher age groups (χ2 = 20.33, p < 0.001), are more likely to live alone (χ2 = 185.57, p < 0.001) or to be widowed (χ2 = 234.48, p < 0.001), and they are more likely to have a lower educational status (χ2 = 19.55, p < 0.01). The mean number of medical conditions increased with age from 3.4 for the 60–64 years age-group, to 3.6 for the 65–69 years age-group, 4.5 for the 70–74 years age-group, 4.8 for the 75–79 years age-group, and 5.4 conditions for the oldest age-group.
Prevalence rates of depressive syndromes and symptoms in the elderly by gender
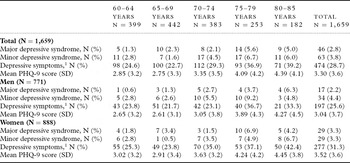
Table 2 presents the prevalence for depressive syndromes (categorical approach) and depressive symptoms (dimensional approach) by age and gender for the entire sample. Some 6.6% of both men and women are affected by minor or major depressive syndromes, but in men minor depressive syndromes are twice as common as major depressive disorders. In women both syndromes show comparable prevalence of 3.3%. There were no gender differences in the prevalence of MD (χ2 = 1.73, p = 0.188) and MiD (χ2 = 1.48, p = 0.224) in the entire sample. The prevalence rates of the minor and major depressive syndromes increased with age. Since the number of cases is very small, no statistical tests were performed for both syndromes across the age groups. In men the prevalence of major depressive syndrome increases with age, and in women the highest prevalence is found for both highest age groups, but there was no linear increase across the age groups in women. For minor depressive syndrome, unsteady courses in the prevalence for both men and women were found.
Prevalence of depressive syndromes and symptoms by age and gender (N = 1,659)

1 Defined by a score on the PHQ-9 of 5 points or more.
PHQ = Patient Health Questionnaire.
Age- and gender-differences with respect to depressive symptoms were tested using analyses of variance. Women show a significantly higher degree of depressive symptoms compared with men (F(1; 1653) = 7.199, p < 0.01). Moreover, there are significant age differences in women (F(4; 879) = 6.175; p < 0.001) and men (F(4,765) = 4.621, p < 0.01). Depressive symptoms increased across the age groups. According to the post-hoc tests for both genders, age groups 1 (60–64 years) to 3 (70–74 years) differ significantly from age groups 4 (75–79 years) and 5 (80–85 years).
Risk factors associated with depressive symptoms in elderly men and women
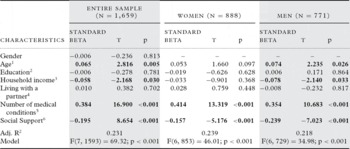
Table 3 shows the results of the linear regression analyses for the total sample as well as for women and men separately. In the total sample as well as in the male subsample, depressive symptoms are significantly associated with increasing age, lower household income, an increasing number of medical conditions and lower social support. The separate analysis for the female subsample revealed that only an increasing number of medical conditions and lower social support were significantly related to depressive symptoms.
Multiple linear regression models of factors associated with depressive symptoms in the elderly

1 In five groups according to Table 1;2 In five groups according to Table 1;3 In three groups (<€1250, €1250–2500, >€2500); 4 Yes/no; 5 According to Bayliss et al. (Reference Bayliss, Ellis and Steiner2005); 6 Total score of the Oslo Social Support Scale.
Discussion
The aim of the study was to determine age- and gender-specific prevalence of MD, MiD and depressive symptoms of a representative sample of the German population aged 60–85 years old, juxtaposing the categorical approach (major and minor depression) and the dimensional approach (depressive symptoms) as well as to analyze risk factors associated with depressive symptoms for the total sample and for men and women separately.
We found a total prevalence of 2.8% for major depression. Beekman et al. (Reference Beekman, Copeland and Prince1999) and Djernes (Reference Djernes2006) reported prevalence rates in their reviews between 1.8% and 3.7%, and 1.0% and 4.1% (according to DSM criteria, excluding outliers) respectively. The prevalence of 3.8% for MiD in our study is in line with the findings of Djernes (Reference Djernes2006), showing prevalence rates of 3.1% and 3.6% for MiD (according to DSM criteria, excluding outliers). For depressive symptoms (dimensional approach), we found a prevalence of 28.7%, which was substantially higher than the pooled prevalence of 13.5% of Beekman et al. (Reference Beekman, Copeland and Prince1999), but within the range of the prevalence of depressive symptoms of Djernes (Reference Djernes2006), between 7.2% and 49.0%. So far, only a few studies determining the prevalence of depressive symptoms have been conducted in Germany. One German primary care study reported a comparatively low prevalence of 9.7% for depressive symptoms, diagnosed with the Geriatric Depression Scale-15 using a cut-off score of 6 (Weyerer et al., Reference Weyerer2008); and a German population-based study reported a prevalence of depressive symptoms of 14.3%, diagnosed with the Center for Epidemiologic Studies Depression Scale (German cut-off of 23) (Luppa et al., Reference Luppa2010). In our study, depressive symptoms were assessed with the PHQ-9 using a cut-off of 5. This broad definition of presence of depressive symptoms was used in order to include individuals with mild depressive symptoms, since such symptoms are already found to be associated with a number of negative effects in elderly individuals (Fiske et al., Reference Fiske, Wetherell and Gatz2009). If a stricter cut-off of 8 was applied, as recommended by Phelan et al. (Reference Phelan2010) and comparable to the GDS cut-off of 6, we found a prevalence of 12.2%.
As suggested in the literature (Luppa et al., Reference Luppa2010), we found different trends of prevalence of MD, MiD, and depressive symptoms for men and women across age-groups. Until now, only a few studies have reported age- and gender-specific prevalence (for an overview, see Luppa et al., Reference Luppa2010), but most often this was only for depressive symptoms (Sonnenberg et al., Reference Sonnenberg, Beekman, Deeg and Tilburg2000; Minicuci et al., Reference Minicuci, Maggi, Pavan, Enzi and Crepaldi2002; Murata et al., Reference Murata, Kondo, Hirai, Ichida and Ojima2008; Veer-Tazelaar et al., Reference Veer-Tazelaar2008; Luppa et al., Reference Luppa2010). In terms of men, some studies show the highest prevalence of depressive symptoms in the 75–79 age group (Minicuci et al., Reference Minicuci, Maggi, Pavan, Enzi and Crepaldi2002; Sonnenberg et al., Reference Sonnenberg, Beekman, Deeg and Tilburg2000), as the current study has indicated, while others show a steady increase in prevalence with rising age (Murata et al., Reference Murata, Kondo, Hirai, Ichida and Ojima2008; Veer-Tazelaar et al., Reference Veer-Tazelaar2008). For female gender, all the studies (including ours) show a continuous increase of depressive symptoms with rising age (Sonnenberg et al., Reference Sonnenberg, Beekman, Deeg and Tilburg2000; Minicuci et al., Reference Minicuci, Maggi, Pavan, Enzi and Crepaldi2002; Murata et al., Reference Murata, Kondo, Hirai, Ichida and Ojima2008; Veer-Tazelaar et al., Reference Veer-Tazelaar2008; Luppa et al., Reference Luppa2010).
Controlling for other competing risk factors showed age to be an independent risk factor for depressive symptoms for men, but not for women. Consistent with the findings of Sonnenberg et al. (Reference Sonnenberg, Beekman, Deeg and Tilburg2000) a further notable finding in our study was that household income has a significant impact on depressive symptoms only for males. The data suggest that men are more prone to depressive symptoms related to socioeconomic circumstances. In the literature, these findings have not been confirmed (Lorant et al., Reference Lorant, Deliege, Eaton, Robert, Philippot and Ansseau2003; van de Velde et al., Reference van de Velde, Bracke and Levecque2010). It has been shown either that financial strains are associated with depressive symptoms in both sexes (van de Velde et al., Reference van de Velde, Bracke and Levecque2010), or that women with low incomes are at higher risk of depression (van Grootheest et al., Reference van Grootheest, Beekman, Broese van Groenou and Deeg1999). Psychosocial factors and poor physical function were reported as contributors in the relationship between socioeconomic status (SES) and depression (Koster et al., Reference Koster2006; Lorant et al., Reference Lorant, Deliege, Eaton, Robert, Philippot and Ansseau2003). The stress theory postulates that higher SES individuals are better endowed with personal resources such as coping style, self-esteem, and locus of control (Wheaton, Reference Wheaton1980).
A number of limitations to this study need to be considered. First, the cross-sectional design of the study impeded the assessment of the cause-and-effect relationship between depressive symptoms and associated conditions. Furthermore, the low number of cases of MD and MiD limited the accuracy of the prevalence of the clinical diagnoses, and did not enable the analysis of risk factors of major and minor depression. Since the study was exclusively conducted in private households, institutionalized elderly individuals were not included in the study. Moreover, only those elderly people who are able to complete the self-report questionnaire could be included. Thus, strongly cognitively impaired individuals are excluded. Since depressive symptoms occur more frequently among those in residential care and in elderly individuals with cognitive impairment, prevalence rates are probably underestimated. The study has some particular strengths, such as the simultaneous assessment of clinical diagnoses and depressive symptoms (categorical and dimensional measure), and the representativeness of the sample that allows our results to be generalized to the older community-living population in Germany between the ages of 60 and 85 years.
Conclusion
Depressive symptoms are common in old age and occur on a spectrum ranging from very mild “subthreshold” forms to major depression, differing only quantitatively regarding severity of symptoms. For a number of risk factors, clear associations with depressive symptoms have been found, while for others, inconsistent findings are shown, which indicates that further large-scale high quality studies are required. The potential to modify a number of risk factors for depression offers the possibility of secondary prevention, such as treatment of chronic diseases as well as instrumental and emotional support to cope adequately with requirements of daily living.
For adequate management of depressive symptoms in late life, the use of a comprehensive geriatric assessment focusing on health-related quality of life – which includes medical and psychiatric history, functional status, severity of depressive symptoms and cognitive impairment, social function, and general health perceptions – would facilitate the development and implementation of a comprehensive treatment plan and support the monitoring of response to the treatment plan (Blazer, Reference Blazer2000).
Conflict of interest
None.
Description of authors’ roles
H. Glaesmer, L. Spangenberg and M. Luppa formulated the research questions, analyzed the data and wrote the paper. H. Glaesmer was responsible for the statistical design and carried out the statistical analyses. H. Glaesmer, L. Spangenberg, M. Luppa, E. Brähler and S.G. Riedel-Heller designed the study and carried it out.
Acknowledgment
The study was supported by a research grant to Heide Glaesmer from the University of Leipzig.