


Introduction
Reconstructing the behaviour of Pleistocene ice sheets requires accurate values for factors influencing the basal boundary condition, such as mechanisms of subglacial melt-water drainage and the behaviour of over-ridden unconsolidated sediment. Since no direct data on these parameters are available, one must rely on inferences from signatures left in subglacial sediments and ultimately use them for validation of large-scale palaeo-glaciological models of ice-sheet dynamics.
The objective of this paper is to demonstrate unexpectedly high palaeo-pore-water pressures within fine-grained sediments over-ridden by the last (Weichselian) ice sheet in northwestern Germany, as indicated by laboratory tests on undisturbed till and clay samples. Among possible causes for apparently sustained high water pressures, low hydraulic conductivities of the substratum will be considered. An attempt to reconcile high pore-water pressures with apparent lack of field evidence for pervasive ice–bed deformation is made. This leads to the conclusion there was a thin sub-glacial water film, which locally separated subglacial sediments from the shear stresses imposed on them by the glacier movement.
Sediment Consolidation
A vertical downward stress, σ2, applied to sediment causes consolidation of the grain skeleton. Sediment consists of largely incompressible minerals and pore space, filled with air or water (Fig. 1a). When sediment is over-ridden by a glacier, normal stress increases and initiates consolidation. At first, there is consolidation due to expulsion of air, followed by consolidation caused by squeezing of water out of the pores. The latter accounts for most consolidation and depends on the hydraulic and geometric properties of the material and on pore-water recharge. If the pore-water can drain freely from the sediment, consolidation is rapid and significant with rapid pore-pressure dissipation (Fig. 1b). On the other hand, if drainage is impeded, loading is accompanied by an increase in pore pressure and consolidation will be very small (Fig. 1c), because normal stress is supported to a large extent by water in the pores.
Geostatic compaction of a clastic sediment (a) with pore-water drainage (b) and with limited pore-water drainage and pore-water recharge (c) (modified after Reference Boulton, and Dobbie,Boulton and Dobbie, 1993). pw is pore-water pressure, σ′z is effective stress. (c) illustrates a subglacial system with low hydraulic permeability under a warm-based glacier. Note only slight changes in pw and σ′z after loading in (c).

Therefore, sediment compaction is governed by effective stress σ′z defined as
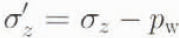
where P w is pore-water pressure.
From the stress history of sediments over-ridden by glaciers, conclusions regarding the subglacialhydraulic regime can be drawn. In overconsolidated sediments the past pre-consolidation stress σ′z caused by ice loading is greater than the recent overburden stress σ′o, indicating favourable conditions for pore-water dissipation under the ice sheet. The relation of these two stresses defines the over consolidation ratio (OCR):

where σ′o is derived from the bulk density of the overlying sediments and their thickness.
Typical consolidation curve from an oedometer test. Point B corresponds to the pre-consolidation stress σ′z.

The pre-consolidation stress is determined in a conventional oedometer consolidation test (Reference Terzaghi,Terzaghi, 1923), in which an undisturbed sample is subjected to a uniaxial normal stress that is stepwise increased. Void ratios εz reached at the end of each stress increment are plotted against the corresponding normal siress σ′z (Fig. 2). After reaching a yield point B, the curve dips steeply, indicating the transition betw een largely elastic and largely permanent deformation. Point B corresponds to the pre-consolidalion stress σ′p, the highest effective stress that has ever been applied to the sediment. The position of point B can be determined graphically using, for example, the method of Reference Casagrande,Casagrande (1936).
For soft sediments over-ridden by a glacier, σ′p depends on the ice-overburden pressure and the palaeo-pore-water pressure. In this study, other factors potentially influencing σ′p such as diagenetic consolidation, weathering, ion exchange, fluctuations of pH and temperature, changes of sediment structure caused by secondary consolidation and decrease of pore-water pressure caused by lowering of the ground-water table arr not taken into account as they are probably of secondary significance given the geographic setting of the Samples and their relatively young age (Weichselian glaciation). Furthermore, the net effect of these factors would probably be to increase the consolidation, which would not affect our conclusions qualitatively.
Study area (hatched) and the sample localities (AK1–AK15). Arrow indicates the main ice-movement direction of the Weichselian glaciation. Weichselian ice limit is shown

Sediment Sampling and Compression Tests
Weichselian sediments grouped in three regions of northwestern Germany were sampled at different distances from the maximum ice limit (Fig. 3; Table 1). Samples AK1-AK10 come from the lower sedimentary complex of the Baltic Sea cliff north of Kiel (Reference Piotrowski,, Warren, and Croot,Piotrowski, 1994c). Five samples were taken from sub-aquatic flow tills deposited in a water-filled basin, which developed in front of the Weichselian ice sheet advancing out of the Baltic Sea depression on to the older highlands (Reference Piotrowski,, Warren, and Croot,Piotrowski, 1994c). An additional sample originates from brecciated glaciolacustrine clay deposited in the same environment. These sediments were subsequently over-ridden by the glacier, which reached its maximum about 40 km further to the southwest. Another four samples were taken from a lodgement till (sensu Reference Dreimanis,, Goldthwait, and Matsch,Dreimanis, 1989), which was deposited on top of the over-ridden water-laid sediments.
Basic sedimentological data for sampled Weichselian sediments. C is clay, Si is silt, S is sand, G is gravel, Md is median. U is coefficient of uniformity (D60/D10, Cc is coefficient of curvature


The second group of samples (AK11–AK13) was taken in a gravel quarry at Brügge–Bissee, about 13 km inside the ice limit. They are from lodgement tills deposiied on top of largely undisturbed Saalian and Eemian strata (Reference Marks,, Piotrowski,, Stephan,, Fedorowicz, and Butrym,Marks and others, 1995, Fig. 3).
Samples AK14 and AK15 originate from lodgement tills in a Baltic Sea cliff about 80–90 km inside the ice limit at Heiligenhafen–Johannistal and the Isle of Fehmarn, respectively. At both localities, thick Tertiary clays (Tarras–Ton) with very low hydraulic permeability occur just a few metres below the sampled sediments. These clays constitute a regional aquitard at the base of the Quaternary deposits.
At all localities, the undisturbed samples were collected from unweathered sediments at least several metres below the present land surface and at least about 40cm into the fresh exposure wall. Only massive units with no evidence of fissures or joints were sampled. Steel cylinders, 10cm in diameter and 20 cm long, were mechanically driven into the sediment and then cut out. In the laboratory, specimens for oedometer testing were prepared by pressing a steel cutting ring into the central part of the cylinder to extract the sediment for mounting in the oedometer cell. The steel rings were 50 mm in diameter and 14 mm high. Everysample was tested in at least two parallel experiments. Sedimentological data for the samples are given in Table 1.
In the oedometer experiments under fully drained conditions and with a fixed cutting ring, samples were loaded in ten successively greater stress increments from 19.6 to 6272 kPa, to ensure that the pre-consolidation stresses were clearly exceeded. Each load increment was applied for 24 hours. After 24 hours consolidation had essentially stopped. At the end of the test the stress was reduced to that of the first stress increment.
All consolidation curves exhibit initially elastic and then permanent sediment deformation (example in Figure 4). In some samples, determination of the pre-consolidation stress σ′p was not unequivocal, because of the similar dip angle of both parts of the curve or a rather long transition between the two. Despite several repeated tests, sample AK10 yielded no clear data and will be omitted from further considerations. The pre-consolidalion stresses were determined using the graphical method of Reference Casagrande,Casagrande (1936) (see Reference Craig.Craig, 1988, p.238–46). The test results are summarized in Table 2, where data for parallel tests for the same sample have been averaged to give mean values for each sample. Averaging was applied only in parallel samples which yielded similar consolidation curves and σ′p values which did not differ by more than 100 kPa.
Consolidation curve for sample AK9/II with pre-consolidation stress σ′p and recent overburden stress σ′o.

Averaged stress parameters σ′o (recent overburden stress) and σ′p (pre-consolidation stress), overconsolidation ratios (OCR) and ice thickness above the Potentiometric surface (heff) calculated from 10kPa≈1.11m and assuming 95% consolidation. Although 100% consolidation requires infinite time, after 95% consolidation is reached, additional compression is very slow (Reference Taylor,Taylor, 1948) and can be neglected for practical reasons (Reference Saucer, and Christiansen,Saucer and Christiansen, 1991)

All samples exhibited unexpectedly low σ′p values which, in relation to the recent overburden stress σ′o give very low overconsolidation ratios; in a few cases the recent overburden stress was even roughly equal to the maximum pre-consolidation stress. If pore-water had been at atmospheric pressure upon loading by the glacier, the implied ice thicknesses range between 9 and 61 m. Clearly, these are unrealistically low values and instead must be considered as being representative of the ice thickness above the Potentiometric surface (Table 2; see also Reference Clarke,, Collins, and Thompson,Saucer and others (1993) for a similar conclusion). Pore-water pressures were apparently very near or at the ice-overburden pressure. This can be explained by generally low hydraulic transmissivity of the sub-stratum which hampered efficient drainage of subglacial meltwater. In the study area, aquitards with conductivities of about 2 × 10⁻⁷ ms −1 dominate volumetrically over aquifers by a ratio of 1.6:1 (Reference Piotrowski,, Bartels,, Salski, and Schmidt,Piotrowski and others, 1996; Reference Piotrowski,Piotrowski, 1997a), so that the drainage capacity of the glacier bed was easily exceeded. Reference Piotrowski,Piotrowski (1997a) has shown that only about 25% of meltwater released subglacially could have been evacuated to the ice-sheet foreground as groundwater flow (see also Reference Piotrowski,Piotrowski, 1994b, Reference Piotrowski,1997b).
The relation between high pore-water pressure and the hydraulics of the substratum is particularly obvious for samples AK14 and AK15, which are underlain by thick Tertiary clays. When over-ridden by the glacier, this regional aquitard hindered meltwater drainage from the ice base and triggered pore-water pressure build-up in the sediment to heads corresponding to the flotation point. At those localities, the inferred ice thickness above the Potentiometric surface was about 16m, while the inferred total ice thickness h was probably about 400m (calculated from h=

There is no clear relationship between the pre-consolidation stresses and distance to the ice margin (i.e. ice thickness), which indicates that sediment consolidation was largely controlled by hydraulic properties of the substratum.
One important conclusion from the above is that the method of inferring past ice thickness from pre-consolidation stresses in over-ridden sediments must be treated with extreme caution (cf. Reference Boulton, and Dobbie,Boulton and Dobbie, 1993). Indeed, ice thickness in Finland calculated by Reference Aario,Aario (1971) from pre-consolidation data was much smaller than could be accepted, based on independent geological data. Brown and others (1987) calculated ice thicknesses for the Puget Lowland, which turned out to be about three times too small. Also, ice thicknesses obtained by the same method for northern Germany by Reference Khera, and Schulz,Khera and Schulz (1984) are about one order of magnitude too small in comparison With other evidence. The same refers to the data of Reference Alai-Omid,Alai-Omid (1976) reconstructed for parts of northwestern Germany. The reasons most often quoted for these unreliable results were problems with consolidation tests and sample disturbances, sediment weathering and early diagenesis, macroscopically invisible discontinuities and inhomogeneity in the case of glacial tills. If these error sources are minimized, compression tests may yield accurate ice thickness only above the potentiometric surface, which can differ substantially from the total ice thickness. Examples of total ice-thickness calculations from consolidation parameters cross-checked and confirmed by independent data (e.g. Reference Harrison,Harrison, 1958; Reference Kazi, and Knill,Kazi and Knill, 1969) can possibly be explained by exceptionally high hydraulic transmissivities of the substratum.
Did Subglacial Sediments Deform Pervasively?
Considering high pore-water pressures, pronounced deformations of the sediment can be expected. The shear Strength, τf , of sediment is given by the Coulomb equation

where c is cohesion and ϕ is angle of internal friction. High pore-water pressures facilitate sediment deformation by reducing the effective normal stress, σ z–p w, on the sediment. From the high pore-water pressures inferred above, it follows that deformation of subglacial sediment must be considered a strong possibility for the study area.
Deforming beds have been discovered beneath modern glaciers resting on unconsolidated sediments in Iceland (Reference Clayton,, Mickelson, and Attig,Boulton, 1979, Reference Boulton, and Hindmarsh,1987; Reference Boulton, and Jones,Boulton and Jones, 1979), in North America (Reference Engelhardt,, Harrison, and Kamb,Engelhardt and others, 1978), in the Alps (Reference Schlüchter,, Evenson,, Schlüchter and Rabassa,Schlüchtcr, 1983) and are believed to occur beneath some ice streams in Antarctica (Reference Blankenship, Bentley,, Rooney, and Alley,Blankenship and others, 1986; Reference MacAyeal,MacAyeal, 1989). Reference Boulton, and Hindmarsh,Boulton and Hindmarsh (1987) believed that sediment deformation beneath Breiðamerkurjökull (Iceland) contributes between 80 and 95% of the forward movement of the glacier. Beneath Trapridge Glacier (Yukon), deformation of the subglacial till accounts for more than half of the motion (Reference Clarke,, Collins, and Thompson,Clarke and others, 1984).
Undisturbed, bedded outwash sand and gravel under a Weichselian till. Gravel pit at Brügge, about 15 km south of Kiel.

Beds that underwent significant deformation are also postulated to have existed beneath large parts of the Pleistocene ice sheets (Reference Menzies,Menzies, 1989; Reference Hart,, Hindmarsh and Boulton,Hart and others, 1990; Reference Alley,Alley, 1991; Reference Van der Meer,van der Meer, 1994), although this issue and particularly the sedimentological evidence are still a subject of debate (e.g. Brown and others, 1987; Reference Attig,, Mickelson, and Clayton,Attig and others, 1989; Reference Clayton,, Mickelson, and Attig,Clayton and others, 1989). Obviously, the presence or absence of a subglacial deforming layer has serious consequences for glacier dynamics and therefore for the stability of ice sheets.
Analysis of geological data from northwestern Germany has led Reference Piotrowski,Piotrowski (1994a, Reference Piotrowski,1995) to the conclusion that the Weichselian ice sheet advanced over a relatively stable substratum with no evidence preserved of pervasive strain of the bed sediments. This refers both to the older strata over-ridden by the glacier and to the major part of the Weichselian till itself.
Pervasive deformation of the sub-till sediments is considered unlikely, because these sediments are, in most accessible exposures, typically undisturbed (Fig. 5), with the exception of large-scale folds indicative of low strain rates. In most cases, these sediments are stratified sands and gravels separated from the overlying till by a sharp disconformity. There is no gradual transition in to the till, as would be expected if the sub-till sediments had been subjected to pervasive deformation. Because there is little doubt that the bed was in contact with ice before the till had been emplaced, it seems that basal shear stresses have not caused any significant deformation of the bed. This is also indicated by the preservation of Eemian palaeosols beneath Weichselian tills. There are well over 30 documented localities in northwestern Germany, where Eemian weathering horizons underlie the Weichselian till (Reference Stephan,Stephan, 1981; Reference Felix-Henningsen, and StephanFelix-Henningsen and Stephan, 1982: Reference Walther,Walther, 1990. p.34; Reference Piotrowski,Piotrowski, 1996, p.89). In most cases, these are remarkably well-preserved, largely undisturbed brown earths, para-brown earths and pseudogleys. Typically, only the uppermost centimetres of these palaeosoils are truncated or sheared to some degree but complete profiles are also known. Figure 6 shows a Well-preserved Eemian brown earth developed on undisturbed Saalian outwash. Only the humus horizon is truncated and the soil is capped by the Weichselian till.
Undisturbed Eemian palaeosol (B, brown earth) with truncated humus horizon, developed on Saalian outwash (C) and covered by Weichselian till (A). Exposure at Siek, about 20 km south of Kiel.

Sand clusters at the base of Weichselian till indicating low homogenization of till and thus low deformation rates. Saalian till is visible in the lowermost 20 cm. Gravel pit at Brügge, about 15km south of Kiel.

It may be argued that the subglacial deforming bed was only restricted to the concurrent till, which was separated from the underlying sediments by a rheological boundary. This till is typically up to a lew metres thick and, where not covered by outwask, it is the surficial sediment. Although there has undoubtedly been some deformation within the till layer, there is at present no evidence of a widespread pervasive deformation. This is indicated by the following data:
-
1. If till deformation was significant, the till should now be concentrated near the ice-sheet limit (Reference Haeberli,Haeberli. 1981). This is not the case for the Weichselian till in the study area. Till thickness is somewhat uniform and local thickness undulations do not correlate with the distance to the ice terminus. Although several conspicuous end moraines are present, which indicate considerably long ice-front stagnation coupled with efficient sediment supply, there is no evidence of till pile-up due to transport in the deforming bed on proximal sides of these moraines. Out-wash concentrations along the former ice margin correlate well with outlets of subglacial meltwater channels (e.g. Reference Ehlers, and Wingfield,Ehlers and Wingfield, 1991, Fig. 1; Reference Piotrowski,Piotrowski, 1994b) and cannot be attributed to ice streams potentially capable of transporting outwash sediments.
-
2. Although there is no agreed criterion to identify positively a till that has been pervasively deformed to large strains (Reference Paterson,Paterson, 1994, p. 170), it seems possible to define structural features that indicate that a till has not been pervasively deformed. Because advanced deformation leads to material homogenization, intact clusters of unconsolidated sorted sediments in till indicate that this till was unlikely to have undergone any pronounced deformation. In numerous sections, the Weichselian subglacial tills indeed contain irregular to sub-rounded inclusions of sand and silt, which are typically up to about 0.5m in diameter (Figs 7 and 8). Such clusters occur mostly in the basal parts of the tills. The clusters occasionally exhibit brittle deformations such as fractures and their upper surfaces are often smoothed or truncated. They are interpreted as parts of the substratum that have been incorporated into the glacier base, transported some distance and then redeposited together with the till matrix. Although some minor post-sedimentary movement probably occurred, the largely intact structure of the clusters and the sharp lithological boundary with the till preclude any significant sediment homogenization.
Slightly deformed sand clusters at the base of Weichselian till indicating low homogenization of till and thus low deformation rates. Massive Saalian till underlies the Weichselian till. Gravel pit at Bissee, about 14 km south of Kiel.

Sediment deformations in the study area seem to be restricted to largely isolated low-strain glaciotectonic phenomena that occur in spatially isolated areas of wedging-out subglacial aquifers, areas of pronounced older topography, areas of sharp lithologic contrasts in the substratum (e.g. fine-grained infills of tunnel valleys) and where the ice sheet advanced over permafrost (Reference Piotrowski, and Aber,Piotrowski, 1993). Deformation in the Heiligenhafen area (sample AK14) is of pre-Weichselian (Saalian) age and little is known about the palaeo-glaciologic conditions at that time.
Ploughing marks within a till at the Baltic Sea cliff at Marienfelde, about 15 km north of Kiel.

Heavily ploughed and occasionally fractured till at the Baltic Sea cliff at Friedrichsort, about 5km north of Kiel.

Ice Movement by Basal Sliding
If subglacial sediment deformation did not contribute much to the ice movement in the study area, the movement must have been focused along the ice–bed interface. Indeed, there is good evidence to demonstrate glacier sliding over the bed. In numerous places, ploughing marks and slicken-sides occur both at the till base and within the till itself (Figs 9 and 10). Occasionally, there are thin silt and clay laminae along these discontinuities which indicate temporal ice–bed separation in addition to ice motion (Fig. 11). Brown and others (1987) also found that either sliding at the ice–till interface or localized shearing was probably the main ice-motion component under high subglacial water-pressure conditions of the Puget lobe in North America. Reference Ehlers, and Stephan.Ehlers and Stephan (1979) gave examples of features at the base of tills such as ribs, wedges, edges, slickensides and undulations from northwestern Germany, which also indicate ice sliding over the substratum.
Sub-horizontal fractures in basal till at the Baltic Sea cliff at Surendorf, about 20 km northwest of Kiel. Fractures are filled with silty clay (e.g. below the spatula), which indicates ice–bed decoupling. Fractures exhibit minute slickensides in places and they are interpreted as sliding planes at the glacier base.
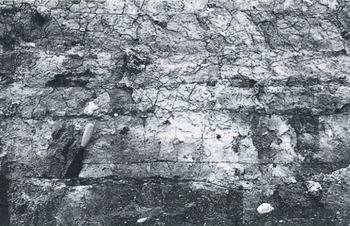
Heavily weathered crystalline boulder with dispersion tail strelching in the down-ice direction (to the left) from the upper, flattened surface of the boulder. The boulder is resting in the till matrix. The tail originated due to erosion of the upper surface of the boulder by the sliding ice base. The boulder was embedded in largely stable subglacial sediment (see Fig. 14b). Gravel pit at Brügge, about 15km south of Kiel.

Another group of evidence for sliding is tails on upper-lee sides of allochthonous blocks embedded in till (Figs 12 and 13). Figure 12 shows a weathered crystalline boulder abraded on top and stretched down-ice for several decimetres. Note a sand cluster above the boulder which, for the reasons given above, makes pervasive deformation unlikely. Furthermore, if this sediment section was to deform pervasively, the boulder should be expected to have rotated, which should have led also to a second, shorter dispersion tail at the bottom in the opposite direction, as shown schematically in Figure 14a. Instead, the boulder was probably stabilized to a large degree after its emplacement and it was simply subjected to abrasion by the ice sole sliding above (see Fig. 14b). A similar feature is shown in Figure 13, where a lens of sandy till is stretched only down-ice, at the top.
In a few exposures, bedded sediments underlying till are sheared along sub-horizontal planes to a depth of about 20–30 cm, named by Reference Stephan,, Goldthwait, and Matsch,Stephan (1989) a zone of intensive shearing. The spacing between individual planes and the magnitude of displacement decreases downwards. In most cases, the maximum measured slip is not more than a few decimetres, so that the contribution of shearing of sub-till sediments to ice motion was radier limited.
Cluster of a sandy till with dispersion tail stretching in the down-ice direction (to the left) from the upper corner of the cluster. The cluster is embedded in a silty clay Weichselian till. Explanation as in Figure 12. Gravel pit at Brügge, about 15 km south of Kiel.

Simplified model representation of erosion tails from a clast below an active ice base moving over a deforming bed (a) and moving over a largely stable bed (b). In (a), vertical distribution of velocity vectors in the deforming bed is such that the deformation rate increases towards the ice base. Therefore, clasts tend to be dragged forward over the substratum, which should lead to dispersion trails on the lower up-ice side of the clast. At the same time, a dispersion tail is produced on the upper down-ice side, where sliding velocity exceeds the deformation rate. This process can be accompanied by clast rotation in the case of well-rounded clasts. In (b), the clast rests firmly within the largely stable bed and the dispersion tail originates only in the down-ice direction along the sliding base of the glacier.

All these data strongly suggest that mainly basal sliding and ploughing were major mechanisms of ice motion which was focused at the glacier sole. Apparently, pore-water pressures near the ice-overburden pressure reduced the strength of the ice–sediment interface much more than that of the sediment. This was recently demonstrated in the modern environment by Reference Iverson,, Hanson,, Hooke, and Jansson,Iverson and others (1995), who showed that at Storglaciären in northern Sweden shear strain rates of the bed decrease during periods of high water pressures and surface speed. This suggests that fast glacier flow may be associated with some combination of ice sliding over the substratum and ploughing rather than with pervasive bed deformation (Reference Clark,Clark, 1995; Reference Iverson,, Hanson,, Hooke, and Jansson,Iverson and others, 1995).
Conclusions
Reconstruction of palaeo-hydraulics of subglacial fine-grained sediments over-ridden by the last ice sheet in northwestern Germany reveal high pore-water pressure in the substratum. Pore-water pressure was probably close to the ice-flotation point and local lifting of the ice sheet from the bed by meltwater seems likely, especially in areas of low hydraulic conductivity of the substratum. Ice–bed decoupling along a thin water film reduced transmission of shear stresses on to the bed, which could have resulted in a wide-spread stability of the substratum. This is also indicated by no evidence of pervasive bed deformation. Locally, however, deformation occurs, so that the study area can be envisaged as a mosaic of largely undeformed substratum with isolated spots of deformed bed where probably no significant reduction in ice-to-bed contact occurred (Fig 15). The outermost part of the ice sheet which rested on permafrost, together with these spots, has supported glacial stresses and stabilized the ice sheet. The major contribution to ice movement was probably basal sliding and ploughing on top of the overpressured substratum sediments.
Schematic representation of the relationship between subglacial shear stresses τ and shear strength of subglacial sediments τf for the study area. The shear stresses transmitted to the ice bed were typically lower than the sediment shear strength, which was caused by reduced ice–bed coupling as a result of high basal water pressures. This was the reason for the apparent stability of the glacier substratum. Only where (due to lower water pressure) the shear stress was a ssumed by the substratum, sediment deformation has occurred. This model implies low deformation rates under conditions of very high water pressures and high ice-movement velocities caused by enhanced basal sliding.

Acknowledgements
We thank V. Feeser for stimulating discussions. Comments of N. R. Iverson and D.L. Pair on an earlier version of this paper are greatly appreciated. Assistance of K. Blaut, S. Böhler and S. -O. Bude in the field and during compression tests is gratefully acknowledged.



