Introduction
Even though the root system is essential to plant growth, historically roots have not been studied in as much detail as the above-ground parts in plants. Currently, the necessity to study root systems is widely recognized (Lynch, Reference Lynch2007; Herder et al., Reference Herder, Van Isterdael, Beeckman and De Smet2010). Also, methodological progress in various fields has improved our ability to visualize, quantify and conceptualize root architecture along with its relationship to plant productivity (Kuijken et al., Reference Kuijken, van Eeuwijk, Marcelis and Bouwmeester2015; Wasaya et al., Reference Wasaya, Zhang, Fang and Yan2018). Knowledge of the genetic basis of root architectural and morphological traits in crop species is limited (Lynch and Brown, Reference Lynch and Brown2012; Jung and McCough, Reference Jung and McCouch2013). Thus, novel research is needed to address this gap (Manschadi et al., Reference Manschadi, Christopher, de Voil and Hammer2006). Dissection of root traits using quantitative trait locus (QTL) analyses may provide insight into the heritability of such traits and make a marker-assisted selection in plant breeding possible with new markers.
Here, the Synthetic W7984 × Opata M85 doubled haploid (SynOpDH) standard mapping population in bread wheat (Triticum aestivum L.) was selected due to its diverse genetic background (Sorrells et al., Reference Sorrells, Gustafson, Somers, Chao, Benscher, Guedira-Brown, Huttner, Kilian, McGuire, Ross and Tanaka2011). The original reference population of Synthetic W7984 × Opata M85 (ITMI) recombinant inbred lines (RILs) has been studied extensively for many traits including abiotic stress tolerance. Significant differences reported (Mujeeb-Kazi et al., Reference Mujeeb-Kazi, Rosas and Roldan1996; Landjeva et al., Reference Landjeva, Neumann, Lohwasser and Börner2008; Sorrells et al., Reference Sorrells, Gustafson, Somers, Chao, Benscher, Guedira-Brown, Huttner, Kilian, McGuire, Ross and Tanaka2011) for drought tolerance between the two parents and on the ITMI population encouraged us to identify genome regions that may be responsible for the differences in root system architecture and development.
Root systems of field crops have been studied since the pioneering work of Weaver and Bruner (Reference Weaver and Bruner1926) with many root system traits being evaluated (Richards and Passioura, Reference Richards and Passioura1981, Reference Richards and Passioura1989; Sharma et al., Reference Sharma, Xu, Ehdaie, Hoops, Close, Lukaszewski and Waines2011). More recently with the advantage of genetic mapping, several studies have been performed on QTL associated with root system traits. These studies were performed with many different screening methods to understand genetics, morphology and anatomy of the root system, including but not limited to gel observation chambers, clear pots, 2D and 3D imaging, soil columns, PVC tubes, field core samples and shovelomics (Weave and Bruner, Reference Weaver and Bruner1926; Oyanagi, Reference Oyanagi1994; Bengough et al., Reference Bengough, Gordon, Al-Menaie, Ellis, Allan, Keith, Thomas and Forster2004; Ehdaie and Waines, Reference Ehdaie and Waines2006; Trachsel et al., Reference Trachsel, Kaeppler, Brown and Lynch2011; Topp et al., Reference Topp, Iyer-Pascuzzi, Anderson, Lee, Zurek, Symonova, Zheng, Bucksch, Mileyko, Galkovskyi and Moore2013; Richard et al., Reference Richard, Hickey, Fletcher, Jennings, Chenu and Christopher2015). These studies derived important characteristics such as increased nodal root number, xylem vessel diameter, long root hairs, seedling root vigour, vigorous and deep root system, root weight, root length (RL) density, root angle and high hydraulic resistance (Richards and Passioura, Reference Richards and Passioura1981; Lynch, Reference Lynch2007).
Climate change and yield losses force plant breeders to redesign breeding schemes. Priorities are shifting to drought/heat tolerance, local adaptability and resource allocation (Lynch, Reference Lynch2007; Herder et al., Reference Herder, Van Isterdael, Beeckman and De Smet2010). Plants with deep and dense root systems, which have the potential for higher soil exploration to access stored water in deeper soil zones, have better stress tolerance under drought conditions (Passioura, Reference Passioura1983; Ehdaie et al., Reference Ehdaie, Whitkus and Waines2003; Manschadi et al., Reference Manschadi, Christopher, de Voil and Hammer2006; Bengough et al., Reference Bengough, McKenzie, Hallett and Valentine2011).
Here, we aimed to evaluate biomass allocation and phenology interactions. Our study aimed to dissect genotypic variation for root and shoot biomass (SM) allocation, grain yield (GY) and important phenological traits in the SynOpDH population under glasshouse conditions and to identify genome regions associated with these traits.
Materials and methods
Seed samples of a set of DH lines from the SynOpDH mapping population (T. aestivum L.) were provided by Dr Mark Sorrells, Department of Plant Breeding and Genetics, Cornell University, Ithaca, NY. This population consists of 215 DH lines generated from the F1 hybrid of Synthetic W7984 with cv. Opata M85. Synthetic W7984 is a man-made amphiploid derived from the durum wheat line, ‘Altar 84’ (Triticum turgidum subsp. durum (Desf.) Husn), crossed with the accession (219) ‘CIGM86.940’ of Aegilops tauschii Coss. (Nelson et al., Reference Nelson, Deynze, Sorrells, Autrique, Lu, Negre, Bernard and Leroy1995). From the entire set of DH lines in the SynOpDH population, 147 lines and parental lines were selected for the experiments – the same set of 147 lines genotyped by Poland et al. (Reference Poland, Brown, Sorrells and Jannink2012).
Seeds of similar size were sterilized with 1% sodium hypochlorite solution, rinsed with distilled water before germination. According to vernalization data from Sorrells et al. (Reference Sorrells, Gustafson, Somers, Chao, Benscher, Guedira-Brown, Huttner, Kilian, McGuire, Ross and Tanaka2011), lines with vernalization requirement were planted in flats with sand and vernalized for 10 weeks at 2–5°C. Other seeds without a vernalization requirement were germinated 5 d before transplanting into tubes. It was aimed to match average seedling sizes between vernalized and unvernalized seedlings. From the set of seedlings for each genotype, seedlings of similar size were transplanted into PVC tubes of 1 m long and 10 cm diameter filled with 10.5 kg #30-grade silica sand with a bulk density of 1.42 g ml−1 and 24% field capacity (w/w) in polyethylene tubular inner sleeves (Sharma et al., Reference Sharma, Bhat, Ehdaie, Close, Lukaszewski and Waines2009) on 20 February 2013 and 15 January 2014. Sand-filled tubes were brought to the water holding capacity by generous watering for two consecutive days prior to planting. One seedling per PVC tube with three replications (randomized complete blocks design) in each season was tested. Plants were grown under natural photoperiod in a temperature-controlled glasshouse (20–30°C and 50–90% relative humidity). Plants in PVC tubes were irrigated daily with half-strength Hoagland's nutrient solution (1000 ppm) (Hoagland and Arnon, Reference Hoagland and Arnon1950), 100 ml in early growth periods and 250 ml in later periods to avoid drought stress. Two small holes were made at the bottom of each plastic bag for proper drainage.
After the plants were grown until maturity (GS92), spikes and shoots were harvested separately and dried in a hot air oven at 65°C for 72 h. The plastic sleeves were taken out of the PVC tubes and cut lengthwise. Roots were washed out of the sand carefully and their total length was measured. Deep roots and shallow roots were separated at 30 cm depth from the soil level according to previous observations and packed separately for air drying in the glasshouse followed by a hot air oven for 72h at 65°C. To evaluate phenological traits for each plant, days from transplanting into tubes to booting (DTB-GS41), to heading (DTH-GS51), to anthesis (DTA-GS61) and to maturity (DTM-GS92) were recorded (Zadoks et al., Reference Zadoks, Chang and Konzak1974), and plant height (PH), number of tillers (NT), number of fertile tillers (FT), number of spikes (NS), flag leaf length (FLL) and flag leaf width (FLW) were measured prior to harvest. Shoot biomass (SM), shallow root weight (SRW), deep root weight (DRW), total root biomass (RM), total plant biomass (PM), GY, 1000 grain weight (1000gW), harvest index 1 (HI1; GY divided by above-ground total biomass), harvest index 2 (HI2; GY divided by PM including roots), root/shoot (R/S) ratio and RL per plant were collected after harvest (Ehdaie et al., Reference Ehdaie, Merhaut, Ahmadian, Hoops, Khuong, Layne and Waines2010; Gonzalez-Paleo and Ravetta, Reference Gonzalez-Paleo and Ravetta2012).
Statistical analysis
Statistical analyses were performed using the Statistix software (Analytical Software; Tallahassee, FL, USA). The normality of data distribution was tested by Pearson probability plots. Analysis of variance (ANOVA) (Steel et al., Reference Steel, Torrie and Dickey1997) was performed to evaluate the main phenotypic effect of genotype, year and genotype × year interactions for all traits (online Supplementary Table S1). Genotypes were replicated three times each year and averages of three replicates were calculated in order to obtain means for each genotype in each year.
Heritability (H2) within and between years was calculated as H2 = VG/VP, where VG is the genetic variance and VP is the phenotypic variance, by using ANOVA function of the software package ICIMapping by composite interval mapping (Li et al., Reference Li, Ribaut, Li and Wang2008).
Significant main effects for genotype and the year were observed for all traits (P < 0.01), except for the FT. The magnitude of the genotype × year interaction was significant across all traits except DRW, PH, 1000gW and R/S ratio. Therefore, the data for experiments conducted in 2013 and 2014 were analysed separately and compared later for ratings of genotypes, histogram distributions and QTL validation.
Genetic mapping
The SynOpDH population is a standard population mapped multiple times. Two genotyping-by-sequencing (GBS) (Elshire et al., Reference Elshire, Glaubitz, Sun, Poland, Kawamoto, Buckler and Mitchell2011) based maps by Poland et al. (Reference Poland, Brown, Sorrells and Jannink2012) and Saintenac et al. (Reference Saintenac, Jiang, Wang and Akhunov2013) were used for linkage and QTL mapping. A total of 1485 GBS single nucleotide polymorphism (SNP) markers were placed in 21 linkage groups with a total of 3243.53 cM map length by using the marker data of Poland et al. (Reference Poland, Brown, Sorrells and Jannink2012). Similarly, Saintenac et al. (Reference Saintenac, Jiang, Wang and Akhunov2013) mapped 2740 gene associated SNP markers from the 9 K iSelect SNP assay (Cavanagh et al., Reference Cavanagh, Chao, Wang, Huang, Stephen, Kiani, Forrest, Saintenac, Brown-Guedira, Akhunova and See2013). The genetic linkage map of Poland et al. (Reference Poland, Brown, Sorrells and Jannink2012) was used for QTL mapping and marker data from Saintenac et al. (Reference Saintenac, Jiang, Wang and Akhunov2013) were used to create a second linkage map for validation of Ppd-D1 gene. The parental line Opata M85 is spring wheat with a day-length insensitivity allele (Ppd-D1a) and Synthetic W7984 carries a day-length sensitivity allele (Ppd-D1b) (http://www.wheatpedigree.net/sort/show/46697; Sorrells et al., Reference Sorrells, Gustafson, Somers, Chao, Benscher, Guedira-Brown, Huttner, Kilian, McGuire, Ross and Tanaka2011).
Linkage mapping was done using the software package JoinMAP (Van Ooijen, Reference Van Ooijen2006). The mean phenotypic value of three replications in each year was used to detect QTL by the software package ICIMapping by composite interval mapping (Li et al., Reference Li, Ribaut, Li and Wang2008). Logarithm of the odds (LOD) score of 3.45 was derived as a threshold based on Van Ooijen (Reference Van Ooijen1999). LOD score of 2.5 was also tested to catch more marker × trait associations. However, those associations were not called as QTL, unless the same loci were observed over 2 years with 2.5 or higher LOD score. Kosambi function and Maximum likelihood algorithm were used for mapping. QTL analysis was performed separately for each year and phenotypic means for each trait from the second year's data were used to validate the QTL found in the first year. Simple correlation analysis (Pearson) was performed to evaluate interactions between all traits separately for each year's mean data.
Results
Analysis of variance (ANOVA) was performed to determine the genotypic variation for each trait measured in the experiment. Histograms for all traits were prepared and most distributions were normal while some were skewed to right or left (online Supplementary Fig. S1). Parental lines Synthetic W7984 and Opata M85 were significantly different for RM, SRW, DRW, NS per plant, seed/spike (S/S), PH, RL and days to heading (DTH) in both years. Even though line distribution for both years was mostly similar, the mean values for synthetic and Opata M85 parental lines were contrasting for some traits over the years. We do not have a clear explanation for the contrasting values at this moment except it may be due to seasonal changes. There were no consistent differences between parents for SM, GY, FT, NT, days to booting (DTB), DTH, days to anthesis (DTA), 1000gW, HI1, HI2, R/S ratio and PM over 2 years. However, strong transgressive segregation and highly significant differences were observed within the progeny. For most traits, the range of variation among progeny was well outside of the range of parents (Table 1).
Mean phenotypic values for parents and 147 progeny of the SynOpDH bread wheat population; minimum and maximum values and standard deviations, F test and P values for RM, SRW, DRW, SM, GY, number of seeds (NSd), S/S, FT, NT, PH, RL, DTB, DTH, DTA, 1000 gW, HI1, HI2 (GY/PM), R/S ratio and PM in 1 m tubes under well-watered conditions

H2: broad sense heritability. *p < 0.05.
The mean values for biomass accumulated in 2014 were higher than in 2013. Mean values of RM ranged from 0.61 to 8.57 g per plant in 2013 and 1.59 to 13.1 g per plant in 2014, respectively. Means of SM ranged from 8.8 to 62.5 g per plant in 2013 and 25.7 to 98.8 g per plant in 2014, respectively. Shallow root weights ranged from 0.61 to 7.51 g in 2013 and from 1.59 to 11.57 g per plant in 2014. Means for DRW were between 0 and 2.10 g in 2013 and between 0 and 1.95 g per plant in 2014. The phenotypic range of PH was between 60.7 and 99 cm in 2013 and between 51.1 and 137.9 cm in 2014. Mean values for GY ranged from 1.6 to 23.4 g per plant in 2013 and 8.9 to 39.5 g per plant in 2014. The average DTA was 59 and 71.8 d for 2013 and 2014, respectively, while ranges for the same trait were between 40.3 and 103.7 d in 2013 and between 48.7 and 103 d in 2014 (Table 1).
Significant positive correlations were observed, when RM on one hand and SM, NT, RL, DTA and DRW on the other hand. Additionally, SM was positively correlated with GY, DRW, NT, RL and DTA. Grain yield was positively correlated with RL, whereas HI1 had a slightly negative correlation with RM, SRW and NT (Table 2).
Overall means for each line from 2013 and 2014 were used separately for Pearson correlation analysis

P values are given below each correlation.
Significant associations were detected over 15 linkage groups for 14 different traits based on QTL analysis. Even though 41 marker × trait associations in 2013 and 27 in 2014 were detected, only 14 of those were validated in the second year (Table 3).
QTL associated with GY, SM, RM, SRW, DRW, FT, PH, RL, DTA and FLW in the SynOpDH population

Plants were grown in 1 m PVC tubes under well-watered conditions until maturity for two seasons. Peak positions (cM) with the highest LOD score, left and right markers, the LOD scores, percent phenotypic effects and additive effects.
a LOD score of 3.45 was used for the declaration of QTL.
b Phenotypic variation explained by QTL.
c Additive effect of QTL.
d LOD threshold value of 2.5 was used for the QTL declaration.
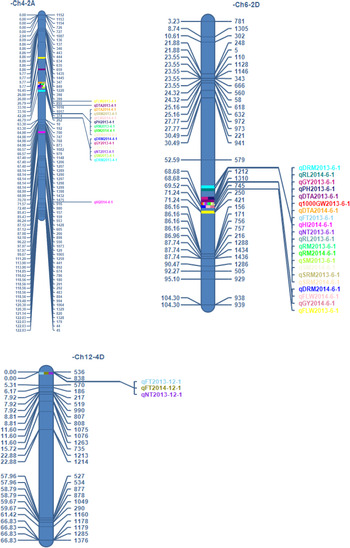
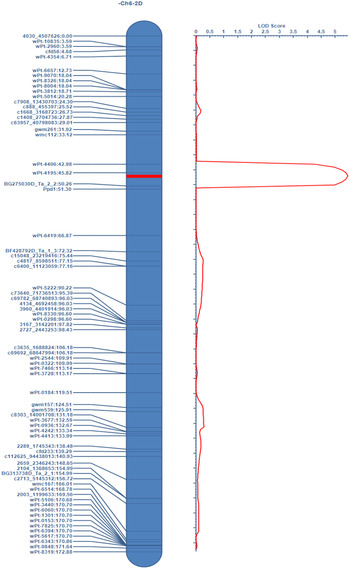
The same segment on chromosome 2A was associated with biomass (DRW, SRW, RM and SM) and phenology (DTA) related traits (Fig. 1a). An apparently homoeologous locus on chromosome 2D was associated with biomass traits (DRW, SRW, RM and SM), phenology (DTA), and other traits (RL, FLW and GY) in both years (Fig. 1b). A locus on chromosome 4D affected FT and was detected in both years (Fig. 1-c). The region on chromosome 2D is in the general area of the Ppd-D1 locus on chromosome 2D, affecting day length sensitivity (Fig. 2). Genetic locations of peak points for the QTL for DTA and biomass related traits (SM, RM, DRW and SRW) were within 1 cM distance on chromosome 2D. Additional minor marker × trait associations are listed in online Supplementary Table S3. But they were not called as QTL due to low LOD scores and/or only seen at 1 year.
Ch4-2A: location of QTL on bread wheat chromosomes 2A for DRM/DRW, SRM/SRW, RM, SM and DTA with the linkage map from Poland et al. (Reference Poland, Brown, Sorrells and Jannink2012). Ch6-2D: location of QTL on bread wheat chromosomes 2D for DRM/DRW, SRM/SRW, RM, SM, DTA, RL, FLW and GY with the linkage map from Poland et al. (Reference Poland, Brown, Sorrells and Jannink2012). Ch12-4D: location of QTL on bread wheat chromosomes 4D for the FT with the linkage map from Poland et al. (Reference Poland, Brown, Sorrells and Jannink2012). Marker names, marker positions and LOD scores are presented on the linkage map. The loci that only found 1 year, are not called as QTL.

High-resolution linkage map from Saintenac et al. (Reference Saintenac, Jiang, Wang and Akhunov2013) for the QTLs listed in Figure S2b (RM, SM, SRW, DRW) on chromosome 2D of bread wheat. Marker names, locations and LOD scores are presented on the linkage map. An additional marker between the peak point of the QTL and the Ppd-D1 gene is located.

Discussion
A wheat root ideotype may have deep and dense seminal roots in order to capture water for high plant water status, narrow xylem vessel diameters (or thinner roots) for high hydraulic resistance, long root hairs and extensive lateral root development for maximum nutrient acquisition (Passioura, Reference Passioura1983). These features would increase the plant's chances of surviving an entire season with minimum stress limitations. Therefore, screening germplasm accessions for variation in root architecture is necessary to identify and perhaps breed wheat lines with some of the above-mentioned root characters.
Any given study evaluating crops in controlled conditions needs field trials as a validation. However, field evaluation of mapping populations for mature root characteristics in a replicated trial is still not feasible. Also, phenotypic data gained from field evaluations have lower resolution than controlled experiments given the current technical limitations on root studies. Therefore, experiments were conducted in a glasshouse in PVC tubes. Evaluation of 147 progeny is not an optimal number (>500 is suggested), due to the possibility of the Beavis effect (Beavis, Reference Beavis1994); thus, the results obtained in this study need further validation with larger population sizes.
The present study aimed to dissect QTL affecting the below-ground traits of bread wheat at maturity in a standard mapping population and to look for the associations of these traits with the above-ground characteristics and phenological traits. Root studies on mature plants are limited and this study aimed to add some steps to understanding mature wheat root architecture and its genetic background. The below-ground traits or the root system architecture can be measured/expressed in a number of ways. Perhaps the most accurate, but technically the most challenging, would be to count the numbers of nodal and/or seminal roots to determine their weights and lengths individually, and as classes. Such approaches are common at the seedling stage. However, at maturity, the root system of wheat is very dense, and it would be extremely difficult to separate individual roots, or even classes of roots. For this reason, in this study, the RM and the weights of deep and shallow roots were measured.
The SynOpDH population was selected for its unique characteristics. Even if the parent's Synthetic W7984 and Opata M85 did not differ for some of the traits, the wide genetic background of the population almost guarantees segregation in the progeny. Additionally, the grandparent, accession (219) ‘CIGM86.940’ of A. tauschii was specifically selected for genetic improvement in bread wheat by Mujeeb-Kazi et al. (Reference Mujeeb-Kazi, Rosas and Roldan1996).
Phenotypic differences between parents are not a pre-requisite for segregation in the progeny. As we observed here, both parents are spring type, but there are more than 30 lines that segregate for vernalization genes in the progeny (Sorrells et al., Reference Sorrells, Gustafson, Somers, Chao, Benscher, Guedira-Brown, Huttner, Kilian, McGuire, Ross and Tanaka2011). And this vernalization process added more complications to the experimental system. Since the study was planned to run until maturity, we had to vernalize some lines but not others. We do not know if vernalization itself, and all the manual handling associated with it, has any impact on root characteristics, but we are unable to design and execute an experiment to test it. When QTL analysis was performed with and without the vernalized lines, the same QTLs were found and LOD scores were similar (Table 3 and online Supplementary Table S2). So, vernalization did not have any significant effect on QTL detection. Nevertheless, all the above factors and the unique genetic structure made SynOpDH population a well-defined set of lines for our study of the root system and phenological traits for QTL mapping.
Phenotypic values for most above and below ground traits were in a significant positive correlation with DTA. The two loci on homoeologous group 2 chromosomes were responsible for 6.81–7.26% (2A) and 17.02–17.97% (2D) of the phenotypic variation for DRW in 2013 and 2014, respectively. This effect was statistically significant given that the trait is multigenic. There are no previous reports of QTLs for DRW at maturity, shared results between our study and previous studies. Many environmental factors affect the growth rate of above-ground plant parts, and it would be unreasonable to assume they do not affect root development, especially when the root system is capable of plastic responses to environmental cues. Therefore, the results collected at the seedling stage, in experiments of short duration, may not follow the same trends in the later stages of development. There is still no clear picture of the entire lifecycle of the root system and factors affecting it. However, to understand the progress root development we need to evaluate it at every stage and up to maturity. We do know that during the grain filling period major changes take place in a wheat plant with regard to resource allocation and remobilization, and it is sensible to assume that this also involves the root system (Radville et al., Reference Radville, McCormack, Post and Eissenstat2016; Hu et al., Reference Hu, Sørensen, Wahlström, Chirinda, Sharif, Li and Olesen2018). In this sense, our measurements were taken at maturity to complement the picture created at the seedling stage. However, the same SynOpDH population now must be studied at earlier stages of development to establish any correlations between seedlings and mature plant root systems.
One major effect of QTL on chromosome 2D was responsible for 24.7 and 40.02% of the phenotypic variation of the SRW in 2013 and 2014, respectively. The same locus on 2D co-located with DRW and RM as well as SM (Fig. 1b). These results indicate that lines with larger RM had well-distributed DRW and SRW through the soil profile. We are not aware of any report of SRW QTL at maturity except our previous publication with a different RIL (Iran #49 × Yecora Rojo) population (Ehdaie et al., Reference Ehdaie, Mohammadi, Nouraein, Bektas and Waines2016). We identified a locus on chromosome 2D affecting RM and SRW in that study. Shallow root weight becomes important in certain nutrient deficiencies since the number of nodal roots increases total soil volume exploration. Long nodal roots and root hairs are indicators of a large shallow root system. Shallow root weight can be used as an easy-to-measure parameter to detect genotypic variation in germplasm to prevent nutrient deficiencies. Breeding extensively shallow-rooted cultivars for nutrient-deficient conditions and better uptake of non-mobile nutrients may help save yield losses (Lynch, Reference Lynch2013; York et al., Reference York, Nord and Lynch2013). A wheat ideotype with narrow root diameters, long-haired and wide-angled roots for better nutrient uptake is suggested (Lynch, Reference Lynch2013). Therefore, knowing the limitations of target regions is important to make the right decisions in breeding targets. Breeders need to choose either a relatively large shallow root system to prevent nutrient deficiencies or a deep and dense root system to prevent water stress/drought (Asseng et al., Reference Asseng, Ritchie, Smucker and Robertson1998). A major part of the carbon consumed by the root system goes to nodal root development. It is suggested that reduced shallow-nodal root size and increased deep-seminal root size may reduce the carbon cost of roots and increase GY significantly (Watt et al., Reference Watt, Wasson, Chochois, Eshel, Beeckman, Eshel and Beeckman2013). This approach may be applicable in high-fertilizer input conditions or soils without any mineral deficiency.
Two QTLs on chromosomes 2A and 2D explained 12.75–17.75% (2A) and 26.60–40.04% (2D) of the total phenotypic variation for RM in 2013 and 2014, respectively (Table 3). Our findings were in agreement with Bai et al. (Reference Bai, Liang and Hawkesford2013) and Ehdaie et al. (Reference Ehdaie, Mohammadi, Nouraein, Bektas and Waines2016) who reported QTL affecting seminal root biomass on chromosome 2D, and Sanguineti et al. (Reference Sanguineti, Li, Maccaferri, Corneti, Rotondo, Chiari and Tuberosa2007) who reported a QTL on chromosome 2A. Other studies reported RM (root dry weight) QTL mostly for the seedling stage (Sanguineti et al., Reference Sanguineti, Li, Maccaferri, Corneti, Rotondo, Chiari and Tuberosa2007; Sharma et al., Reference Sharma, Xu, Ehdaie, Hoops, Close, Lukaszewski and Waines2011; Bai et al., Reference Bai, Liang and Hawkesford2013; Zhang et al., Reference Zhang, Cui and Wang2014). Plants with deep and dense root systems, which have the potential to access water stored in deeper soil zones, have better stress tolerance and less nitrogen leaching (Passioura, Reference Passioura1983; Ehdaie et al., Reference Ehdaie, Whitkus and Waines2003; Bengough et al., Reference Bengough, McKenzie, Hallett and Valentine2011). Two of the major characteristics of green revolution wheat were day length insensitivity and semi-dwarfing. This provided a wide adaptation of cultivars to diverse environments. Our study implies that the two characteristics might have also had an indirect effect on root vigour. First, semi-dwarfing genes reduced PH and tillering in order to increase GY and HI, but also limited the carbon allocated to the above and/or below ground biomass accumulation. Second, day length insensitivity reduced the stay green period of plants by allowing intermediate and spring types to grow in any part of the world with a shorter vegetative period, allowing less time for root and shoot growth. Even though these efforts helped to increase GY and HI under optimum growth conditions, reduced carbon flow to roots and shoots reduced total biomass thus resulting in shallow, small rooted cultivars with limited drought tolerance.
The locus on chromosome 2D for root characteristics was located near the known major locus for the photoperiod sensitive response, Ppd-D1b on chromosome 2D (Fig. 2). The question asked here is: are the changes observed in root characteristics a pleiotropic effect of the photoperiod response or are there a separate locus/loci controlling root characters in the vicinity of Ppd-D1 locus? To get more marker density in this region, a different linkage map with a marker for the Ppd-D1 locus was used (Saintenac et al., Reference Saintenac, Jiang, Wang and Akhunov2013). In the new map, there was one additional marker between the Ppd-D1 gene and the most likely location of the root biomass QTL. Moreover, with the new map, the linkage block was 9 cM instead of 16 cM of the previous linkage map. On the new linkage map, the Ppd gene is located just outside of the linkage block (Fig. 2). As a result, the location of QTL was more accurate with the new map. Genetic maps with much higher resolution and larger populations are needed to fine map the QTL and to validate its phenotypic effect. There may be an interaction between Ppd genes and root biomass but to evaluate it properly, sets of isogenic lines, developed specifically for this purpose, are needed.
Day length sensitivity genes (Ppd) have a major effect on plant phenology. Here, we observed a significant effect of the Ppd-D1b allele. Opata M85 is spring wheat with day-length insensitivity allele Ppd-D1a, while Synthetic W7984 carries Ppd-D1b (http://www.wheatpedigree.net/sort/show/46697; Sorrells et al., Reference Sorrells, Gustafson, Somers, Chao, Benscher, Guedira-Brown, Huttner, Kilian, McGuire, Ross and Tanaka2011). The Ppd-D1b allele of Synthetic W7984 causes day length sensitivity (longer vegetative growth), while the Ppd-D1a allele from the Opata M85 is day length insensitive.
We located the same locus on chromosome 2D with a 16.68 and 14.08% phenotypic effect on RL in 2013 and 2014, respectively. We did not find any previous study reporting QTL for RL on 2D, not surprisingly given that most previous studies reported RL at the seedling stage. However, three other associated regions that we located in only one year were on chromosomes 3B, 2D and 7D and they were in agreement with Li et al. (Reference Li, Chen, Wu, Zhang, Chu, See, Brown-Guedira, Zemetra and Souza2011), Liu et al. (Reference Liu, Li, Chang and Jing2013) and Bai et al. (Reference Bai, Liang and Hawkesford2013). Since we found the effects of the above loci only in one year with relatively low LOD scores, we are not including them as validated QTL (online Supplementary Table S3). However, these marker × trait associations are worth further evaluation.
SM was also associated with the same loci on 2A with 12.68–15.92%, and on 2D with 47.07–49.73% total phenotypic effects in 2013 and 2014, respectively. Li et al. (Reference Li, Peng, Xie, Han and Tian2010) reported QTL for SM on 2D and 5D. Other SM QTL were reported for seedling on chromosomes 1D, 2A, 2B, 4A, 4B, 5D, 6B, 6D (Zhang et al., Reference Zhang, Cui and Wang2014), 4D, 5A (Bai et al., Reference Bai, Liang and Hawkesford2013) and 1B (Sanguineti et al., Reference Sanguineti, Li, Maccaferri, Corneti, Rotondo, Chiari and Tuberosa2007; Petrarulo et al., Reference Petrarulo, Marone, Ferragonio, Cattivelli, Rubiales, De Vita and Mastrangelo2015). SM is an important parameter of vigorous growth habit. The extensive shoot development of some cultivars is of significant interest for farmers of remote regions, due to straw being used as animal feed (Morgounov et al., Reference Morgounov, Keser, Kan, Küçükçongar, Özdemir, Gummadov, Muminjanov, Zuev and Qualset2016).
A major QTL on chromosome 2D was responsible for 22.7 and 19.2% of the phenotypic variation in GY in 2013 and 2014, respectively. Additionally, GY and most biomass traits were positively correlated (0.27–0.83). The vigorous growth of the above and/or below ground biomass seems associated with increased GY, at least in the conditions of our experiments. As previously reported by Worland (Reference Worland1996) an allele of the Ppd gene may affect the vegetative period by 4–8 d, and the 63 and 54 d of the range observed on phenology suggests multiple allelic variabilities (Ppd-A1, B1 and D1 alleles). The extended vegetative growth allows more carbon allocation for stem elongation and deep rooting (Worland, Reference Worland1996).
Conclusions
In the present study, we evaluated root and SM traits as well as GY-related traits at maturity for SynOpDH doubled haploid mapping population. Two major QTLs were detected on chromosomes 2A and 2D explaining major phenotypic variation for root and SM traits as well as GY. These QTLs were closely located with the day length sensitivity alleles of the Ppd-D1 gene.
The QTL reported here require further validation. Finding QTL that increases root biomass, root density and RL may provide useful candidate lines for marker-assisted breeding. Targeting root ideotypes including deep rooting for water deficit conditions and a large shallow root system for nutrient deficiencies, which are needed for changing environmental conditions, may be feasible and easier with the benefit of marker-assisted selection.
Supplementary material
The supplementary material for this article can be found at https://doi.org/10.1017/S1479262120000192.
Acknowledgements
The authors are grateful to Dr Adam J. Lukaszewski, University of California, Riverside for discussions and critical edits on manuscript preparation. This work was supported by the University of California, Riverside, Botanic Gardens, The California Agricultural Experiment Station and a doctoral fellowship of the Turkish Republic Ministry of National Education to Harun Bektas.