1 Introduction
The focus of the present work is on the interaction of neutrally buoyant hard spherical particles with vortical flow inside cavities in a microchannel. The main objective is to study distinctive features of the inertial motion of finite size particles in microconfined geometries. Due to the small length scales of the flow in a microchannel, the particle size is comparable to the length scale of the conduit. The vortical flow inside the cavity is generated by inertial flow of a Newtonian fluid in a rectangular microchannel geometry. Flow separation from the leading cavity wall results in formation of a vortex bubble, or a ‘flow cell’ inside the cavity. The flow inertia is represented by Reynolds number
 $Re$
, defined using the average flow velocity in the channel
 $\langle u\rangle$
, hydraulic diameter
 $h_{d}$
of the microchannel and fluid kinematic viscosity
 $\unicode[STIX]{x1D708}$
as
 $Re=\langle u\rangle h_{d}/\unicode[STIX]{x1D708}$
. It will be demonstrated using detailed microfluidic experiments and lattice-Boltzmann simulations that finite size particles move on stable limit cycle orbits inside the cavity, leading to infinite residence time after entrapment. We will examine the effect of cavity size and
 $Re$
on particle entrapment. It will be shown that by proper adjustment of
 $Re$
, a rectangular microcavity connected to a microchannel entraps particles based on particle diameter; therefore, in addition to representing a simplified model for studying interaction of mixtures with biologically relevant vortical flows, such as blood flow in stenosis and aneurysm geometries, the confined microcavity can be utilized for filtration of multimodal mixtures.
Although vortical flows frequently appear in turbulence (Jeong & Hussain Reference Jeong and Hussain1995), laminar flow can generate wakes and recirculating flows in regimes well below turbulent transition. A well-known example is flow over bluff bodies at
 $Re\sim O(10)$
, where separation of the boundary layer leads to formation of recirculating flow behind the object (Taneda Reference Taneda1956a
,Reference Taneda
b
). The prominent feature of laminar wakes behind a fixed object in unbounded steady flows is absence of fluid mass exchange between the recirculating region and the free stream, i.e. the wake creates an isolated zone with no convective mass exchange with the free stream (Batchelor Reference Batchelor1967). The limiting fluid streamlines formed between the recirculating flow region and the free stream, or the separatrix, prevent convective transport of fluid mass. Molecular diffusion is the only mass exchange mechanism between the recirculating flow and the free stream. Considering its importance in mixing and transport phenomena, the mass transfer between the recirculating region and free stream has been studied for flow of pure fluids over open unconfined cavities and is explained as a ‘lobe dynamics’ mechanism: the unsteady flow of fluid results in formation of lobes on the separatrix which convey the fluid between the cavity and free stream (Jana, Metcalfe & Ottino Reference Jana, Metcalfe and Ottino1994; Horner et al.
Reference Horner, Metcalfe, Wiggins and Ottino2002; Horner, Metcalfe & Ottino Reference Horner, Metcalfe and Ottino2015). For the particle-laden flow over a recirculating wake, the mass exchange is affected by the presence of particles. For instance, particles can enter or exit the wake by collision with one another (Haddadi et al.
Reference Haddadi, Shojaei-Zadeh, Connington and Morris2014), or due to the effect of lift force at inertial flow which generates a lateral migration towards the recirculating flow (Hur, Mach & Di Carlo Reference Hur, Mach and Di Carlo2011). It has to be pointed out that entry of particles leads to replacement of fluid mass from the recirculating flow region; therefore particle entry generates a fluid mass exchange.
Laminar vortices and recirculating wakes appear in various biological and industrial applications. Vortical flows inside a cavity (Horner et al. Reference Horner, Metcalfe and Ottino2015), a tubular expansion (Karino & Goldsmith Reference Karino and Goldsmith1977) or a backward facing step (Bluestein et al. Reference Bluestein, Gutierrez, Londono and Schoephoerster1999) have been used as simple models of recirculating flow in human arteries, such as aneurysms or arterial stenosis. Progress in computational fluid dynamics modelling combined with magnetic resonance imaging provide valuable insight into recirculating flow of pure fluids in arterial geometries (Rayz et al. Reference Rayz, Boussel, Lawston, Acevedo-Bolton, Ge, Young, Higashida and Saloner2008). The critical importance of patient specific prognosis tools for understanding the thrombosis phenomenon necessitates deeper insight into the dynamics of blood components in vortical flows. Considering that blood is a multimodal mixture composed of small red cells and platelets to large white cell particles dispersed in the plasma, motion of blood particles in a vortex depends on particle diameter. Despite progress in computational modelling of pure fluid flow in vortex forming geometries, the understanding of particle interaction with recirculating flows is still limited. In order to understand fluid dynamics of thrombosis, Karino & Goldsmith (Reference Karino and Goldsmith1977) studied flow of suspensions of red blood cells and spherical microparticles in a vortex of a tubular expansion. By measuring particle residence times, the unstable motion of individual red blood cells, which move outward and exit the vortex, was compared to large clusters of red cells which demonstrate stable orbits leading to large residence time inside the recirculating flow. Dynamics of particles in wakes behind bluff bodies has been studied by Haddadi et al. (Reference Haddadi, Shojaei-Zadeh, Connington and Morris2014) and Haddadi, Shojaei-Zadeh & Morris (Reference Haddadi, Shojaei-Zadeh and Morris2016) using combined discrete particle simulations of lattice-Boltzmann and microfluidic experiments. The outward motion of particles towards a stable limit cycle trajectory close to vortex boundaries has been examined in detail. Numerical simulation of particle trajectories have corroborated that particles spiral towards a unique limit cycle orbit. Unless perturbed by hydrodynamic interaction with other particles, the motion of an isolated particle on the limit cycle trajectory continues without deviation. In addition to biological applications, interaction of particles with recirculating flow regions appears in the oil industry, for instance flow of a drilling fluid in fractures, where suspended particles are entrapped inside the recirculating flow inside crevices. Understanding the particle entrapment in crevices is critical for conveying a drilling fluid with uniform concentration of particles through the fracture media (Berkowitz Reference Berkowitz2002).
Due to their precision in controlling microscale flows, microfluidic platforms have been utilized to study flow of mixtures at small length scales (Anna, Bontoux & Stone Reference Anna, Bontoux and Stone2003; Gossett et al. Reference Gossett, Tse, Lee, Ying, Lindgren, Yang, Rao, Clark and Di Carlo2012) and size-based separation of particles using microscale flows (Bernate et al. Reference Bernate, Liu, Lagae, Konstantopoulos and Drazer2013; Risbud & Drazer Reference Risbud and Drazer2014). Although flow of suspensions through a microchannel tends to be inertialess because of the small flow length scales, increasing inertia leads to observation of inertial migration of suspended particles (Di Carlo et al. Reference Di Carlo, Edd, Humphry, Stone and Tonner2009), formation of ordered trains of particles (Lee et al. Reference Lee, Amini, Stone and Di Carlo2010; Kahkeshani, Haddadi & Di Carlo Reference Kahkeshani, Haddadi and Di Carlo2016) and depletion of recirculating wakes (Haddadi et al. Reference Haddadi, Shojaei-Zadeh, Connington and Morris2014). Operating a microfluidic device at inertial flow regimes, or inertial microfluidics, has emerged as an approach to a new spectrum of biomedical applications which require high throughputs for collecting large datasets (Gossett et al. Reference Gossett, Tse, Lee, Ying, Lindgren, Yang, Rao, Clark and Di Carlo2012). Hydrodynamic forces which are absent in inertialess, i.e. Stokes, flow such as inertial lift forces (Segré & Silberberg Reference Segré and Silberberg1961, Reference Segré and Silberberg1962), aide in dynamic self-assembly of particles (Lee et al. Reference Lee, Amini, Stone and Di Carlo2010), measurement of cell mechanics (Gossett et al. Reference Gossett, Tse, Lee, Ying, Lindgren, Yang, Rao, Clark and Di Carlo2012) and microscale filtration (Hur et al. Reference Hur, Mach and Di Carlo2011).
In the present work, we study inertial flow of a dilute suspension over confined microcavities in a microchannel and discuss the interaction of particles with the vortical flow inside the cavities. The vortex or recirculating flow inside cavities and indentations are generally categorized under the class of ‘cellular’ flows, with the recirculating flow inside the cavity often referred to as the ‘flow cell’. Flow inside rectangular cavities has always been an interesting fluid dynamics question due to applications in benchmarking computational methods, mixing, heat transfer and fluid–structure interactions (Williams & Baker Reference Williams and Baker1997; Shankar & Deshpande Reference Shankar and Deshpande2000). However, the majority of the works in this area have been related to flow of pure fluids over unconfined or in lid-driven cavities and the dynamics of finite size particles in the recirculating flow region is still an open question. The microchannel–microcavity configuration has been applied in prognostic tools for studying arterial stenosis and aneurysms (Rayz et al. Reference Rayz, Boussel, Lawston, Acevedo-Bolton, Ge, Young, Higashida and Saloner2008); as well as separation of tumour cells from blood samples in a fluidic device by removing the need for sophisticated tomographic imaging techniques (Hur et al. Reference Hur, Mach and Di Carlo2011). In the following sections, we discuss size-dependent entrapment of particles inside cavities, which can be used for developing microscale cell separation platforms, as well as understanding particle-laden flow over cavities, crevices and indentations. Besides, the presence of stable limit cycle orbits demonstrates a distinctive feature of the finite size particles in recirculating flows. In the next section, we discuss the problem in more detail.
2 Problem statement
In this work, we study flow of a dilute suspension of neutrally buoyant microspheres over a confined rectangular cavity using both microfluidic experiments and lattice-Boltzmann simulations. The cavity is connected to a rectangular channel. Due to the effect of inertial lift force inside the channel, particles equilibrate in close proximity to the channel walls (Chun & Ladd Reference Chun and Ladd2006; Di Carlo et al.
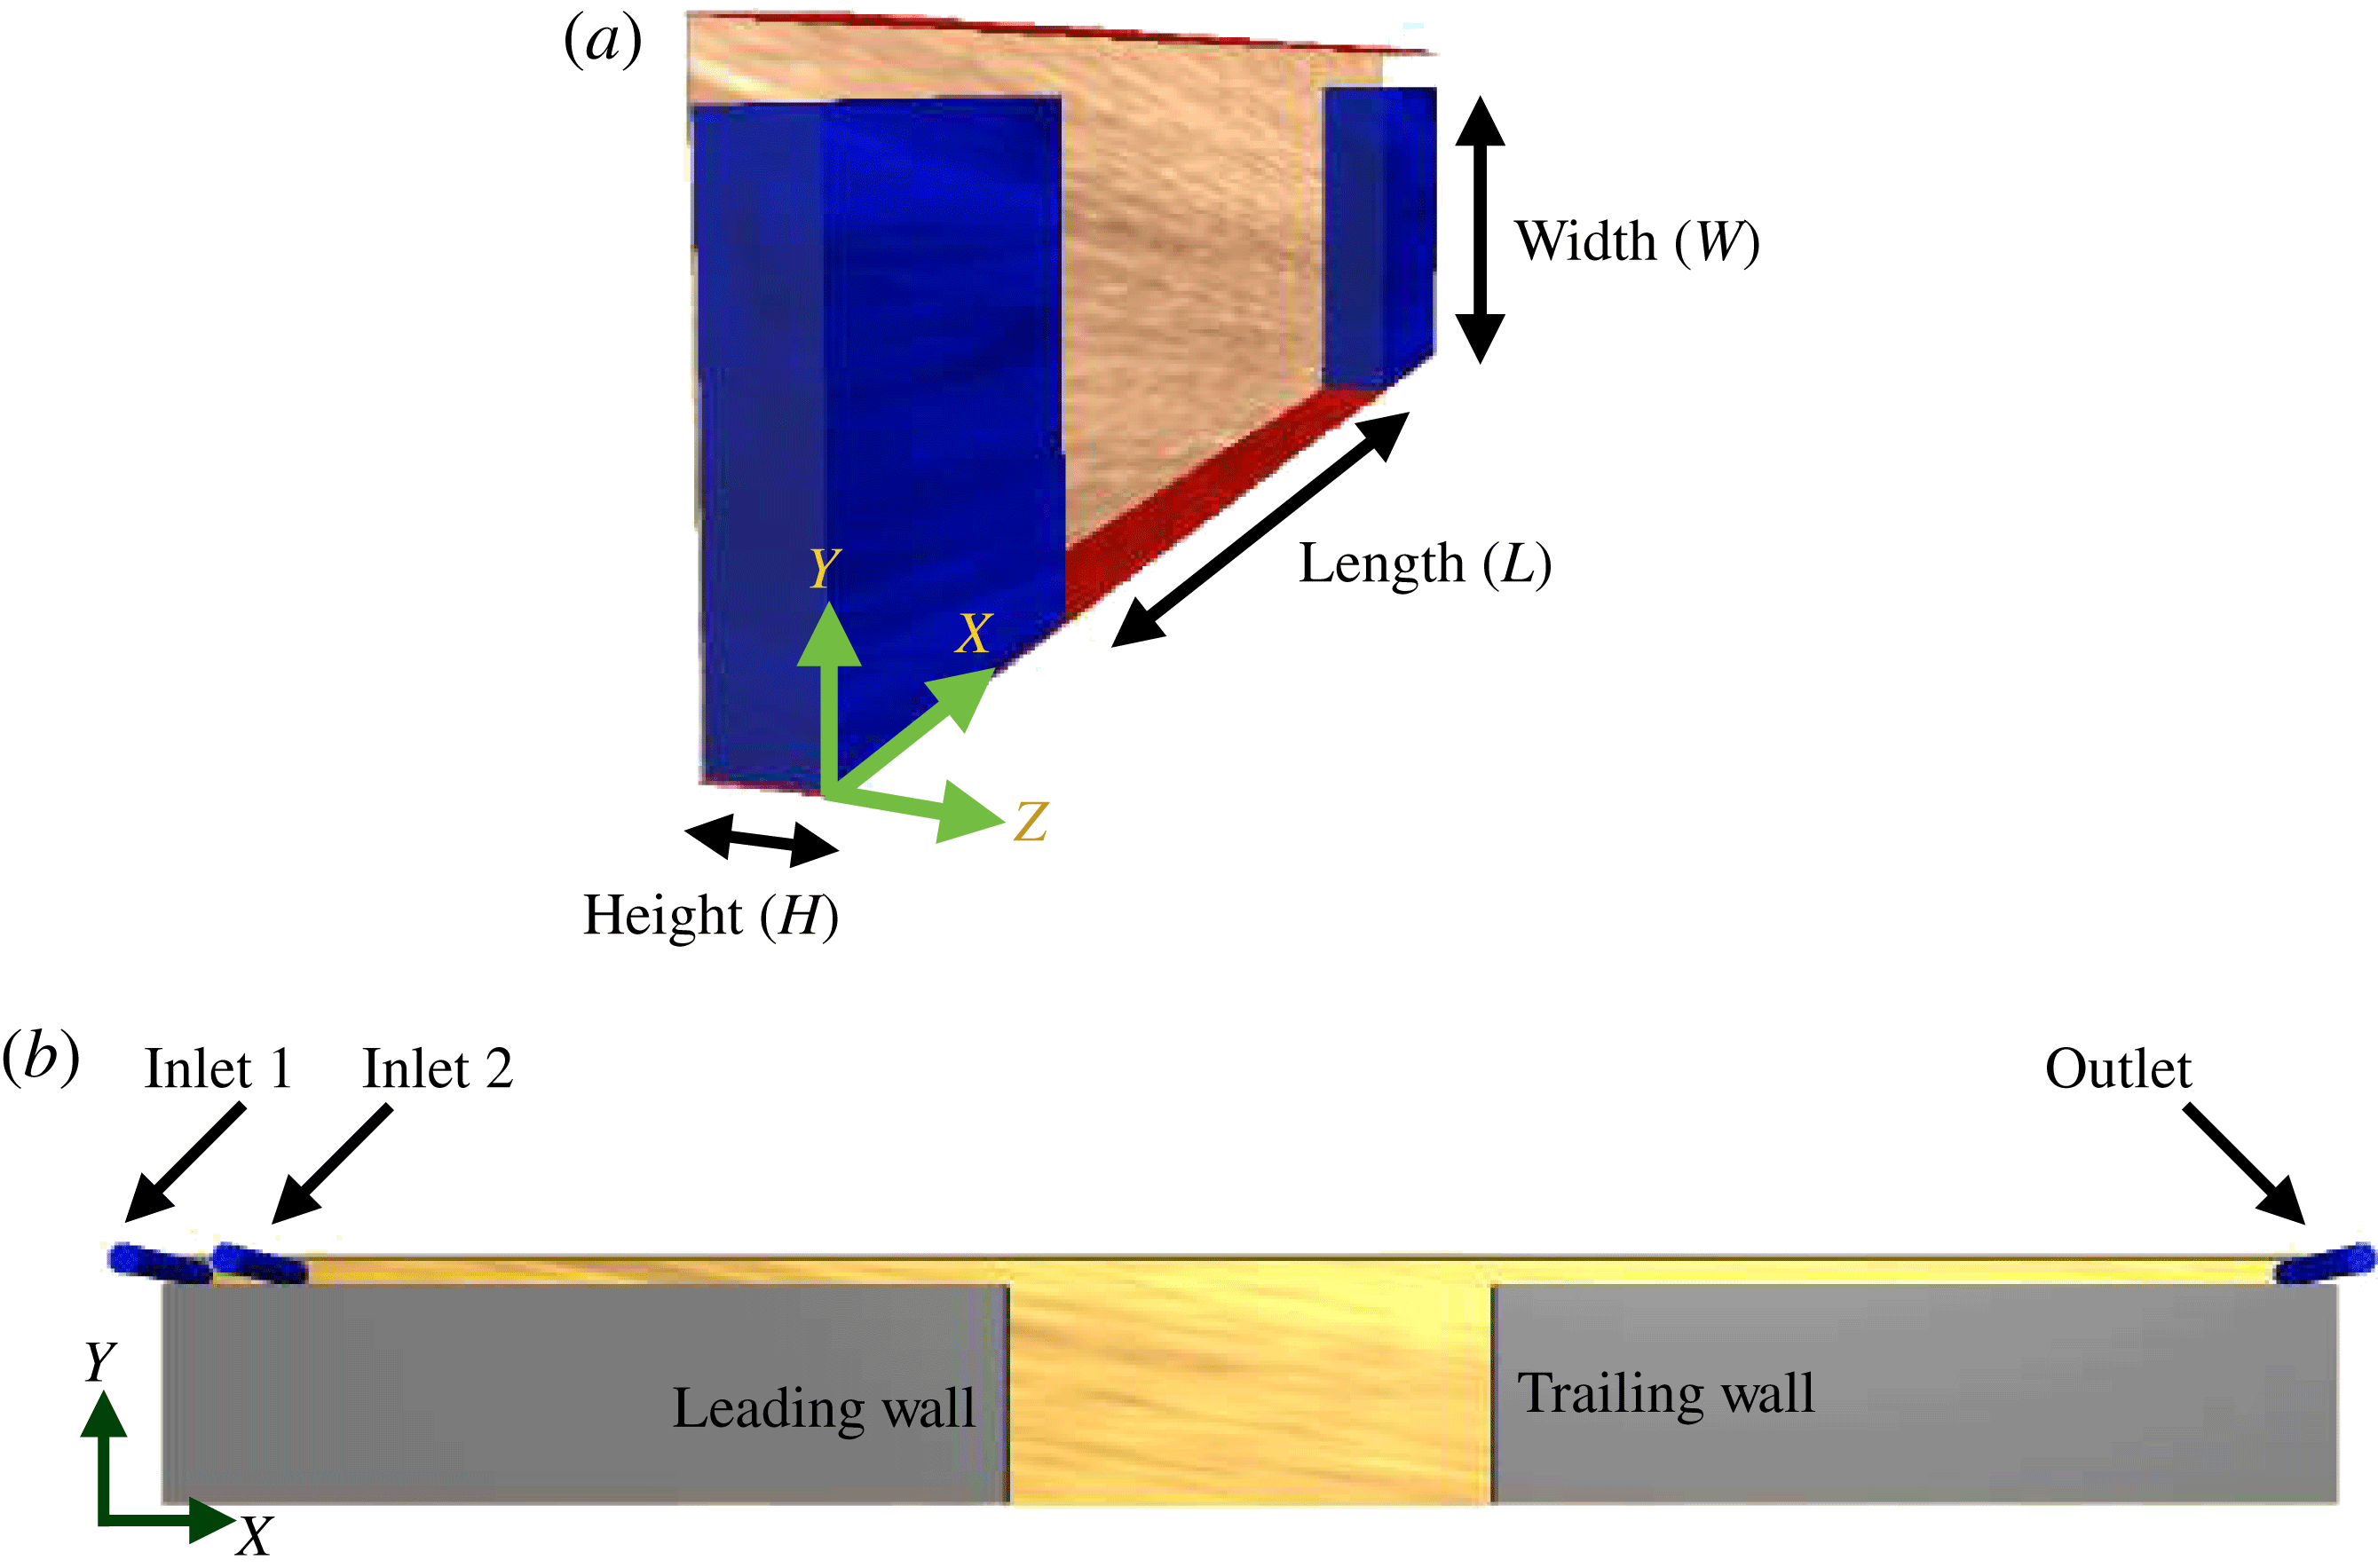
Reference Di Carlo, Edd, Humphry, Stone and Tonner2009). The flow separation at the leading cavity wall leads to formation of a vortex bubble which can entrap particles from the channel (later we explain that ‘vortical flow’ is a precise terminology for the flow inside the cavity). The schematic of the flow geometry and coordinate system are shown in figure 1. Fluid flow and dynamics of suspended particles depend on cavity length, width and height; or cavity size along the
 $X$
,
 $Y$
and
 $Z$
directions respectively. The flow direction in the channel is specified by
 $X$
. The cavity length is abbreviated by
 $L$
, the width by
 $W$
and the height by
 $H$
. The cavity aspect ratio is defined as the ratio of cavity length to width,
 $\unicode[STIX]{x1D706}=L/W$
. Dynamics of particles is also affected by flow inertia. For fluid flow inside a rectangular channel, inertia is represented by
 $Re$
, defined using hydraulic diameter
 $h_{d}$
, average flow velocity
 $\langle u\rangle$
and fluid kinematic viscosity
 $\unicode[STIX]{x1D708}$
as
 $Re=\langle u\rangle h_{d}/\unicode[STIX]{x1D708}$
. The hydraulic diameter is defined using channel cross-sectional area
 $A$
and perimeter
 $P$
as
 $h_{d}=2A/P$
. Other length scales such as the primary direction of the velocity gradient (
 $Y$
) or particle diameter (
 $d$
) can also be used to compute
 $Re$
. In a pressure-driven flow, the shear rate varies inside the channel. Therefore,
 $Re$
at particle length scale can be defined using the average fluid velocity, the channel width
 $C_{Y}$
and particle diameter
 $d$
as
 $Re_{p}=(d/C_{Y})^{2}Re_{y}$
, where
 $Re_{y}=\langle u\rangle C_{Y}/\unicode[STIX]{x1D708}$
(Kahkeshani et al.
Reference Kahkeshani, Haddadi and Di Carlo2016). For the rest of this study, we proceed with the common definition of
 $Re$
for rectangular conduits which is based on
 $h_{d}$
. We emphasize that
 $Re$
characterizes fluid inertia and is distinguished from particle inertia, which is often represented by the Stokes number,
 $St$
. Using particle density
 $\unicode[STIX]{x1D70C}_{p}$
, the fluid density
 $\unicode[STIX]{x1D70C}_{f}$
and
 $Re_{p}$
, the Stokes number can be defined as
 $St=(\unicode[STIX]{x1D70C}_{p}/\unicode[STIX]{x1D70C}_{f})Re_{p}$
. Due to equal densities, neutrally buoyant particles have similar inertia to the fluid, i.e.
 $St=Re_{p}$
. Regardless of geometrical simplicity, it will be discussed that particle entrapment is affected by various factors. Finite size particles deviate from flow streamlines due to flow disturbance. Here, we study the effect of particle size on entrapment and dynamics inside the cavities for finite size particles. A size ratio is defined using the diameter of the particle
 $d$
and the channel width
 $C_{Y}$
, as
 $\unicode[STIX]{x1D6FF}=d/C_{Y}$
. The channel width, or the size of the channel in the
 $Y$
direction, is held constant at
 $C_{Y}=40~\unicode[STIX]{x03BC}\text{m}$
for all experiments.
(a) Microfluidic geometry for studying the interaction of dilute suspensions with the flow cell inside the cavity. Directions of the coordinate system are indicated in the figure. The flow direction is specified by
 $X$
. (b) Two inlets are implemented in the channel entrance in order to infuse the buffer solution and suspension separately: for particle entrapment, buffer solution is infused first to generate the flow cell and the suspension is injected after stoppage of the buffer flow. For depletion studies, the infusion process is reversed.

The cavity size affects the number of entrapped particles. The geometry of an open cavity is similar to a backward facing step followed by a forward facing step, as it is illustrated in figure 1(b), with a primary vortex bubble extending between the leading and trailing cavity walls. We study entry of hard spherical particles into the cavity and follow their dynamics inside the flow cell. Our results add more details to explanations of particle motion inside recirculating flow in a tubular expansion presented by Karino & Goldsmith (Reference Karino and Goldsmith1977), abbreviated to K&G hereafter. Considering that K&G examined the motion of red blood cells, the particle motion was influenced by the deformation and orientation of red blood cells. Significant precision of microfluidic platforms enables us to study the dynamics of isolated particles inside the cavities, as opposed to the experiments of K&G which were affected by particle aggregates. Here, we study motion of neutrally buoyant hard spheres in order to isolate the physics of non-deformable particles and present a more clear interpretation. Shape diversity, size distribution and deformability in a blood mixture prevent a rigorous exploration of particle motion in experiments. Therefore, we only varied the diameter of particles to make progress in studying the particle entry and dynamics in the vortical flow. Studying the flow of deformable particles and capsules has turned into an active research area (Kumar, Rivera & Graham Reference Kumar, Rivera and Graham2014; Kumar & Graham Reference Kumar and Graham2015; Sinha & Graham Reference Sinha and Graham2016) and the motion of deformable human cells in recirculating flows can be the subject of a separate study. We discuss the effect of cavity aspect ratio by changing cavity length and width. We point out in § 7.2 that confinement of the cavity in the
 $Z$
direction induces spiralling fluid flow which can affect particle entrapment. Besides, varying cavity size in the
 $Z$
direction leads to change of the particle distribution inside the channel. Therefore, and to keep the distribution of particles inside the channel identical for all experiments, we only present the effect of
 $\unicode[STIX]{x1D706}$
for devices of the same size in the
 $Z$
direction, i.e.
 $H=70$
(
 $\unicode[STIX]{x03BC}\text{m}$
). More discussion on the effect of confinement in the
 $Z$
direction requires details of the fluid flow and particle distribution inside the channel.
We study flow of dilute suspensions of
 $d=10$
,
 $15$
and
 $20~\unicode[STIX]{x03BC}\text{m}$
particles, corresponding to
 $\unicode[STIX]{x1D6FF}=0.25,0.375$
and
 $0.5$
. The values of
 $\unicode[STIX]{x1D6FF}$
indicate that particle diameters are comparable to the channel width; therefore, disturbance generated by particles is no longer negligible and particles are considered ‘finite size’. The motion of a finite size particle is influenced by hydrodynamic forces of the disturbance flow and can be drastically different from tracers which primarily follow streamlines. For practical applications, such as blood flow in arterial stenosis or aneurysms, or fluidic devices for separation of tumour cells from blood samples, particle size ranges between the size of red blood cells with diameter
 $d\simeq 6{-}8~\unicode[STIX]{x03BC}\text{m}$
, white blood cells with
 $d\simeq 8{-}12~\unicode[STIX]{x03BC}\text{m}$
and cancer cells, which are normally larger than other blood components with
 $d\simeq 10{-}25~\unicode[STIX]{x03BC}\text{m}$
. Our range of particle diameter is close to the size of components in blood flow and microfluidic cell sorting and separation applications; although we present motion patterns which can be extended to any particle size. In this work, we vary flow rate in the range of
 $100{-}1000~\unicode[STIX]{x03BC}\text{L}~\text{min}^{-1}$
corresponding to
 $Re=30{-}308$
. We have scaled all velocities by
 $\langle u\rangle$
which is obtained as the ratio of volumetric flow rate
 $Q$
to the channel cross-sectional area
 $\langle u\rangle =Q/A$
. Further increase of the flow rate leads to large deformation of the polydimethylsiloxane (PDMS) microchannels (Sollier et al.
Reference Sollier, Go, Che, Gossett, O’Byrne, Weaver, Kummer, Rettig, Goldman and Nickols2014) and leakage from inlets. Based on the definition of
 $Re_{p}$
and for
 $d=20~\unicode[STIX]{x03BC}\text{m}$
particles,
 $Re_{p}=5.6{-}56.9$
in the range of flow rates examined in this study. Considering the range of
 $Re_{p}$
, inertial effects should be fully considered in studying particle dynamics. To eliminate the effect of collision induced fluctuations on particle entry (Haddadi et al.
Reference Haddadi, Shojaei-Zadeh and Morris2016), the volumetric fraction of solid phase in suspensions is
 $\unicode[STIX]{x1D719}=0.0001$
. The results remain invariant of
 $\unicode[STIX]{x1D719}$
by testing
 $\unicode[STIX]{x1D719}=0.001$
suspensions.
The manuscript is organized as follows: the experimental procedure is presented in § 3, followed by a brief explanation of the governing equations and computational parameters for discrete particle simulations with the lattice-Boltzmann method in § 4. We begin our discussion by presenting our flow visualization experiments in § 5. Dynamics of an isolated particle inside the cavity and the limit cycle trajectory will be presented in § 6. Then we study flow of a dilute suspension over the cavities in § 7 by discussing particle entry and exit from the cavities and the influence of the limit cycle trajectory on particle entrapment. We conclude the manuscript by our final remarks in § 8.
3 Experimental procedure
The microfluidic device in this study is composed of a single rectangular channel connected to a cavity, which has been fabricated by a standard PDMS replica moulding process (McDonald et al.
Reference McDonald, Duffy, Anderson, Chiu, Wu, Schueller and Whitesides2000). A master mould was fabricated by spin coating SU-8 photoresist (MicroChem) on a silicon substrate followed by exposure through computer-aided design masks. Using the master moulds, the PDMS microchannels were fabricated by casting a Sylgard 184 Elastomer Kit. The inlet and outlets are punched into the PDMS using a pin vise. In order to enclose the channels, the PDMS microfluidic channel is bonded to the glass slide by surface activation of PDMS and glass using oxygen plasma. The final device is annealed in an oven at
 $65\,^{\circ }\text{C}$
for 24 h before use. The error of the fabrication procedure in the
 $X$
and
 $Y$
directions was determined by microscopy. In the
 $Z$
direction, the surface profile of the mould was measured using a Veeco Dektak surface profiler. In all directions, the error of the fabrication process is below
 $1~\unicode[STIX]{x03BC}\text{m}$
.
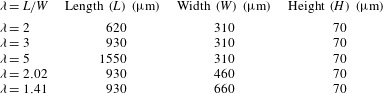
To address the effect of cavity width and length separately, we have fabricated cavities with constant width (
 $W=310~\unicode[STIX]{x03BC}\text{m}$
) and various lengths (
 $L=620{-}1550~\unicode[STIX]{x03BC}\text{m}$
); similarly to study the effect of cavity width we kept the length constant at
 $L=930~\unicode[STIX]{x03BC}\text{m}$
and changed the width of cavities (
 $W=310{-}660~\unicode[STIX]{x03BC}\text{m}$
). Table 1 summarizes device dimensions which are discussed in this work. Herein, we refer to the device aspect ratio
 $\unicode[STIX]{x1D706}$
indicated in this table. All of our results are presented for
 $H=70~\unicode[STIX]{x03BC}\text{m}$
cavities, although we have examined
 $H=45~\unicode[STIX]{x03BC}\text{m}$
devices to study the stable motions inside the cavities. We pointed out before that wall confinement in the
 $Z$
direction or height of the microfluidic device affects particle distribution inside the channel before entrapment into the cavities; therefore, by keeping the device height constant, we only examine the effect of
 $\unicode[STIX]{x1D706}$
on particle entrapment and dynamics.
Dilute suspensions of rigid particles are prepared by dispersing polystyrene spherical particles (Thermo Scientific)
 $(\unicode[STIX]{x1D70C}=1.02~\text{g}~\text{cm}^{-3})$
in a buffer solution composed of deionized water, glycerol (
 $0.08v/v$
) and a minute amount of triton X100 surfactant (Sigma-Aldrich). The density and kinematic viscosity of the buffer solution are
 $\unicode[STIX]{x1D70C}=1.023~\text{g}~\text{cm}^{-3}$
and
 $\unicode[STIX]{x1D708}=1.15\times 10^{-6}~\text{m}^{2}~\text{s}^{-1}$
respectively. The initial fraction of the solid particles in the suspension supplied by the manufacturer is
 $0.01v/v$
. To prepare dilute suspensions,
 $20~\unicode[STIX]{x03BC}\text{L}$
of suspension is dispersed in 40 mL of buffer solution using vortex mixing. In order to conduct flow visualization experiments,
 $40~\unicode[STIX]{x03BC}\text{L}$
of a dilute suspension of
 $1~\unicode[STIX]{x03BC}\text{m}$
fluorescent polystyrene tracers, with initial solid fraction of
 $0.01v/v$
is dispersed in 40 mL of buffer solution. Solutions are infused into microchannels using a Harvard PHD 2000 syringe pump. We have utilized high-speed and fluorescent microscopy imaging to study interaction of particles with the vortex inside the cavity. The imaging details will be explained in the following sections.
Microfluidic devices used for investigation of particle interaction with the flow cell. We refer to the device aspect ratio
 $\unicode[STIX]{x1D706}=L/W$
in this work. Length, width and height are cavity dimensions along the
 $X$
,
 $Y$
and
 $Z$
directions respectively.

4 Governing equations and computational method
We present a brief description of governing equations and the lattice-Boltzmann method (LBM) for hard sphere suspensions. We refer to the background articles stated in the following for more details of the computational method. The LBM is developed for hard spherical particles dispersed in a Newtonian fluid. The governing equations of the fluid phase in dimensionless form are
 $$\begin{eqnarray}\displaystyle & \displaystyle \unicode[STIX]{x1D735}\boldsymbol{\cdot }\boldsymbol{u}=0, & \displaystyle\end{eqnarray}$$
 $$\begin{eqnarray}\displaystyle & \displaystyle Re\left(\frac{\unicode[STIX]{x2202}\boldsymbol{u}}{\unicode[STIX]{x2202}t}+\boldsymbol{u}\boldsymbol{\cdot }\unicode[STIX]{x1D735}\boldsymbol{u}\right)=-\unicode[STIX]{x1D735}p+\unicode[STIX]{x1D735}^{2}\boldsymbol{u}, & \displaystyle\end{eqnarray}$$
 $h_{d}$
, velocity by
 $\langle u\rangle$
and pressure by
 $\unicode[STIX]{x1D702}\langle u\rangle /h_{d}$
, where
 $\unicode[STIX]{x1D702}$
is dynamic viscosity of the fluid. Newtonian dynamics governs the motion of particles. The translational (
 $\boldsymbol{V}_{i}$
) and rotational (
 $\unicode[STIX]{x1D734}_{i}$
) velocities of particles are calculated from
 $$\begin{eqnarray}\displaystyle & \displaystyle \boldsymbol{F}_{i}=m_{i}\frac{\text{d}\boldsymbol{V}_{i}}{\text{d}t} & \displaystyle\end{eqnarray}$$
 $$\begin{eqnarray}\displaystyle & \displaystyle \boldsymbol{T}_{i}=I_{i}\frac{\text{d}\unicode[STIX]{x1D734}_{i}}{\text{d}t}, & \displaystyle\end{eqnarray}$$
 $\boldsymbol{F}_{i}$
and
 $\boldsymbol{T}_{i}$
are force and torque on particle
 $i$
, which has mass
 $m_{i}$
and moment of inertia
 $I_{i}$
.
The LBM model for hard sphere suspensions was developed by Ladd (Reference Ladd1994a ,Reference Ladd b ), with further modifications by Aidun, Lu & Ding (Reference Aidun, Lu and Ding1998) for dynamics of moving particles with arbitrary densities. The hard sphere LBM is based on a discrete Boltzmann equation on Cartesian grids coupled with Newtonian dynamics for the motion of particles. Theoretical details of the LBM model used in this work have been discussed in Ladd (Reference Ladd1994a ,Reference Ladd b ) and in a review article by Aidun & Clausen (Reference Aidun and Clausen2010). The method has been successfully utilized for computing rheological properties of suspensions (Haddadi & Morris Reference Haddadi and Morris2014) and studying the effect of inertia at bulk flow, such as flow of suspensions around square and circular cylinders (Haddadi et al. Reference Haddadi, Shojaei-Zadeh, Connington and Morris2014, Reference Haddadi, Shojaei-Zadeh and Morris2016).
In flow of a dilute suspension over and inside an open cavity, particles may collide with one another and with cavity walls. Therefore, particle motion at small separations from solid walls should be resolved using hydrodynamic lubrication and collision forces. Lubrication force at small gaps between solid surfaces has been implemented by construction of the grand resistance matrix for lubrication interaction between a spherical particle and a plane wall, based on the assumption that fluid flow at small gaps is inertialess (Nguyen & Ladd Reference Nguyen and Ladd2002). However, the hydrodynamic lubrication force does not prevent overlap between solid surfaces, especially for collision of the spherical particle with the walls and particle–corner collisions at high inertia. Various methods have been employed to resolve motion of particles at small surface separations (Ardekani & Rangel Reference Ardekani and Rangel2008). In Haddadi et al. (Reference Haddadi, Shojaei-Zadeh and Morris2016) a model based on a combination of lubrication force and elastic collision has been discussed for computing the particle motion at small gaps between solid surfaces, especially collision of a spherical particle with a sharp corner. According to this model the gap between solid surfaces is defined as
 $h$
and lubrication force governs the motion of particles for separations smaller than a lubrication cutoff, defined as
 $h_{N}=0.0015{-}0.05d$
, depending on the kinematic viscosity. For particle overlap defined as
 $h\leqslant 7.5\times 10^{-7}$
, an elastic collision force governs motion of particles.
Further details of the computational method are discussed in Haddadi et al. (Reference Haddadi, Shojaei-Zadeh and Morris2016). We have utilized the same tool in the present study and we refer to the mentioned article for further explanations. The confined cavity geometry is implemented by placement of two rectangular objects inside the computational box. The axial flow is along the
 $X$
direction and the box is bounded by walls in the
 $Y$
and
 $Z$
directions. The computational box is periodic along the
 $X$
direction. The majority of numerical simulations in our work are presented for
 $\unicode[STIX]{x1D706}=3$
cavities, with sizes
 $930\times 310\times 70~\unicode[STIX]{x03BC}\text{m}$
along the
 $X$
,
 $Y$
and
 $Z$
directions, respectively. The numerical simulations for the
 $\unicode[STIX]{x1D706}=3$
cavity are conducted in a computational box of
 $768\times 176\times 35$
lattice units (l.u.) along the
 $X$
,
 $Y$
and
 $Z$
directions. The results are invariant of resolution by repeating simulations in a larger
 $1536\times 352\times 70$
l.u. domain. By placing rectangular blocks in a
 $768\times 176\times 35$
l.u. domain, the leading cavity wall is located 150 l.u. from the inlet. Similarly, the trailing wall is symmetrically placed 150 l.u. away from the outlet. To simulate the motion of
 $20~\unicode[STIX]{x03BC}\text{m}$
particles, the particle resolution is chosen to be
 $10.08$
lattice units per diameter of particle (l.u.
 $/d$
) in a
 $768\times 176\times 35$
l.u. domain.
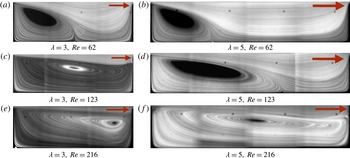
Fluid streamlines inside
 $\unicode[STIX]{x1D706}=3$
and
 $\unicode[STIX]{x1D706}=5$
cavities, with lengths
 $L=930$
and
 $1550~\unicode[STIX]{x03BC}\text{m}$
, at various
 $Re$
. The arrows specify direction of the flow (
 $X$
). Other dimensions of the cavities, i.e. width (
 $Y$
) and height (
 $Z$
), are identical (
 $W=310$
and
 $H=70~\unicode[STIX]{x03BC}\text{m}$
). Size details of the cavities are indicated in table 1. Forming a complete flow cell inside a longer cavity requires higher
 $Re$
.

5 Fluid flow over confined cavities
In this section we present images of fluorescent tracers in order to discuss fluid streamlines in the cavities. We demonstrate that vortex morphology depends on cavity size and
 $Re$
. The flow of tracer suspension is monitored using a Nikon Ti eclipse microscope and a Phantom v2010 camera. Depending on the flow rate, the exposure time changes from
 $1$
to 5 s, with higher exposure for higher flow rates. Due to their small size compared to the cavity width or length (
 ${\sim}O(0.001)$
), fluorescent tracers generate negligible flow disturbance and follow the fluid streamlines. For the cavities in the present study, distribution of tracers are visualized in great detail by taking magnified snapshots from multiple subregions and joining images to construct the whole picture of flow in the cavity. Flow of Newtonian fluids inside the cavity has always been a question of great scientific and technological interest. Despite its simple geometry, the flow inside a cavity can manifest various phenomena; such as corner eddies in Stokes flow (Moffatt Reference Moffatt1964) and vortical flows in turbulence (Citro et al.
Reference Citro, Giannetti, Brandt and Luchini2015). Here we present the longitudinal extent of the flow cell inside the cavity. It is pointed out that the fluorescent imaging illustrates the flow morphology within a finite depth of field inside the cavity. The depth of field depends on the objective lens magnification and is within
 $\pm 5.8~\unicode[STIX]{x03BC}\text{m}$
from the object plane. We explain more details of the streamlines in § 7 and discuss the effect of wall confinement on formation of spiralling fluid flow. As was stated earlier, ‘vortical flow’, rather than recirculation, is a more precise terminology for the flow cell inside the wall-confined cavity.
We compare streamlines for different size cavities for a wide range of
 $Re$
. The influence of length on morphology of the flow cell is discussed first. Figure 2 displays streamlines inside
 $\unicode[STIX]{x1D706}=3$
and
 $5$
cavities. It is reminded that the width and height of cavities are identical, i.e.
 $W=310$
and
 $H=70~\unicode[STIX]{x03BC}\text{m}$
(table 1). The streamlines are compared for
 $Re=62$
,
 $123$
and
 $216$
for both cavities. At
 $Re=62$
, an incomplete flow cell forms in both
 $\unicode[STIX]{x1D706}=3$
and
 $5$
cavities. The incomplete flow cell denotes a triangular vortex bubble extending to a portion of the cavity length. With increasing
 $Re$
, the length of the vortex progressively increases until the vortex reaches the trailing wall. A vortex covering the full cavity length is termed a complete flow cell. Higher
 $Re$
is required to generate a complete flow cell for a longer cavity. By further increase of
 $Re$
to
 $216$
, the vortex core in the
 $\unicode[STIX]{x1D706}=3$
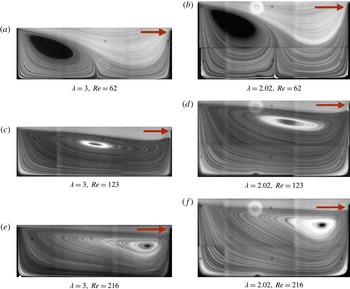
cavity approaches closer to the trailing cavity wall. The vortex core is a qualitative definition for the central zone of the vortex where tracers move in small orbits. In figure 3, we present streamlines for
 $\unicode[STIX]{x1D706}=3$
and
 $\unicode[STIX]{x1D706}=2.02$
cavities to compare the effect of cavity width on fluid flow at identical lengths and heights of
 $L=930$
and
 $H=70~\unicode[STIX]{x03BC}\text{m}$
. At each
 $Re$
, the location of the vortex core along the flow direction
 $X$
is relatively the same for cavities with different width.
Fluid streamlines inside
 $\unicode[STIX]{x1D706}=3$
and
 $\unicode[STIX]{x1D706}=2.02$
devices, showing the fluid flow inside
 $W=310$
and
 $460~\unicode[STIX]{x03BC}\text{m}$
cavities. The length and height of both cavities is identical, i.e.
 $L=930~\unicode[STIX]{x03BC}\text{m}$
and
 $70~\unicode[STIX]{x03BC}\text{m}$
respectively. The streamlines are compared for
 $Re=62$
,
 $123$
and
 $216$
. The arrows indicate the flow direction inside the channel.

6 Dynamics of an isolated finite size particle inside the cavity
In this section, we present microfluidic measurements of the isolated particle dynamics inside the cavity. The LBM simulations are also utilized to study aspects of particle motion. We demonstrate that an isolated finite size particle forms a stable ‘limit cycle’ trajectory inside the cavity and discuss the topology of the limit cycle for different size cavities for various
 $Re$
. By referring to the equation of motion of a finite size particle, it is discussed that formation of the limit cycle is a distinct feature of finite size particles; considering that a finite size particle is affected by hydrodynamic contributions to the particle force that are negligible for tracers.
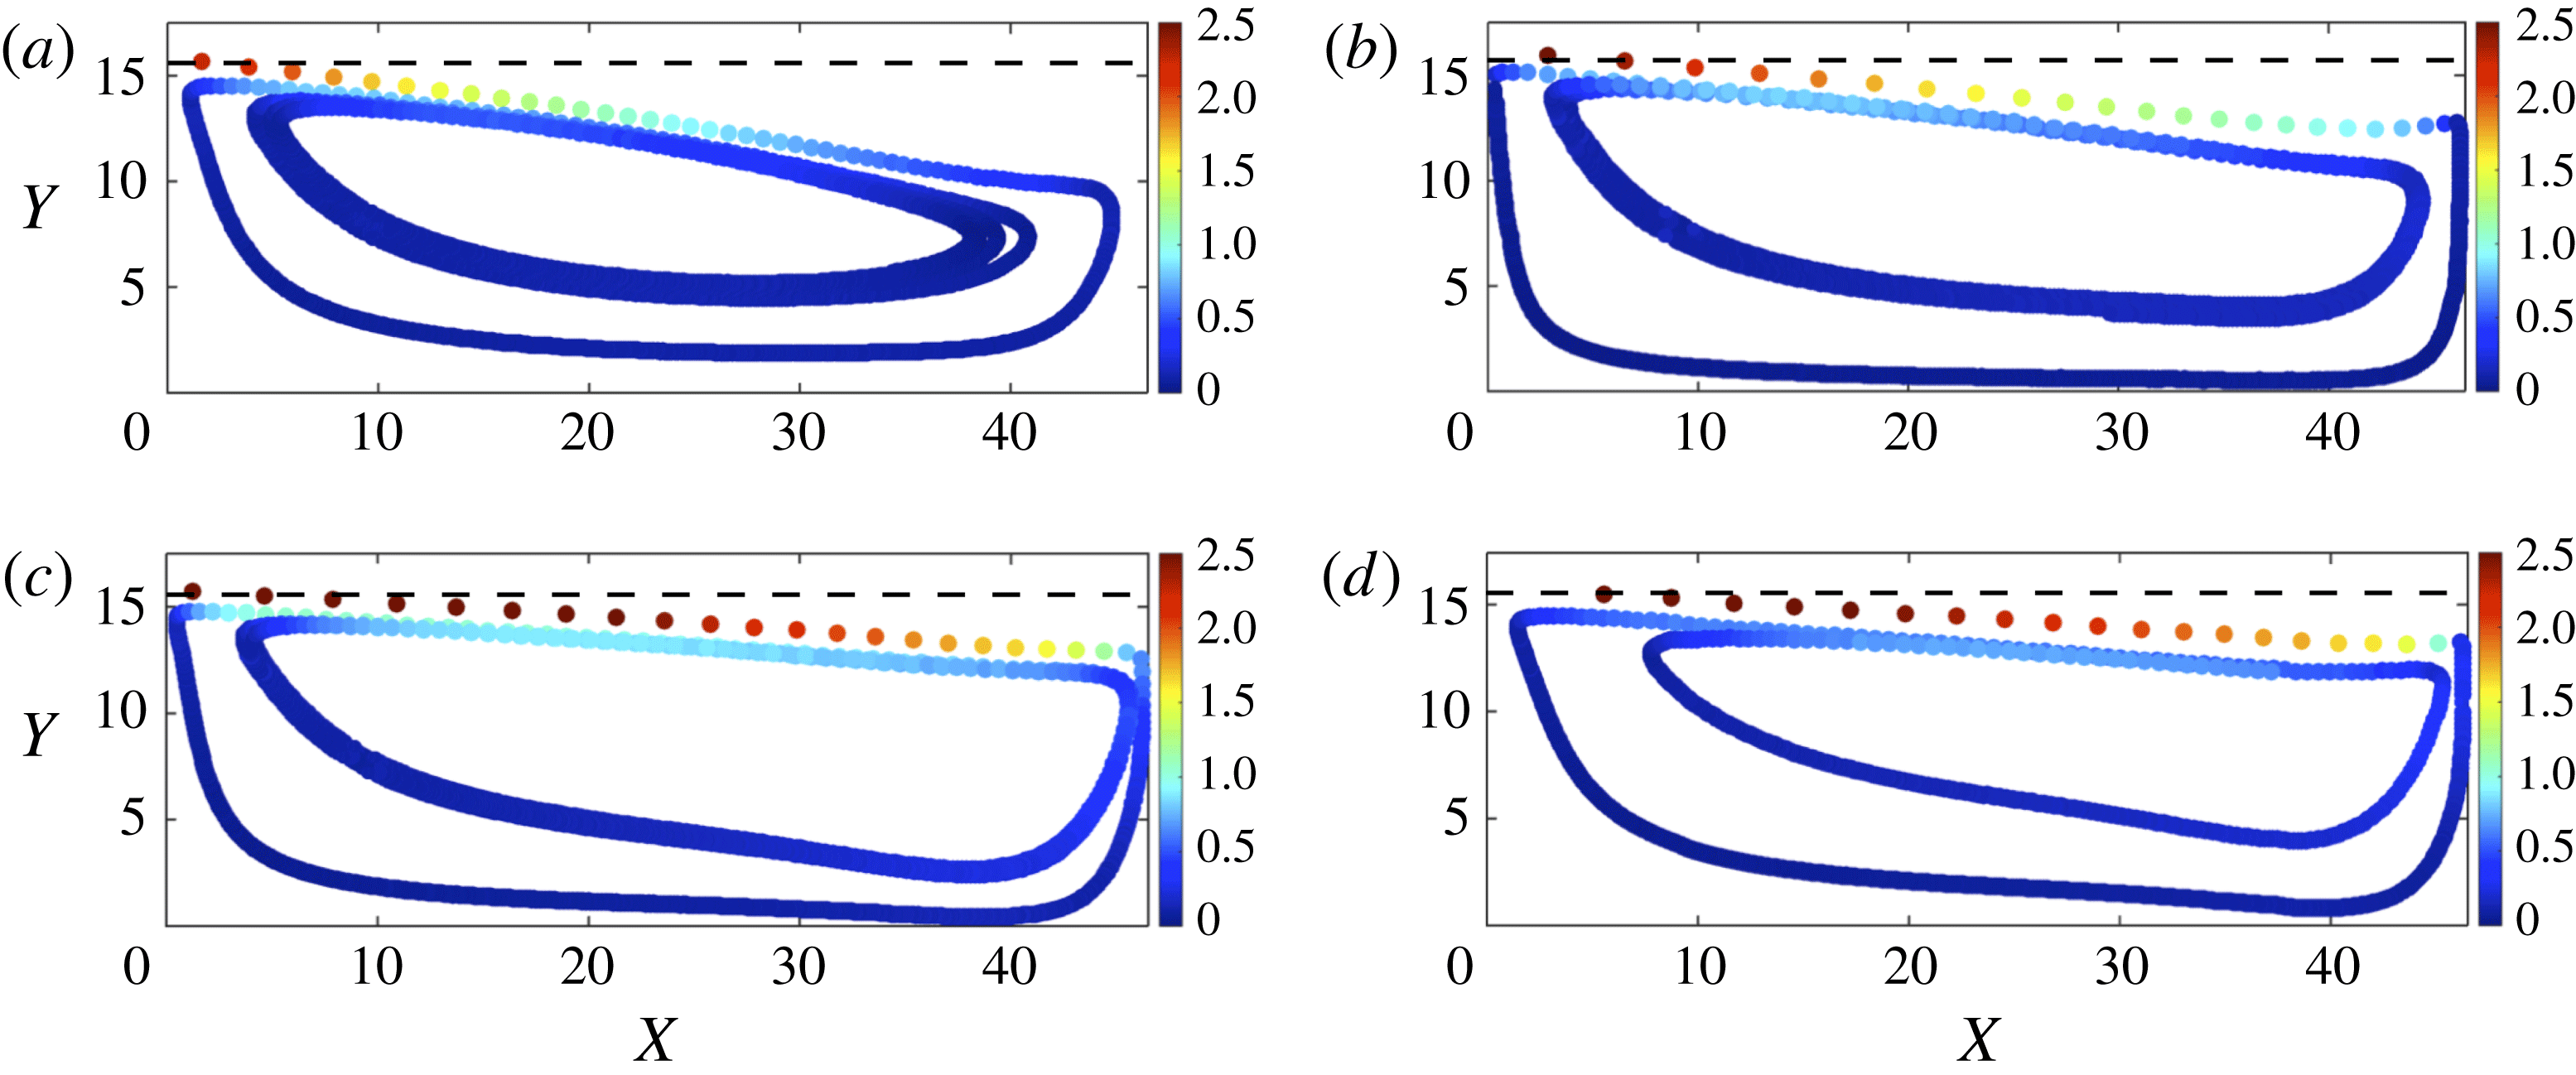
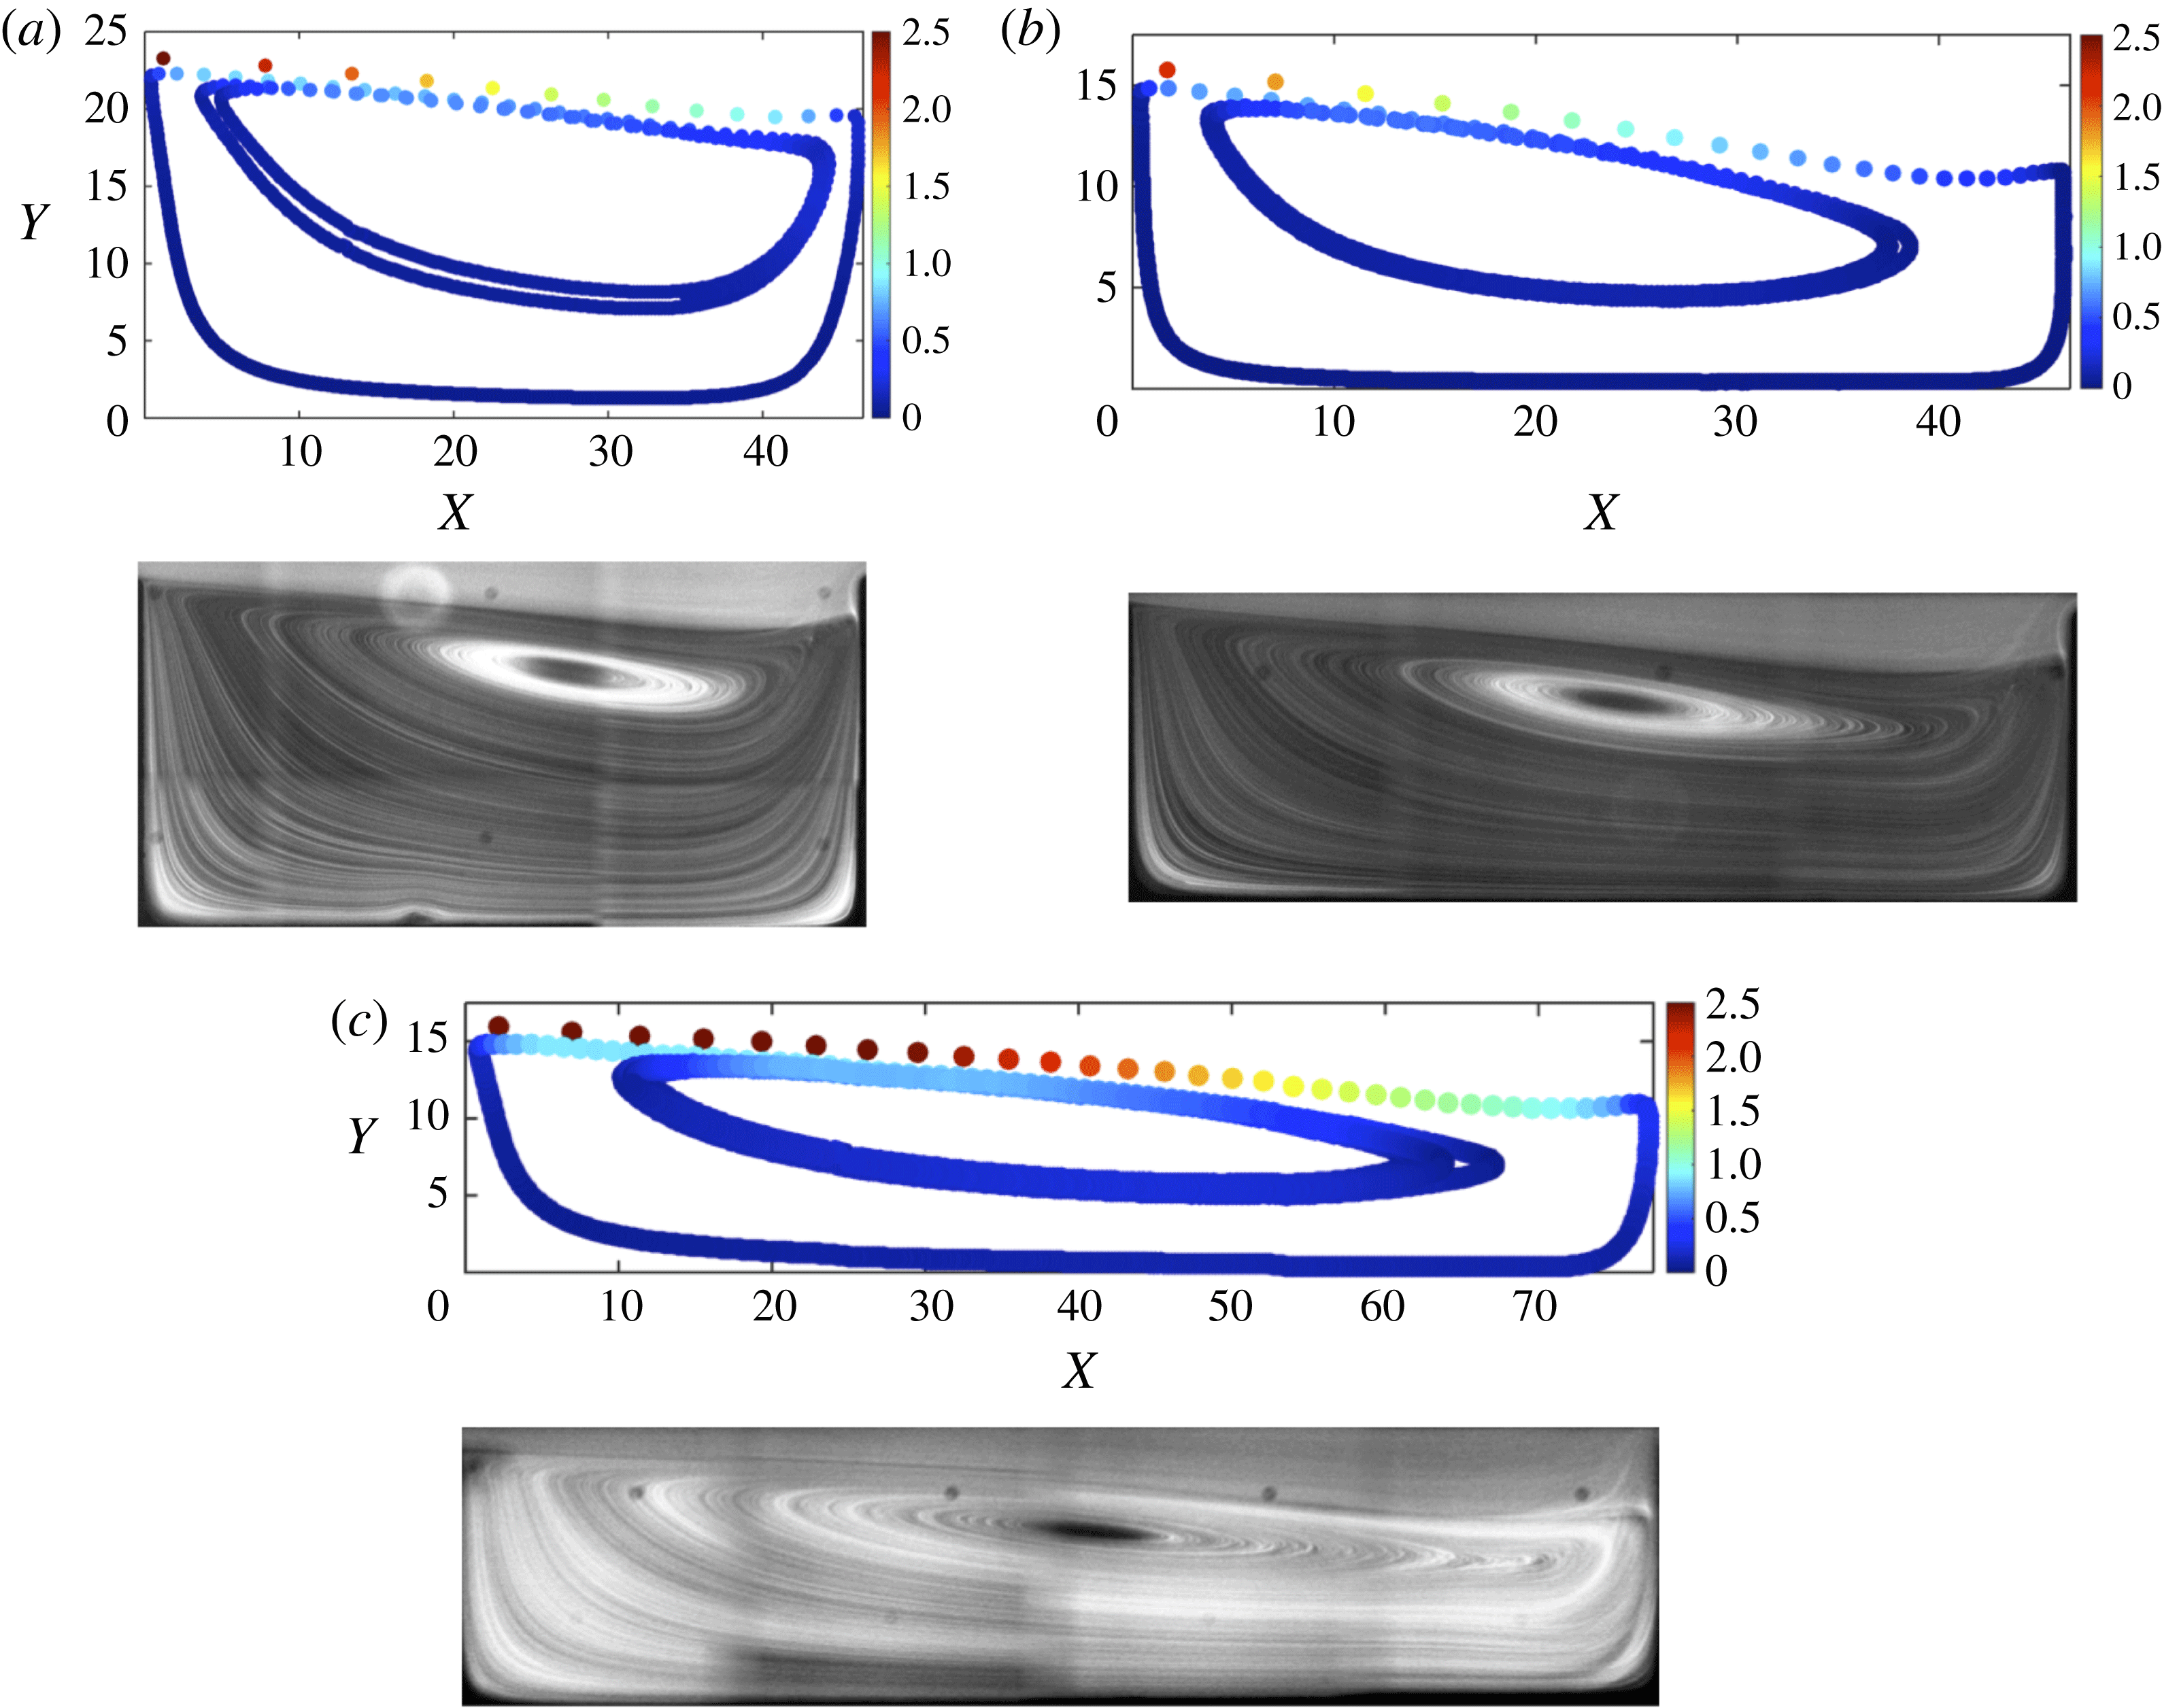
Experimental trajectory of an isolated particle inside
 $\unicode[STIX]{x1D706}=3$
(a,b),
 $2.02$
(c,d) and
 $5$
(e,f) cavities at
 $Re=123$
and
 $216$
. The cavity size is made dimensionless using the diameter of the large, i.e.
 $d=20~\unicode[STIX]{x03BC}\text{m}$
, particle as the length scale. The colour bar specifies the particle velocity scaled by the average flow velocity inside the channel
 $\langle u\rangle$
.

Motion of an isolated particle inside the cavity is studied by analysis of high-speed camera recordings of a Nikon eclipse Ti7 microscope and a Phantom v711 high-speed camera. To compute the trajectory of an isolated particle in the cavity, a dilute suspension (
 $\unicode[STIX]{x1D719}\sim O(10^{-4})$
) is infused into the microchannel. Subsequently after entrapment of one particle, which can be monitored in real time imaging, infusion of the suspension is stopped. The vortex inside the cavity is maintained by flow of the buffer solution from the second inlet after stoppage of the suspension flow. Motion of the particle is monitored over a long time span of 10 min and is recorded every 1 min. Each video contains a stack of images recorded in a time span of 4 s, at rates of
 $4000$
,
 $5000$
or
 $6000$
frames per second (f.p.s.), depending on
 $Re$
(higher frame rate for higher
 $Re$
). The particle trajectory is later computed by image analysis using a Hough transformation algorithm to track centre of mass location of the particle.
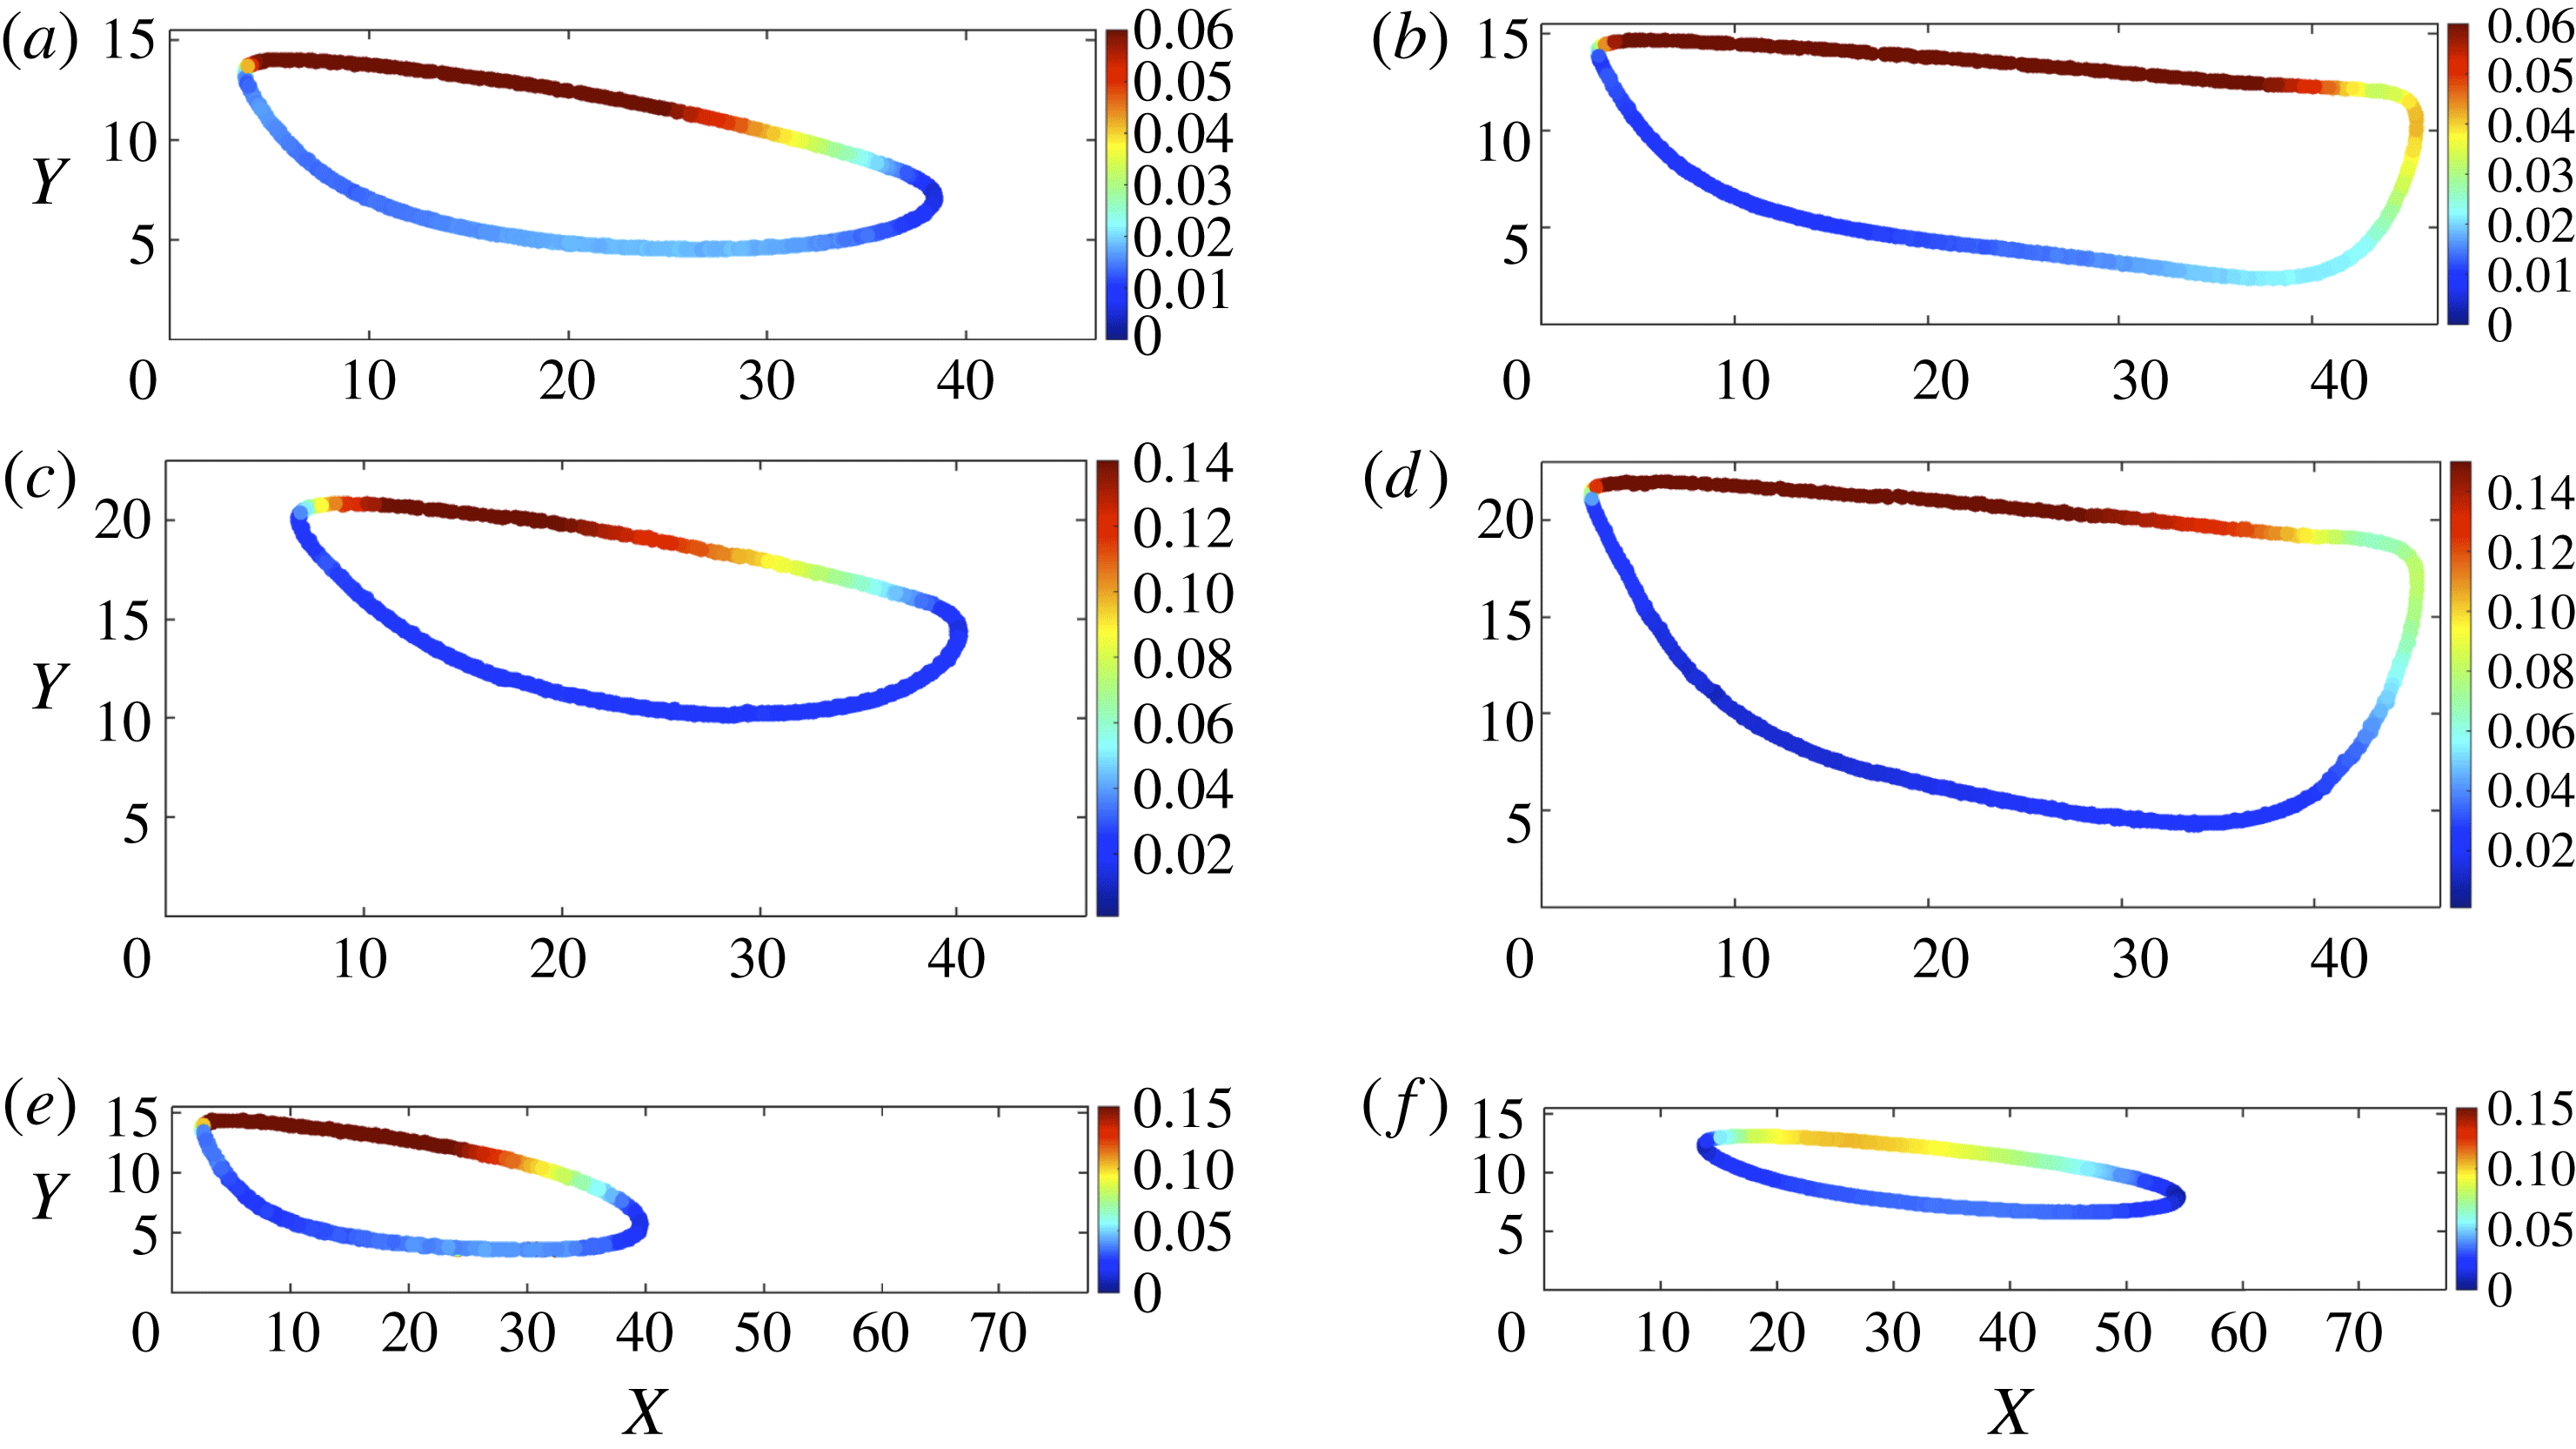
We present the topology of particle trajectories for
 $\unicode[STIX]{x1D706}=3$
,
 $\unicode[STIX]{x1D706}=2.02$
and
 $\unicode[STIX]{x1D706}=5$
cavities in figure 4. The cavity size is made dimensionless by the diameter of the largest particle, i.e.
 $d=20~\unicode[STIX]{x03BC}\text{m}$
. The colour bar specifies the particle velocity, which is scaled by the average flow velocity in the channel
 $\langle u\rangle$
. An isolated finite size particle orbits on a stable trajectory without deviation. The particle accelerates and decelerates as it traces its stable orbit. Due to the large magnitude of axial flow velocity inside the channel, the particle velocity increases as it moves forward in close proximity of the channel stream. The particle velocity is lower near the bottom wall of the cavity. Changing cavity size or
 $Re$
alters the fluid flow and consequently results in change of the limit cycle topology.
Stable motion of an isolated particle on a closed orbit implies formation of a limit cycle trajectory. The time scale of one complete orbit on the stable orbit
 $t^{\ast }$
depends on
 $\unicode[STIX]{x1D706}$
and
 $Re$
. For instance, in a
 $\unicode[STIX]{x1D706}=3$
cavity, the time scale of one complete orbit at
 $Re=154$
is
 $t^{\ast }=0.009$
s. Therefore, in a time span of 10 min, the particle completes at least
 $66\,000$
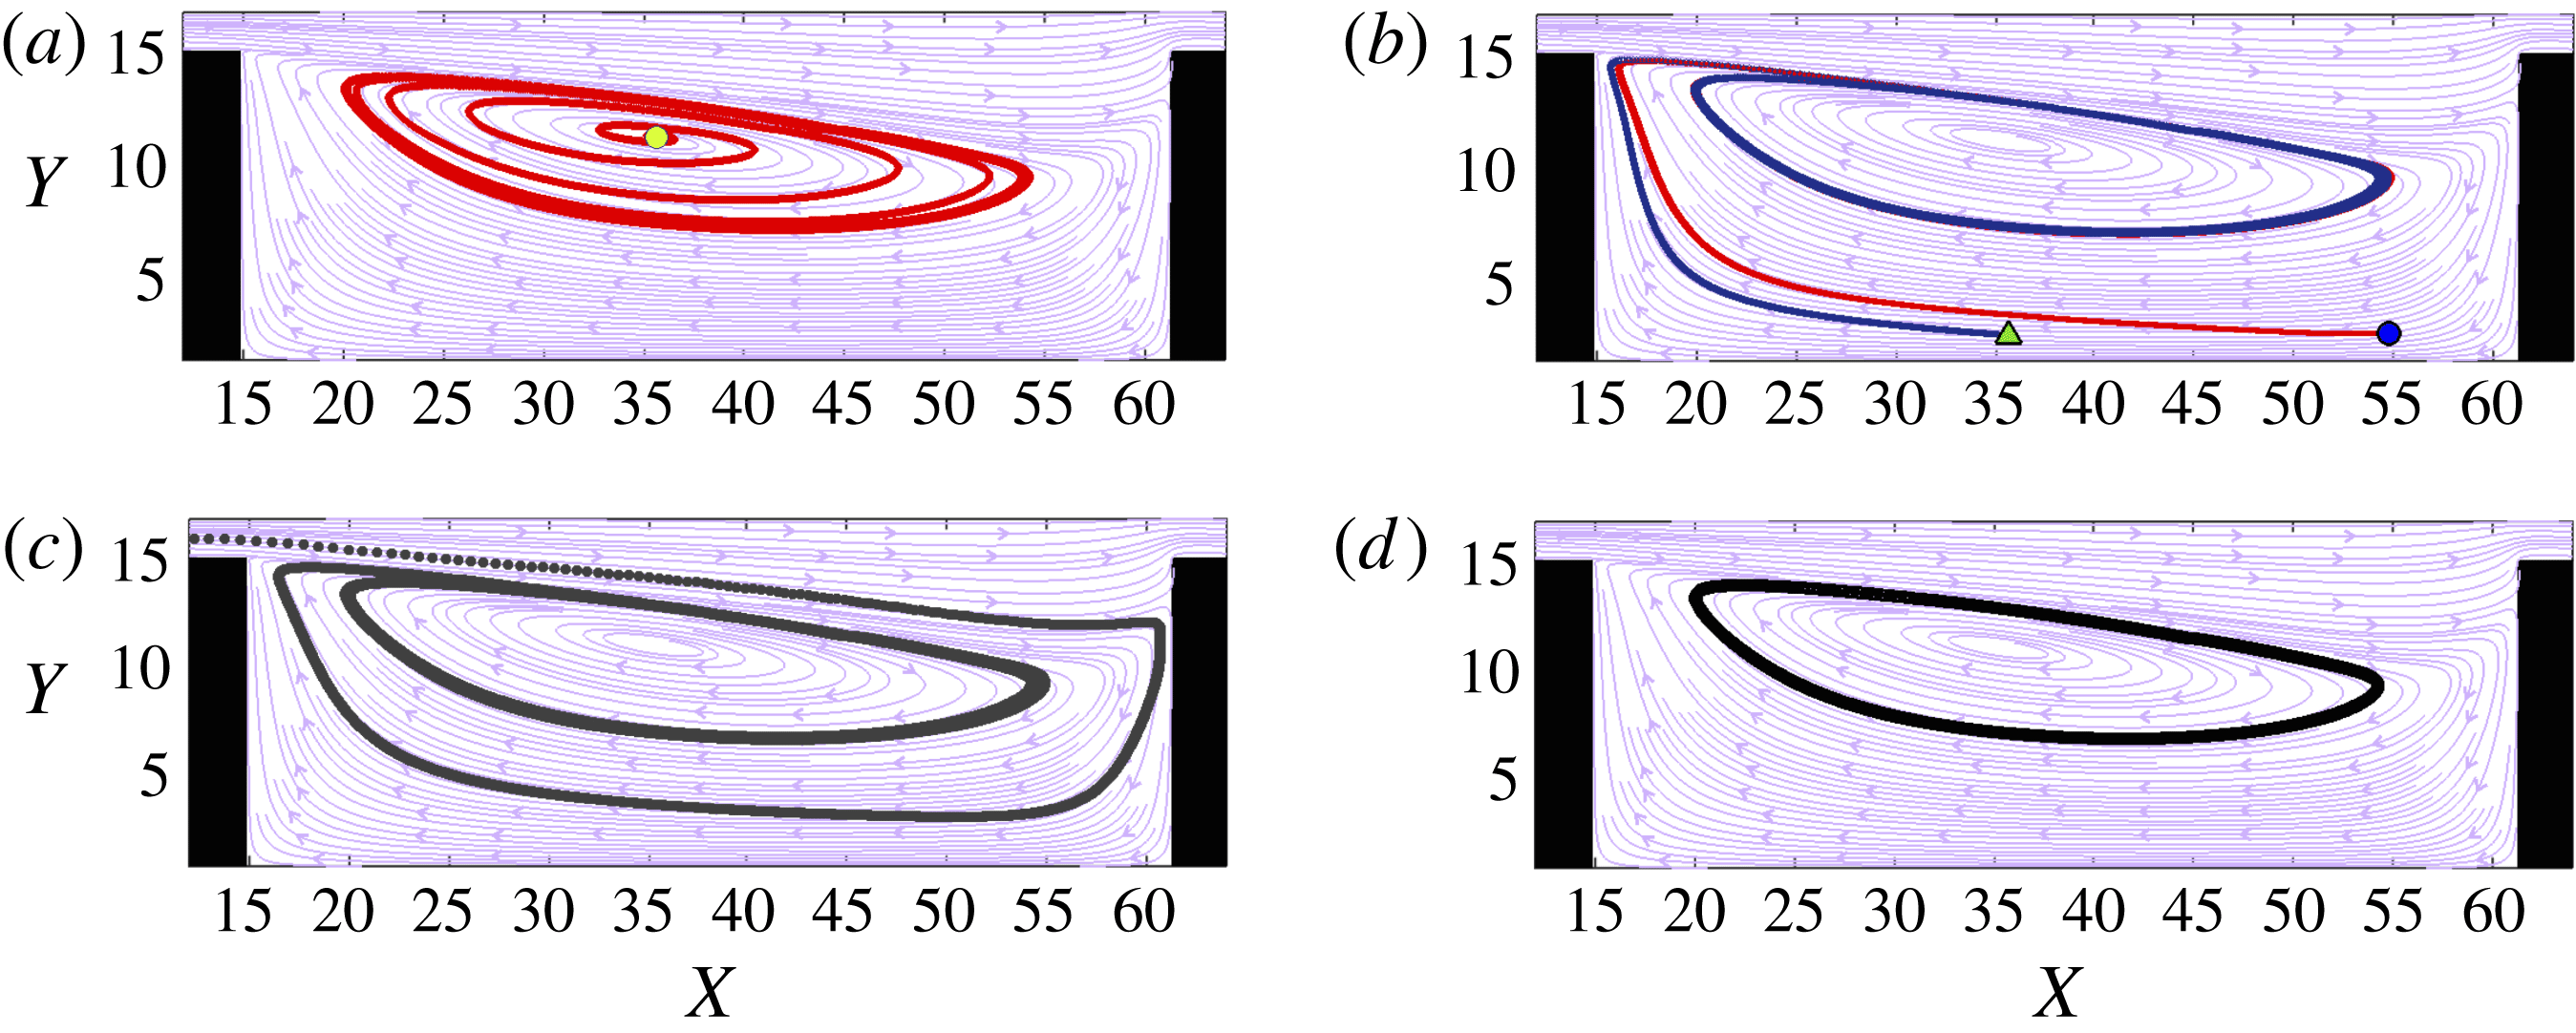
orbits without deviation. However, it can also be argued that the stable motion is observed within the limited time span of the experiment and in sufficiently long times, the particle may continue its outward motion and exit the cavity; or move towards other orbits inside the cavity. We have utilized lattice-Boltzmann simulations to corroborate the presence of a unique limit cycle orbit inside the cavities. The limit cycle is a trajectory attractor with a basin of attraction extending in both interior and exterior regions of the limit cycle. Trajectories in the interior zone spiral outward and exterior trajectories spiral inward to approach the limit cycle. Therefore, the limit cycle defines a bound for outward and inward spiralling motions. Further spiralling motion of trajectories beyond the limit cycle orbit leads to overlap of inward and outward spirals, which is not permitted by the mass conservation principle.
Simulations of spiralling motion of (a) interior and (b) exterior trajectories of a
 $d=10.08$
(l.u.) particle towards the limit cycle orbit at
 $Re=123$
inside a
 $\unicode[STIX]{x1D706}=3$
cavity. (c) The basin of attraction extends to the channel, considering that a particle that enters the cavity spirals toward the limit cycle trajectory. (d) The LBM simulation of the limit cycle trajectory at
 $Re=123$
. In the background, the fluid streamlines at
 $z=1.73$
plane are exhibited. The fluorescent image of flow for
 $Re=123$
is displayed in figure 2(c). The symbols in (a,b) show the location of the initial point.

Numerical simulations are conducted by releasing an isolated particle from various initial locations inside the cavity after reaching a steady flow. We present the LBM simulations of particle trajectories at
 $Re=123$
. The fluid streamlines and the limit cycle topology of microchannel experiments at
 $Re=123$
are shown in figures 2(c) and 4(a) respectively. As shown in figure 5(a), a particle released from the interior region (closer to the core of the vortex) spirals outward to reach the limit cycle motion. Exterior trajectories spiral inward towards the limit cycle, as exhibited in figure 5(b). Considering that particles can also enter the cavity from the channel and approach the stable orbit, the basin of attraction of a limit cycle extends outside the cavity and into the channel. As seen in figure 5(c), a particle moving inside the channel enters the cavity and reaches a stable motion on the limit cycle trajectory. We later discuss conditions of particle entry into the cavities.
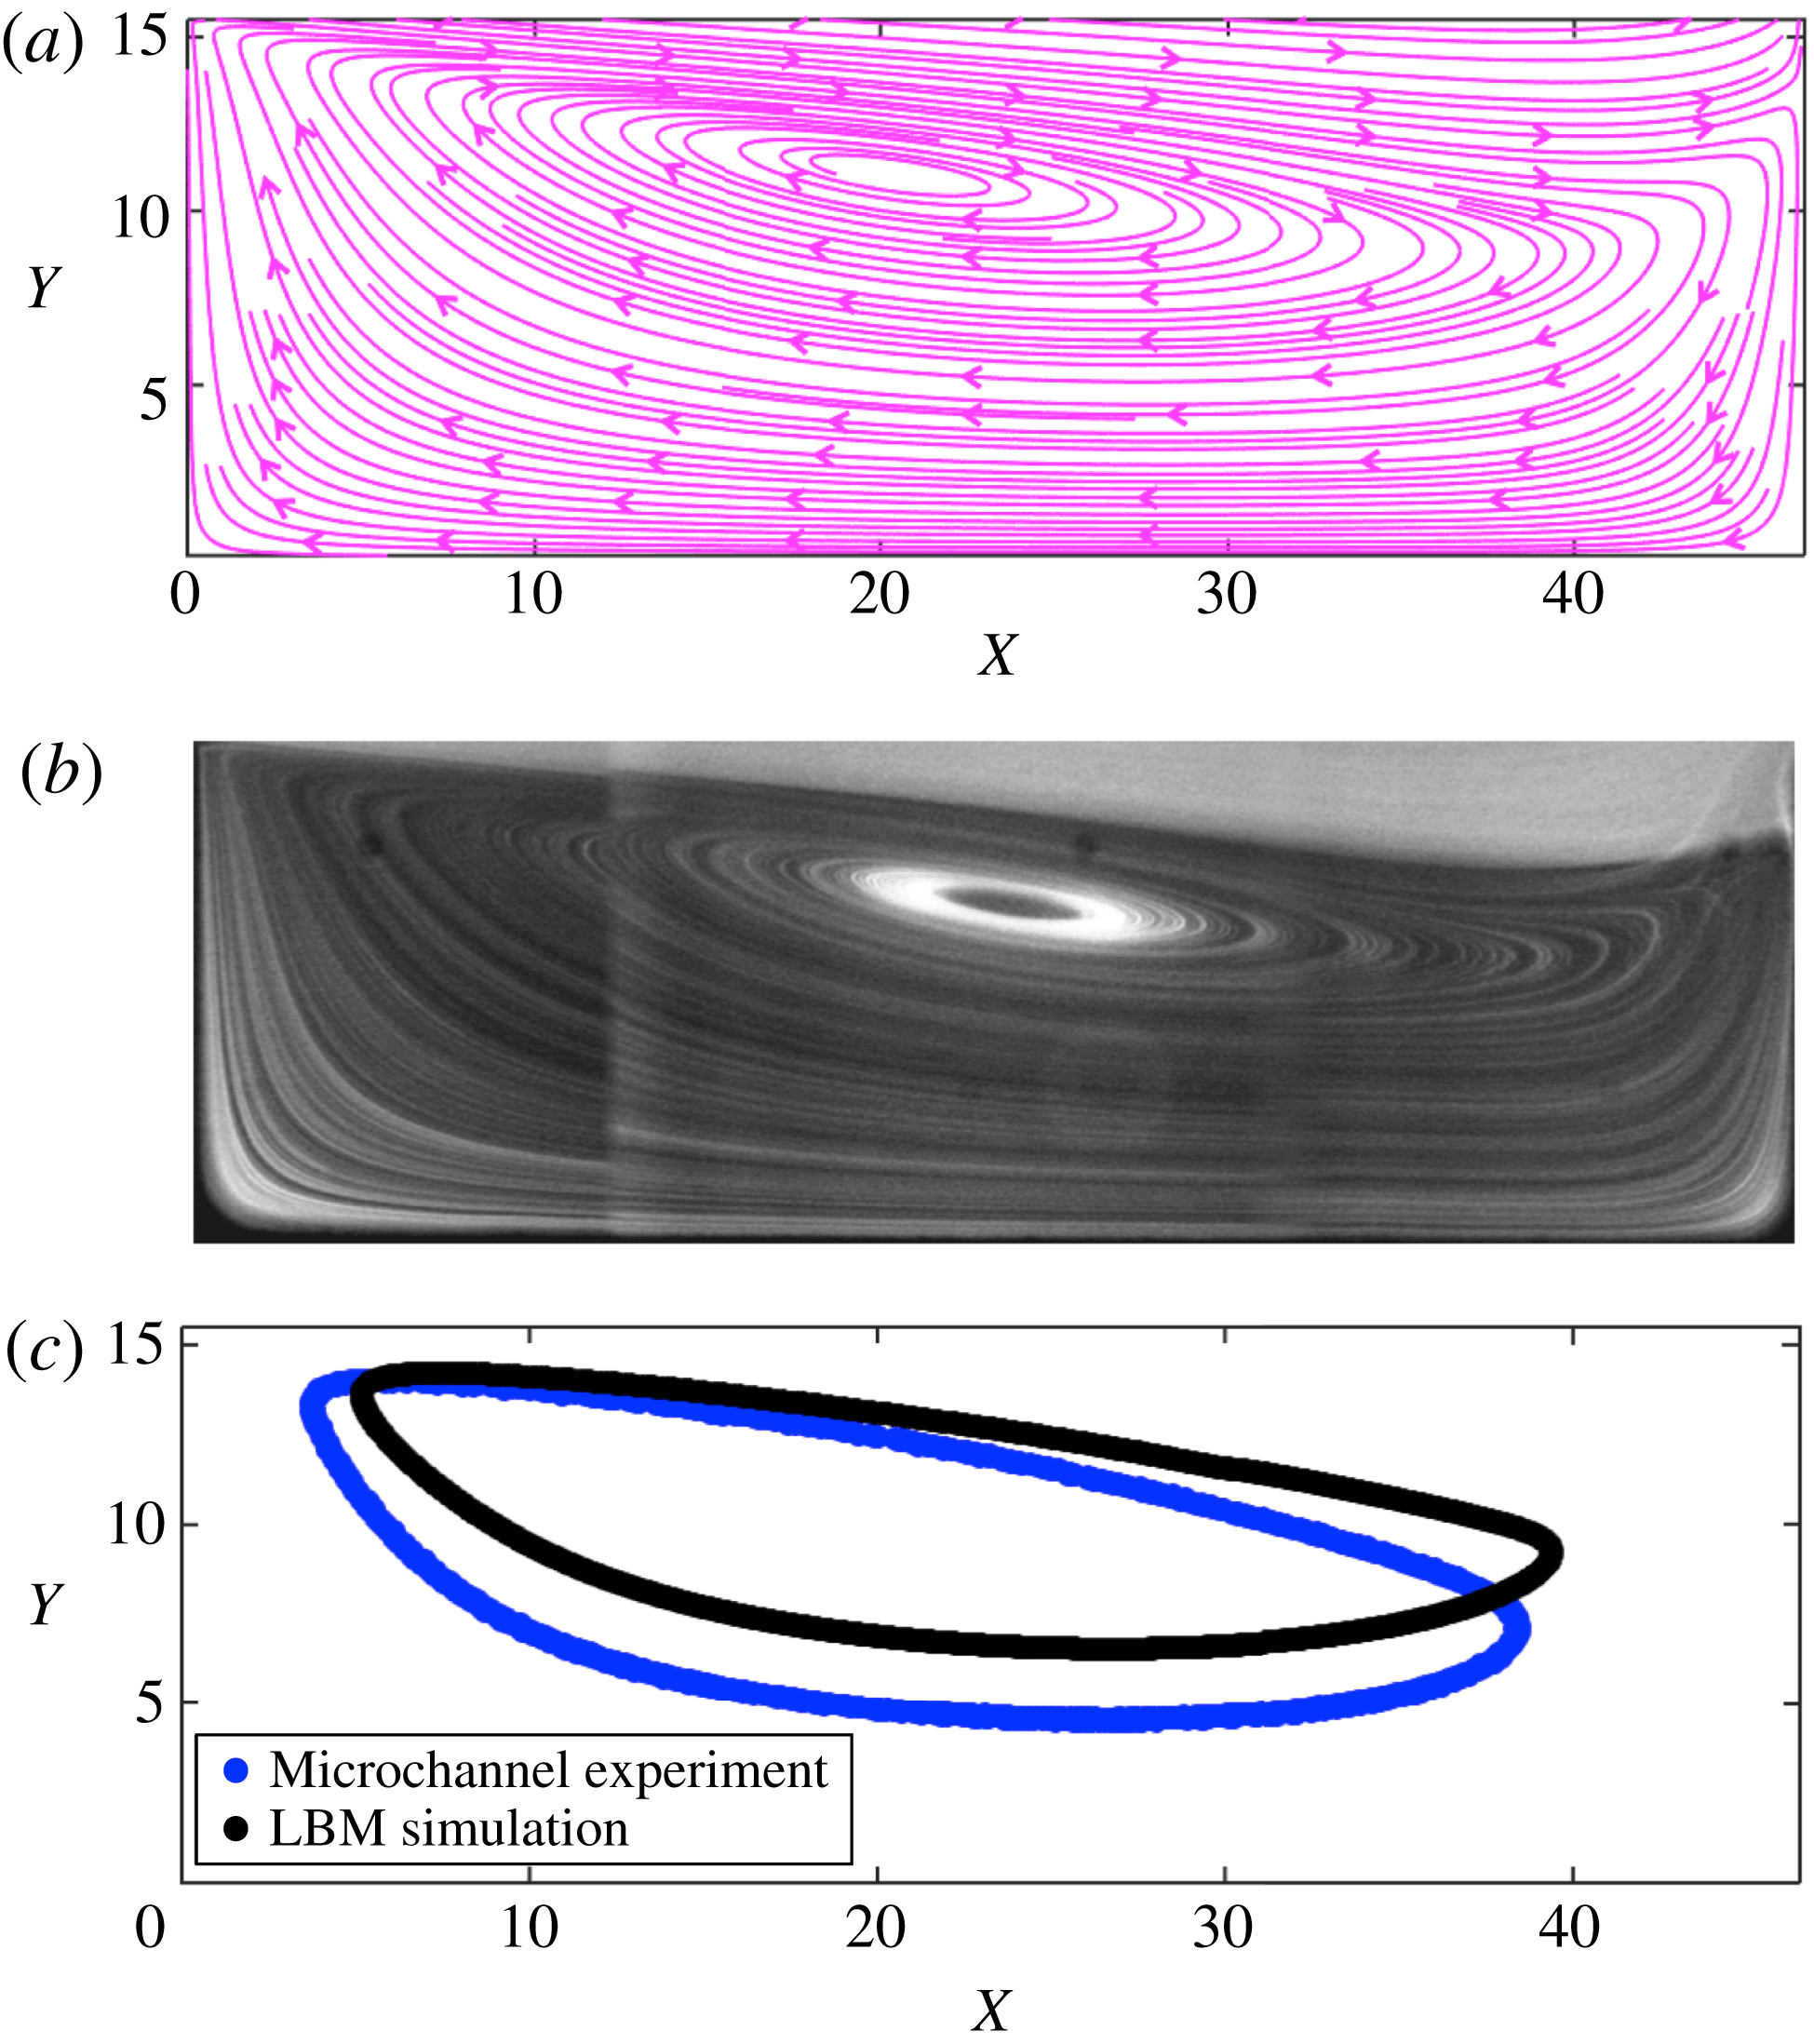
We state the difference between streamlines and limit cycle orbits obtained by LBM simulations and microfluidic experiments. Figure 6 exhibits LBM simulation of fluid flow computed on the
 $z=1.73$
symmetry plane along with fluorescent imaging of tracer distributions. It is stated that fluorescent imaging of tracers provides a picture of streamlines in a finite depth of field. Although the vortex morphology is relatively the same, the location of the vortex core and topology of the limit cycle is slightly different in the LBM simulations and microfluidic experiments. The difference can be due to the deformability of PDMS leading to slight change in the size of the microchannels, microgravity effects due to small density differences between polystyrene microspheres and the buffer fluid and the finite resolution of LBM simulations.
Comparison between LBM simulation and microfluidic experiments of fluid flow and single particle dynamics inside the
 $\unicode[STIX]{x1D706}=3$
cavity at
 $Re=123$
. In (a) we demonstrate LBM simulations of fluid streamlines, which can be compared to distribution of tracers in (b). Difference between topology of the limit cycle orbit in LBM simulations and microfluidic experiments is shown in (c). Slight difference is observed between location of the vortex core and topology of the limit cycle in LBM simulations and microfluidic experiments.

In order to explain the stable motion of a finite size particle on the limit cycle trajectory, we discuss the hydrodynamic force generated on a finite size particle inside the cavity. Small particles follow streamlines closely, however, the hydrodynamic stress of the disturbance flow of a finite size particle leads to deviation from streamlines. We first use the equation of motion of the particle in order to explain various contributions on the particle force, leading to deviation from fluid streamlines. We later address the fact that inertial contributions are implicitly stated by this equation. For a finite size particle suspended in a non-uniform flow, the equation of motion has been presented by Maxey & Riley (Reference Maxey and Riley1983) as a form of Newton’s second law. The motion of a spherical particle with radius
 $a$
is described by
 $$\begin{eqnarray}\displaystyle m_{p}\frac{\text{d}\boldsymbol{V}}{\text{d}t} & = & \displaystyle m_{f}\left.\frac{\text{D}\boldsymbol{u}}{\text{D}t}\right|_{\boldsymbol{Y}(t)}-\frac{1}{2}m_{f}\frac{\text{d}}{\text{d}t}\left(\boldsymbol{V}(t)-\boldsymbol{u}[\boldsymbol{Y}(t),t]-\left.\frac{1}{10}a^{2}\unicode[STIX]{x1D6FB}^{2}\boldsymbol{u}\right|_{\boldsymbol{ Y}(t)}\right)\nonumber\\ \displaystyle & & \displaystyle +\,\boldsymbol{f}-6\unicode[STIX]{x03C0}a\unicode[STIX]{x1D702}(\boldsymbol{V}(t)-\boldsymbol{u}[\boldsymbol{Y}(t),t]-\frac{1}{6}a^{2}\unicode[STIX]{x1D6FB}^{2}\boldsymbol{u}|_{Y(t)}),\end{eqnarray}$$
where
 $\boldsymbol{V}$
is the centre of mass velocity of the particle located at
 $\boldsymbol{Y}(t)$
at time
 $t$
and
 $\boldsymbol{u}$
is the undisturbed fluid velocity. The mass of the fluid and the particle are specified by
 $m_{f}$
and
 $m_{p}$
respectively. The dynamic viscosity of the suspending fluid is denoted by
 $\unicode[STIX]{x1D702}$
. The undisturbed fluid flow generates a force equivalent to
 $m_{f}(\text{D}\boldsymbol{u}/\text{D}t)|_{\boldsymbol{Y}(t)}$
on the particle at the particle centre of mass
 $\boldsymbol{Y}(t)$
; the net force as would act on a deformable fluid element of the same size. The force of the undisturbed flow is specified by the first term on the right-hand side of equation (6.1). An accelerating immersed object must also accelerate the surrounding fluid, generating a force on the object denoted as the added mass which is represented by the second term on the right-hand side of the equation of motion. The third term describes the body forces on the particle; which, for instance, can be a gravitational force
 $\boldsymbol{f}=(m_{p}-m_{f})\boldsymbol{g}$
. The hydrodynamic stress on the surface of a non-deformable particle generates the hydrodynamic drag which appears in all examples of particle motion in a fluid. The last term on the right-hand side corresponds to this hydrodynamic drag force. It should be pointed out that we have not included the Basset history force in (6.1), considering that the history force affects the object for a motion starting from rest. The terms containing the Laplacian of the fluid velocity field
 $\unicode[STIX]{x1D6FB}^{2}\boldsymbol{u}$
are the Faxén corrections to take the curvature of the velocity field into account. The curvature of the fluid velocity cannot be neglected across the length of a large particle. Except for the forces of the undisturbed fluid velocity, i.e.
 $m_{f}(\text{D}\boldsymbol{u}/\text{D}t)|_{\boldsymbol{Y}(t)}$
, other terms of the equation of motion are obtained by assuming that the flow is inertialess, i.e. Stokes flow. Therefore, the particle acceleration appears only implicitly in time derivatives of the particle velocity
 $\text{d}\boldsymbol{V}/\text{d}t$
. Considering the range of
 $Re_{p}$
for flow of finite size particles in microchannels (
 $Re_{p}=5.9{-}59.5$
for
 $d=20~\unicode[STIX]{x03BC}\text{m}$
particles in a
 $C_{Y}=40~\unicode[STIX]{x03BC}\text{m}$
channel), the inertial contributions to the particle dynamics are significant compared to viscous drag forces. Besides, the effect of wall and inertial lift force are not considered by (6.1). We point out that both inertial lift and wall forces can substantially influence the motion of particles inside the cavity.
It is pointed out that the acceleration of a hard spherical particle is represented by the centre of mass acceleration. The acceleration of each material point inside the rigid body with distance
 $\boldsymbol{r}$
from the particle centre of mass
 $\boldsymbol{a}=\unicode[STIX]{x1D736}+\unicode[STIX]{x1D734}\times \boldsymbol{r}+\unicode[STIX]{x1D74E}\times \unicode[STIX]{x1D74E}\times \boldsymbol{r}$
, where
 $\unicode[STIX]{x1D736}$
denotes the centre of mass acceleration,
 $\unicode[STIX]{x1D734}\times \boldsymbol{r}$
the azimuthal acceleration due to the angular acceleration
 $\unicode[STIX]{x1D734}$
and
 $\unicode[STIX]{x1D74E}\times \unicode[STIX]{x1D74E}\times \boldsymbol{r}$
the centrifugal acceleration due to the angular velocity
 $\unicode[STIX]{x1D74E}$
, respectively. For a spherical particle with a symmetric distribution of material points around the centre of mass, both azimuthal and centrifugal accelerations are zero and the centre of mass acceleration
 $\unicode[STIX]{x1D736}$
represents acceleration of the object. By referring to (6.1), we intend to emphasize that contributions to the hydrodynamic force generated by finite size and non-deformability result in significant deviation from fluid streamlines. Therefore, as opposed to tracers which follow fluid streamlines and spiral inside the cavity, a finite size particle approaches a stable orbit.
The presence of a limit cycle trajectory for a finite size particle in recirculating flow has been discussed in a number of works to result from the balance of different forces on the particle. For a particle orbiting inside the recirculating flow behind a bluff body, increasing particle size and density leads to outward displacement of the particle in each orbit (Haddadi et al. Reference Haddadi, Shojaei-Zadeh, Connington and Morris2014). The outward motion of the finite size particle is due to particle inertia, which increases with particle size and density (Haddadi et al. Reference Haddadi, Shojaei-Zadeh and Morris2016). Consequently, the particle does not follow closed streamlines of the recirculating wake and migrates outward. The limit cycle orbit can only be explained if there are opposing migration mechanisms. In K&G, the large residence time of red cell clusters was argued to result from the inertial lift force inside the tube, which generates an inward migration towards the vortex core, opposing outward motion of the cell clusters in the vortical flow region. The interplay between migration due to centrifugal force and outward motion of high density particles in the vortices of a Taylor–Couette device leads to formation of stable limit cycle trajectories and particle segregation (Wereley & Lueptow Reference Wereley and Lueptow1999). It has been discussed in Haddadi et al. (Reference Haddadi, Shojaei-Zadeh, Connington and Morris2014) that the outward inertial motion of a finite size particle inside the wake behind a bluff body is opposed by hydrodynamic lubrication force between a finite size particle and the obstacle. The hydrodynamic lubrication between surfaces of the obstacle and the particle prevents further outward displacement. Therefore, a stable limit cycle orbit forms close to wake boundaries.
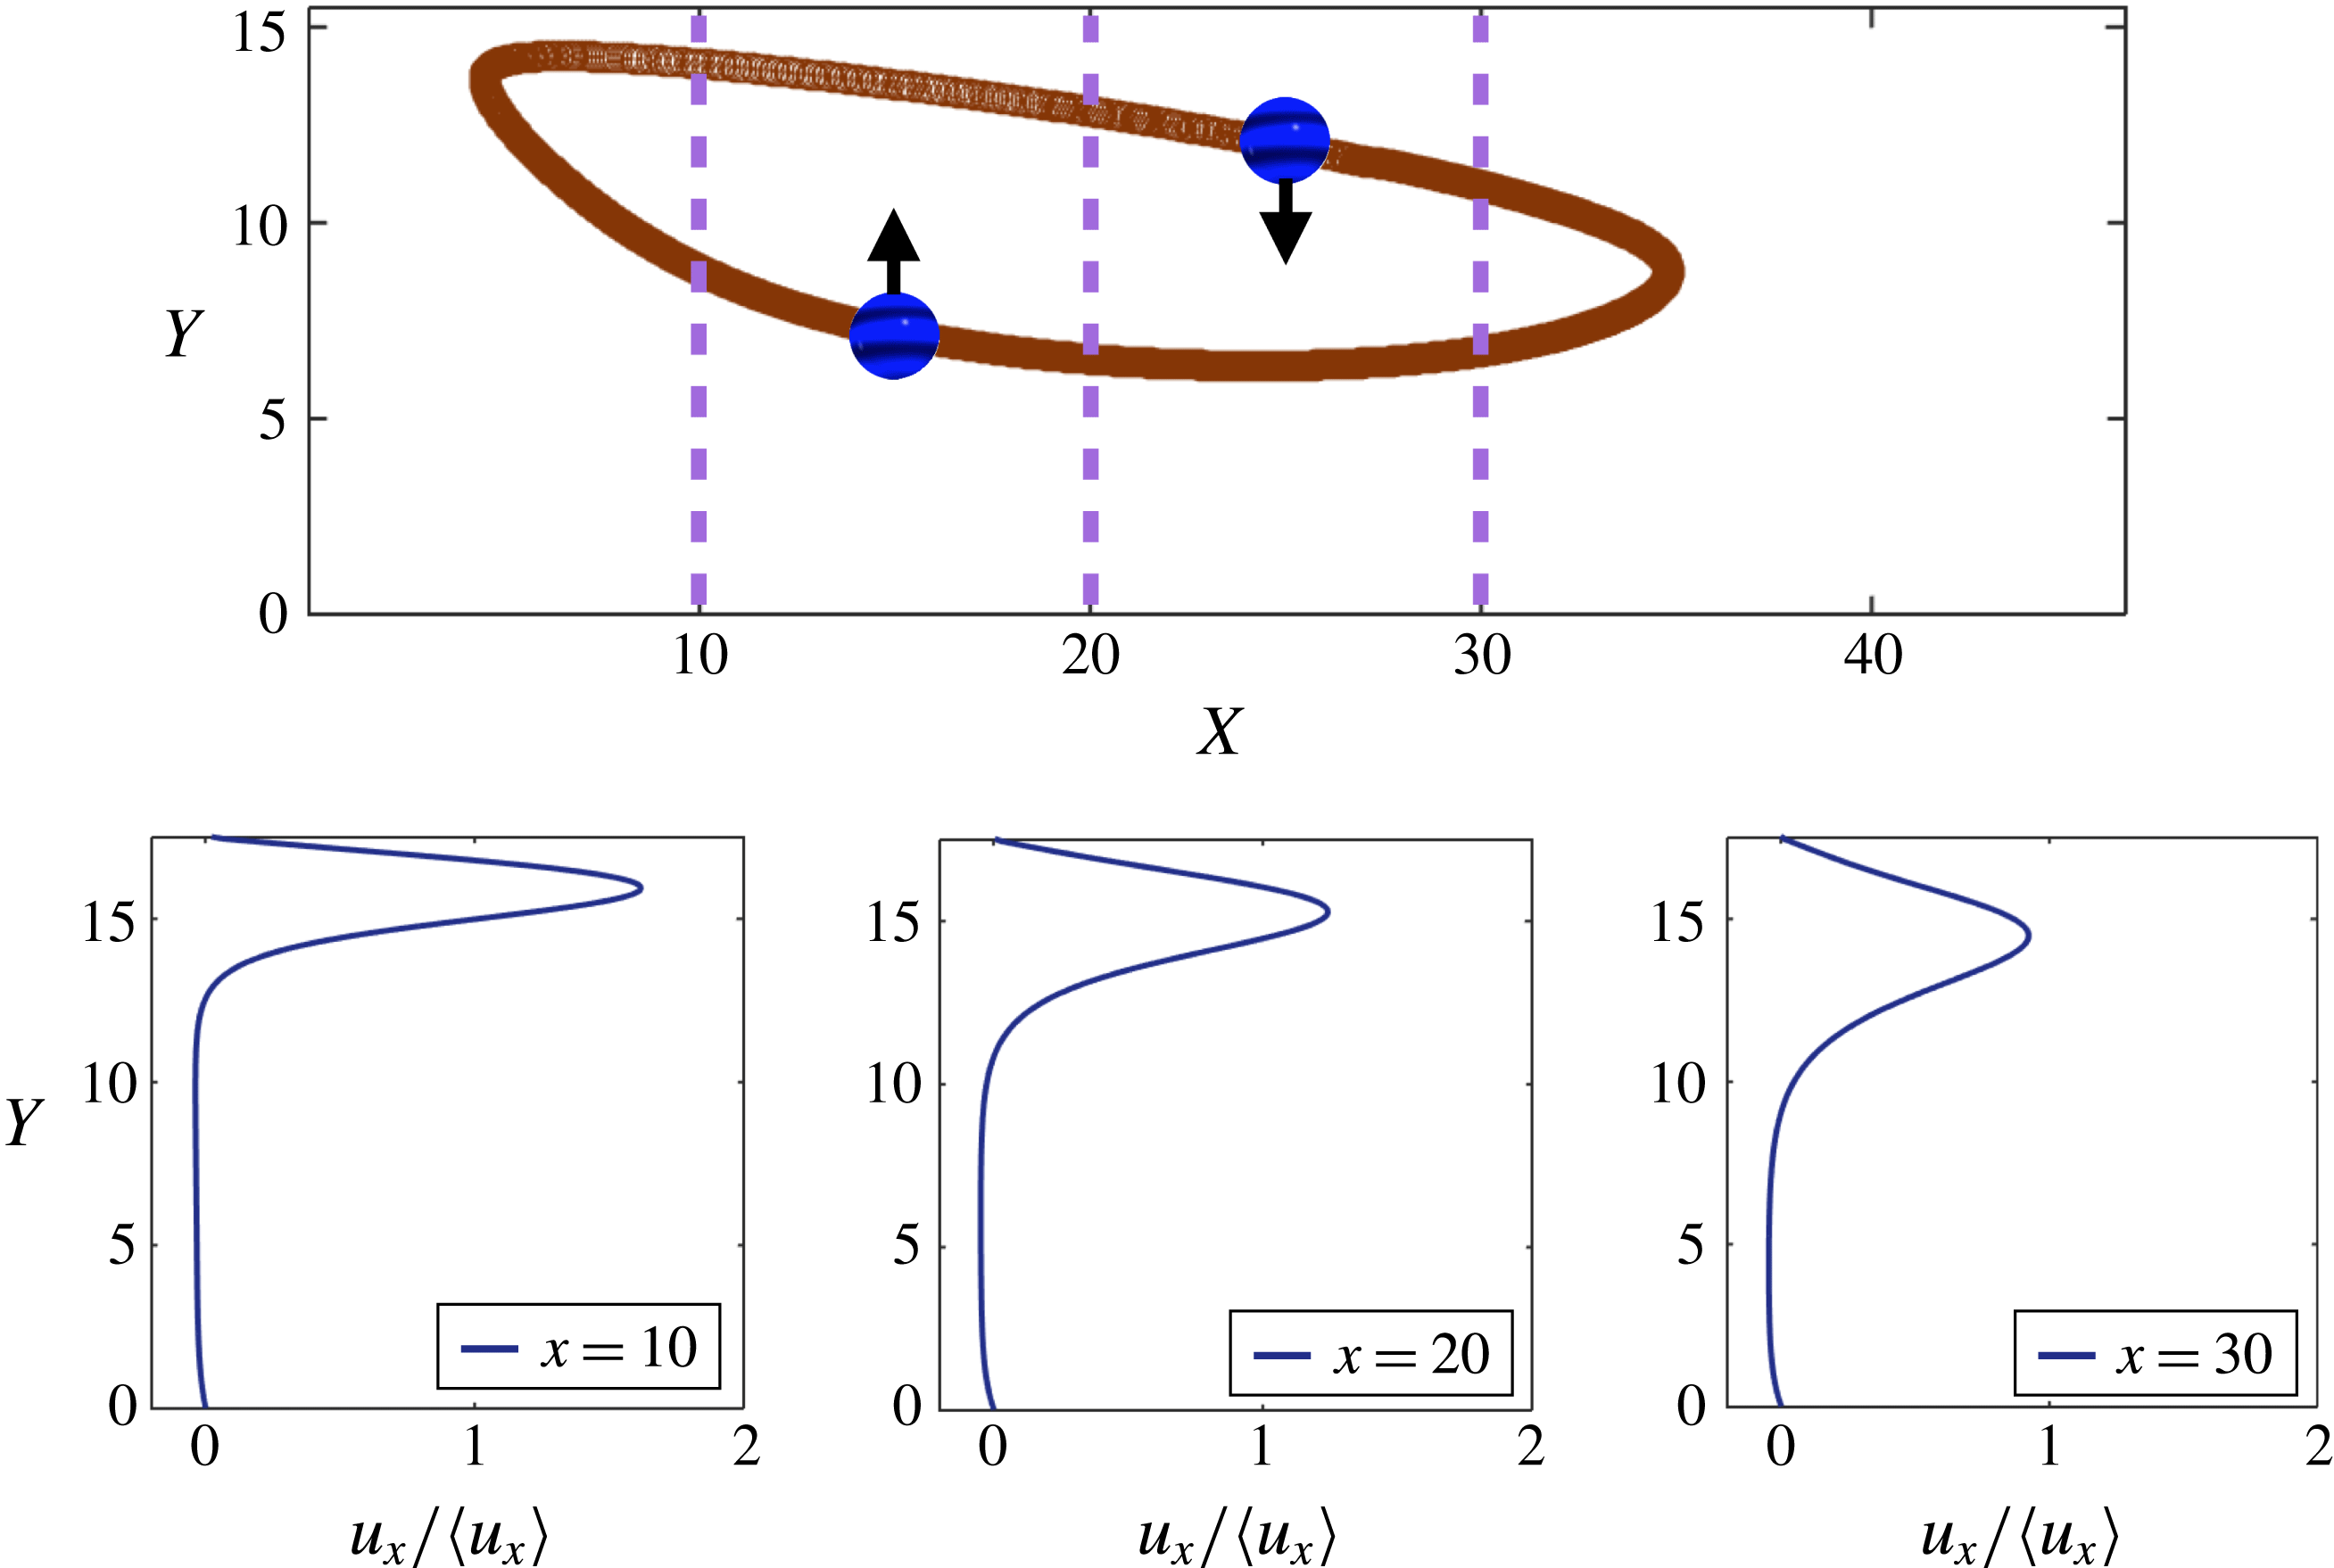
The inward migration generated by inertial lift force opposes outward migration of the particle towards the boundaries of the flow cell. The combined effects of outward and inward migrations lead to formation of a limit cycle trajectory inside the cavity. The inertial lift force on the particle is generated by velocity gradients, which are exhibited for three sections,
 $x=10$
,
 $20$
and
 $30$
inside the cavity at
 $Re=123$
. The direction of the lateral lift force is indicated in the figure.

Here we present a qualitative explanation for the motion of isolated particles on the stable limit cycle trajectory that is based on the effect of inertial lift force balancing the outward inertial motion of particles. However, due to the absence of a mechanistic description for lift force, our proposed mechanism is a baseline description. In figure 7 we present numerical simulations of the limit cycle trajectory at
 $Re=123$
. It has been shown that inertial particles migrate outward in the wake behind bluff bodies (Haddadi et al.
Reference Haddadi, Shojaei-Zadeh and Morris2016). The rate of outward motion increases with particle inertia. Similarly, inertial particles released in the core of the cavity vortex migrate outward towards the vortex boundaries (figure 5
a). In each cycle of motion on the limit cycle orbit, the particle is subjected to inertial lift force due to the spatially varying velocity, which repels the particle from zones of steep velocity gradient. Profiles of axial velocity at different sections in the
 $X$
direction are shown in figure 7. The velocity gradient inside the channel exerts a lateral force while the particle traces the orbit in the forward direction, leading to inward migration towards the vortex core. Upon reversing direction, the particle is subjected to a velocity gradient in the opposite direction. The velocity gradient in the opposite direction is weaker, however it can also generate inward migration away from the vortex boundaries towards the vortex core. Therefore, outward displacement of a particle in the flow cell is opposed by inward migration generated by inertial lift force and particle reaches a stable orbit.
The limit cycle topology varies with particle size. We use scaling arguments of the lift in a straight channel to qualitatively explain variations of the limit cycle topology. In all scalings, there is a power-law dependence between
 $F_{L}$
and
 $d$
. Numerous scaling arguments delineate the relationship between
 $F_{L}$
and
 $d$
in tube or slit geometries (Saffman Reference Saffman1965; Cox & Brenner Reference Cox and Brenner1968; Ho & Leal Reference Ho and Leal1974; Asmolov Reference Asmolov1999). However, the migration pattern is different in a microchannel. As opposed to inertial pipe flow, which generates migration towards an annulus (Matas et al.
Reference Matas, Glezer, Guazzelli and Morris2004), particles migrate towards discrete inertial equilibrium positions in a rectangular channel (Chun & Ladd Reference Chun and Ladd2006; Di Carlo et al.
Reference Di Carlo, Edd, Humphry, Stone and Tonner2009; Miura, Itano & Sugihara-Seki Reference Miura, Itano and Sugihara-Seki2014). By solving the fluid flow around a force free particle coupled with particle dynamics, Di Carlo et al. (Reference Di Carlo, Edd, Humphry, Stone and Tonner2009) presents
 $F_{L}\sim d^{3}$
for an experimentally relevant range of
 $1\leqslant Re_{p}\leqslant 20$
and
 $0.05\leqslant \unicode[STIX]{x1D6FF}\leqslant 0.2$
. Using asymptotic expansions in a three-dimensional channel geometry, Hood, Lee & Roper (Reference Hood, Lee and Roper2015) have presented
 $F_{L}\sim d^{4}$
scalings for
 $\unicode[STIX]{x1D6FF}\rightarrow 0$
. They show that with increasing
 $\unicode[STIX]{x1D6FF}$
,
 $F_{L}\sim d^{5}$
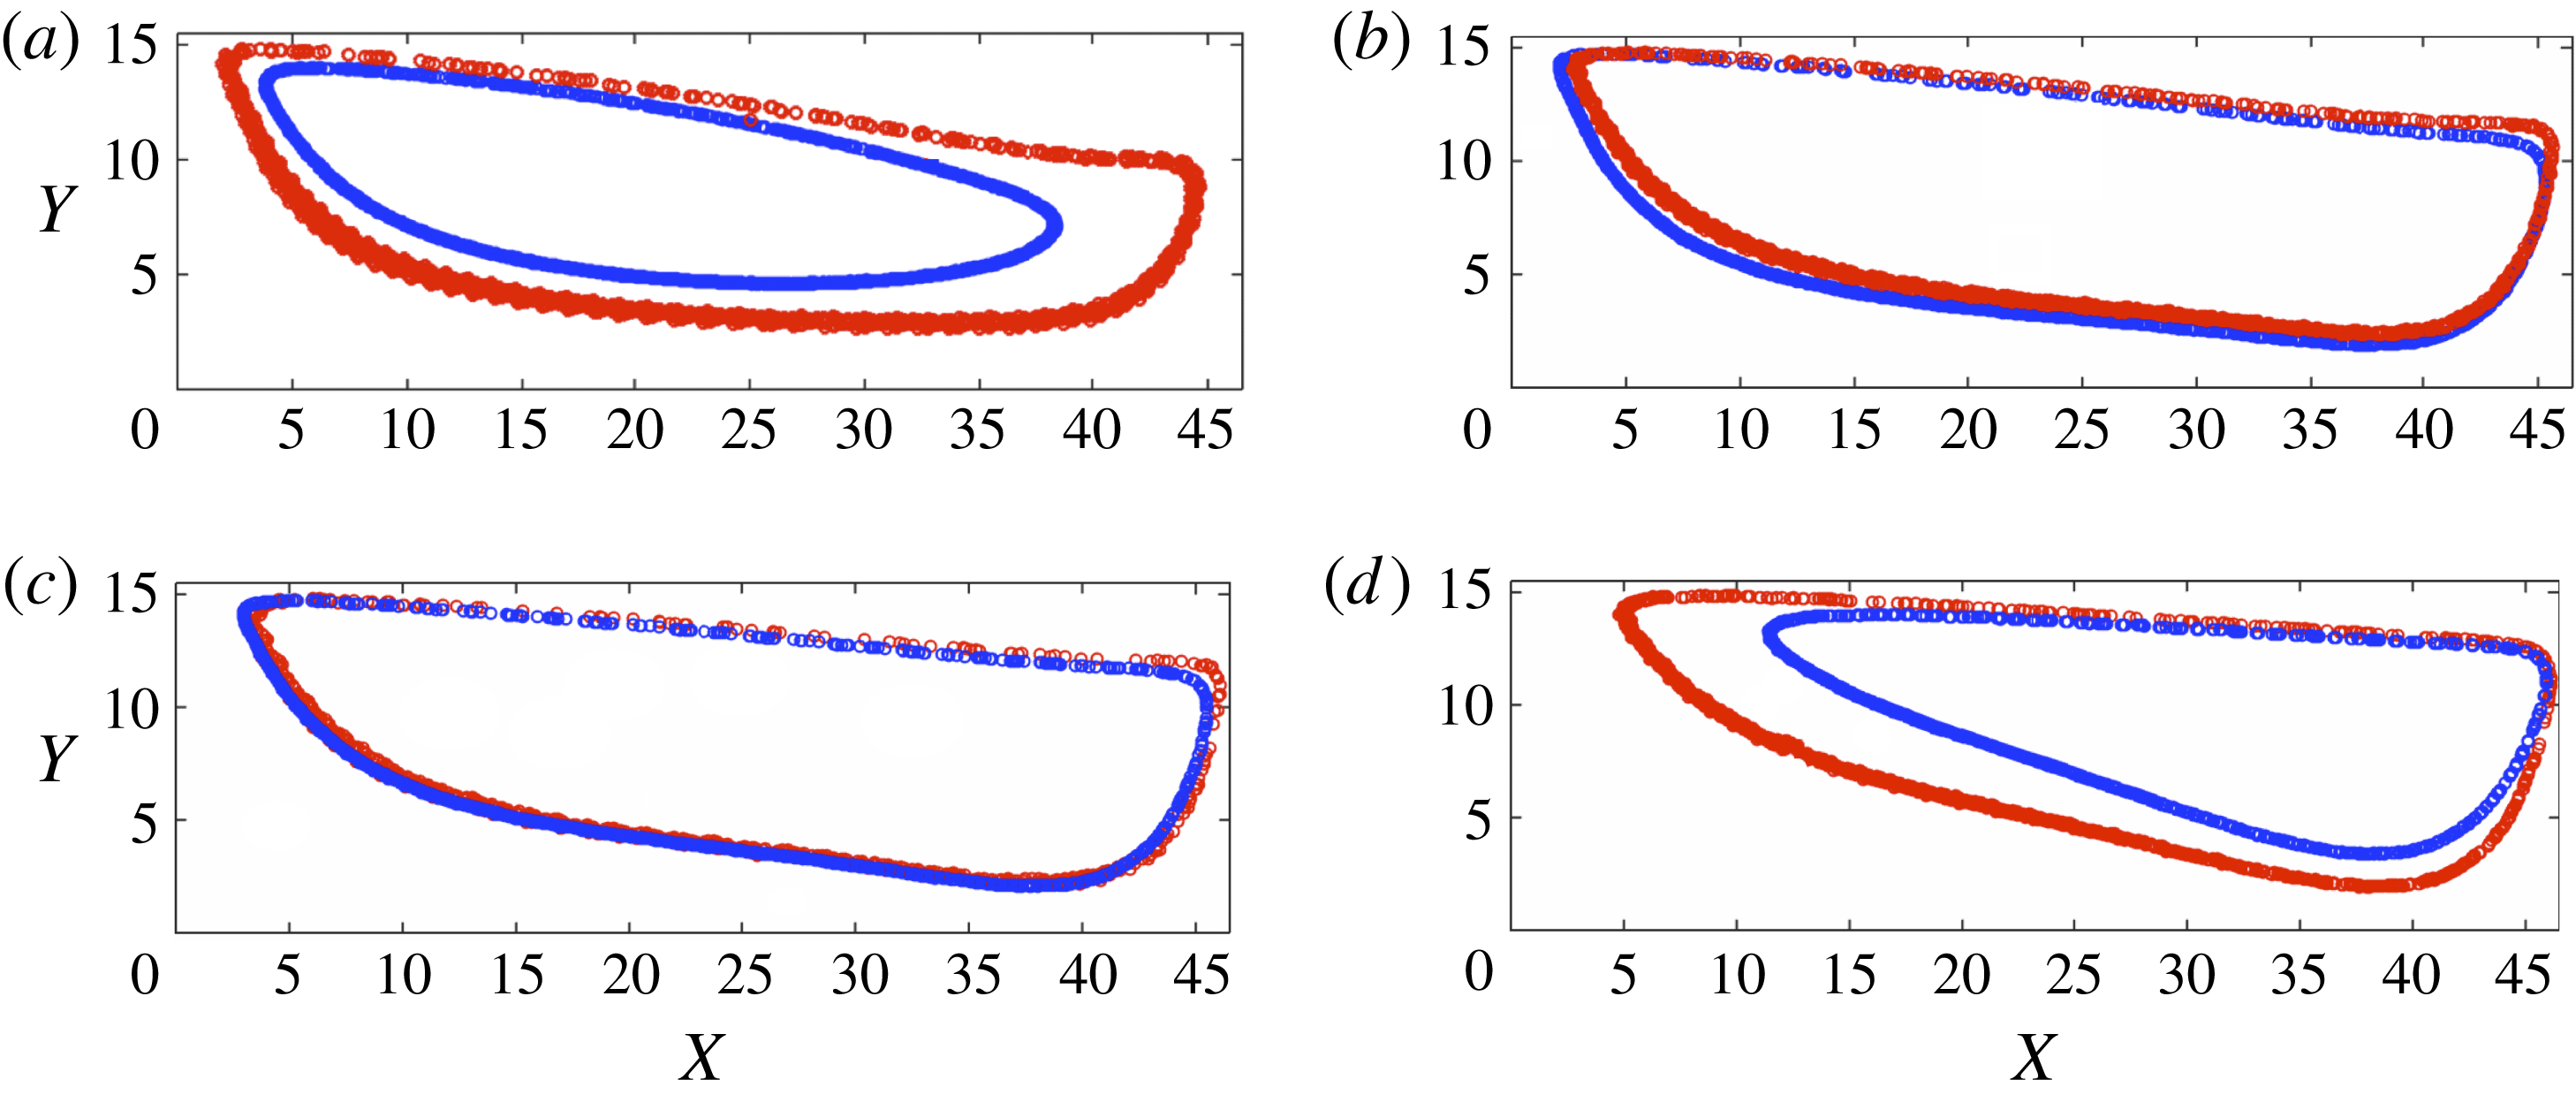
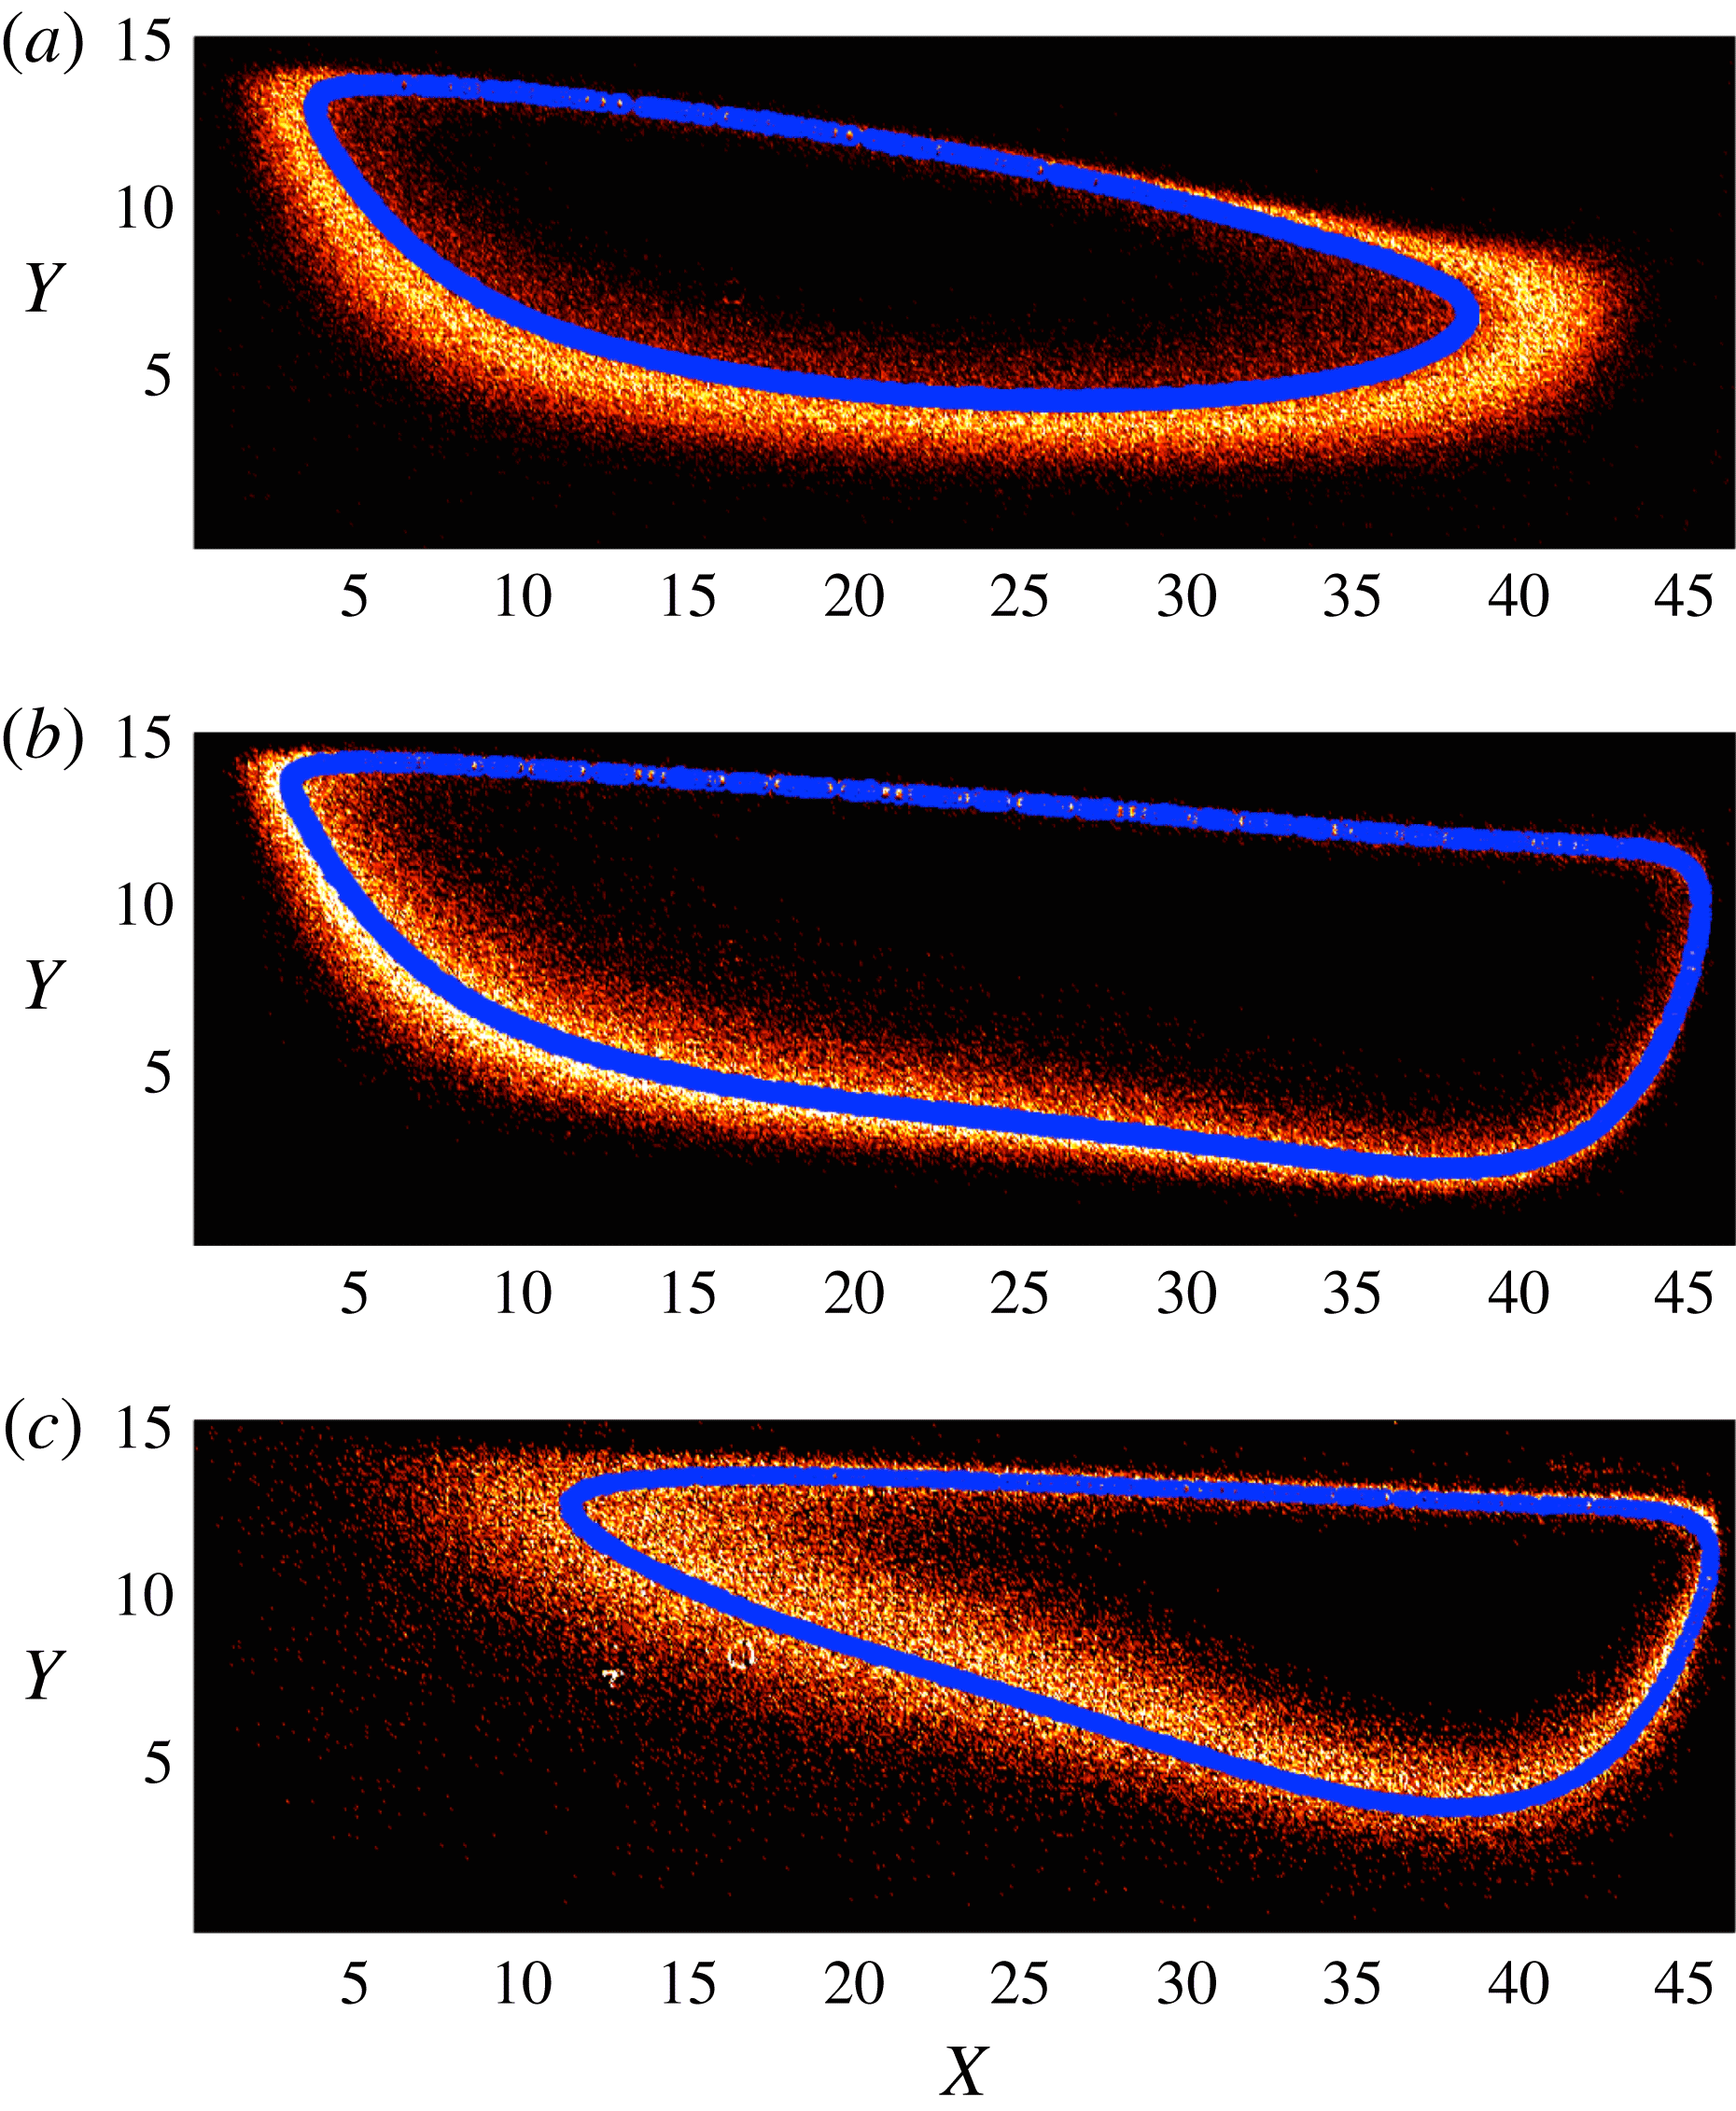
provides more accurate relationship between magnitude of lateral force and particle diameter. In figure 8, we present the limit cycle trajectories for
 $d=10$
and
 $20~\unicode[STIX]{x03BC}\text{m}$
particles, corresponding to
 $\unicode[STIX]{x1D6FF}=0.25$
and
 $0.5$
, inside
 $\unicode[STIX]{x1D706}=3$
cavity. At
 $Re=123$
, the limit cycle orbit of the larger
 $d=20~\unicode[STIX]{x03BC}\text{m}$
particle forms closer to the vortex core and
 $d=10~\unicode[STIX]{x03BC}\text{m}$
particle orbits closer to vortex boundaries. Although for intermediate values of
 $Re=185$
and
 $216$
, the difference between orbit topologies of
 $d=10$
and
 $20~\unicode[STIX]{x03BC}\text{m}$
particles is not pronounced, there is a clear distinction between large and small particle limit cycle orbits at
 $Re=308$
.
Experimental measurements of the limit cycle trajectory for
 $d=10$
(○) (red) and
 $d=20$
(○) (blue) particles inside
 $\unicode[STIX]{x1D706}=3$
cavity at (a)
 $Re=123$
, (b)
 $Re=185$
, (c)
 $Re=216$
and (d)
 $Re=308$
. Diameter of the large particle
 $d=20~\unicode[STIX]{x03BC}\text{m}$
is used to make the lengths dimensionless.

We mention that the limit cycle orbit is a unique trajectory attractor which forms on the symmetry plane along the
 $Z$
direction, i.e.
 $z=H/2$
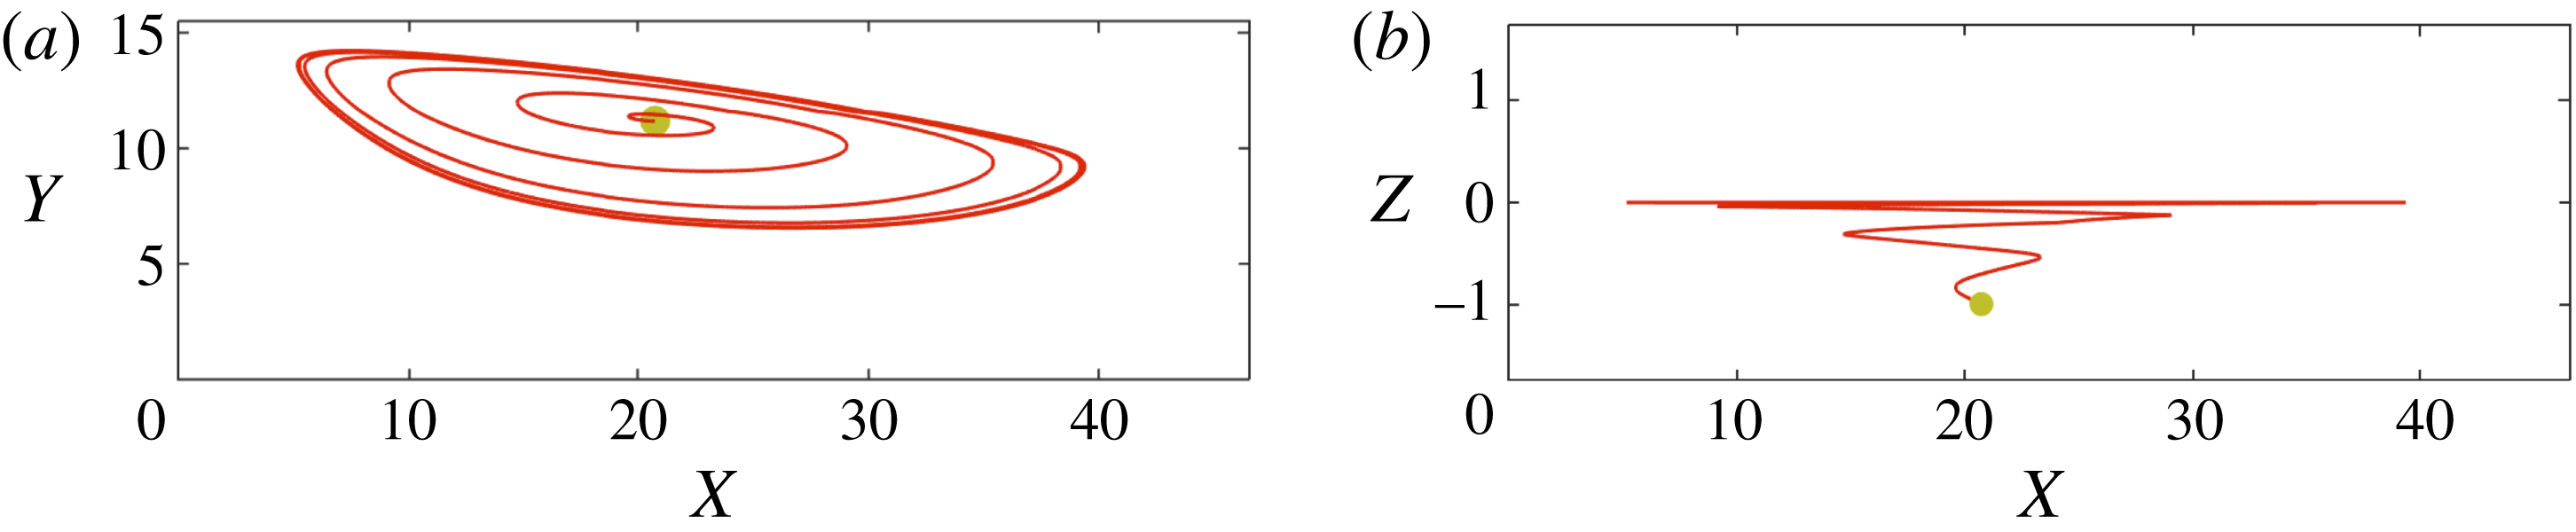
plane. All trajectories spiral towards the middle plane due to the flow symmetry. In figure 9, we exhibit LBM simulations of spiralling motion of a
 $\unicode[STIX]{x1D6FF}=0.5$
particle towards the midplane along the
 $Z$
direction (
 $z=1.73$
). The particle spirals towards the limit cycle on the midplane and maintains its planar motion on a stable limit cycle orbit.
Our results for motion of isolated particles inside the vortex show distinctive behaviour of finite size particles in the vortical flow inside a wall-confined cavity. The limit cycle forms for both
 $H=45$
and
 $70~\unicode[STIX]{x03BC}\text{m}$
cavities, although we presented our results for a
 $H=70~\unicode[STIX]{x03BC}\text{m}$
cavity. The stable motion of the finite size particle significantly increases the particle residence time inside the cavity and generates a particle retention zone. In addition to biological applications such as blood flow in aneurysms or stenosis geometries, formation of the limit cycle in a flow cell has important consequences in some industrial processes. For example, in cleansing indented surfaces from particulate pollutants, the presence of retention zones can lead to imperfect release of particles. In addition to particle size, the magnitude of the lift force depends on
 $Re$
. Therefore, there is a critical
 $Re$
, denoted by
 $Re_{cr}$
, below which the limit cycle trajectory no longer forms. Large particles are more influenced by the lift force, resulting in formation of the limit cycle at a smaller
 $Re_{cr}$
. For instance in a
 $\unicode[STIX]{x1D706}=3$
cavity, the value of
 $Re_{cr}$
for
 $d=20~\unicode[STIX]{x03BC}\text{m}$
is
 $84$
. For smaller
 $d=15$
and
 $10~\unicode[STIX]{x03BC}\text{m}$
particles, the values of
 $Re_{cr}$
are
 $200$
and
 $216$
respectively.
The limit cycle trajectory forms on the symmetry plane, i.e. the midplane along the
 $Z$
direction. Particles on other planes spiral towards the symmetry plane. The LBM simulation of spiralling motion of a
 $\unicode[STIX]{x1D6FF}=0.5$
particle released from
 $z=-d$
towards the limit cycle on the symmetry plane, projected on (a)
 $XY$
and (b)
 $XZ$
planes at
 $Re=123$
.

7 Dilute suspension flow over open cavities
In the following, we study flow of a dilute suspension over the cavity and discuss particle entrapment. The particle exchange between the cavity and channel is explained by investigation of particle entry and exit. Formation of the limit cycle, which has been discussed in previous sections, is crucial for maintaining particles inside the cavity after entrapment. We begin by discussing the effect of the cavity aspect ratio
 $\unicode[STIX]{x1D706}$
on the number of entrapped particles at various
 $Re$
. Then we explain different factors affecting the particle entrapment in cavities. We demonstrate that the number of entrapped particles inside the cavity reaches a maximum at a specific
 $Re$
. It will be discussed that the combination of vortex morphology and particle dynamics leads to maximum entrapment. Finally, depletion of the cavities generated by hydrodynamic interaction between particles will be presented.
7.1 Cavity capacity
In flow of a dilute suspension over a cavity, the number of entrapped particles varies by changing the cavity aspect ratio
 $\unicode[STIX]{x1D706}$
and
 $Re$
. In order to study particle entrapment, we first measure the maximum number of particles captured inside the cavity at each
 $Re$
, termed cavity capacity hereafter. To explain the cavity capacity, we begin by demonstrating the number of entrapped particles
 $N_{p}$
inside
 $\unicode[STIX]{x1D706}=2.02$
,
 $3$
and
 $5$
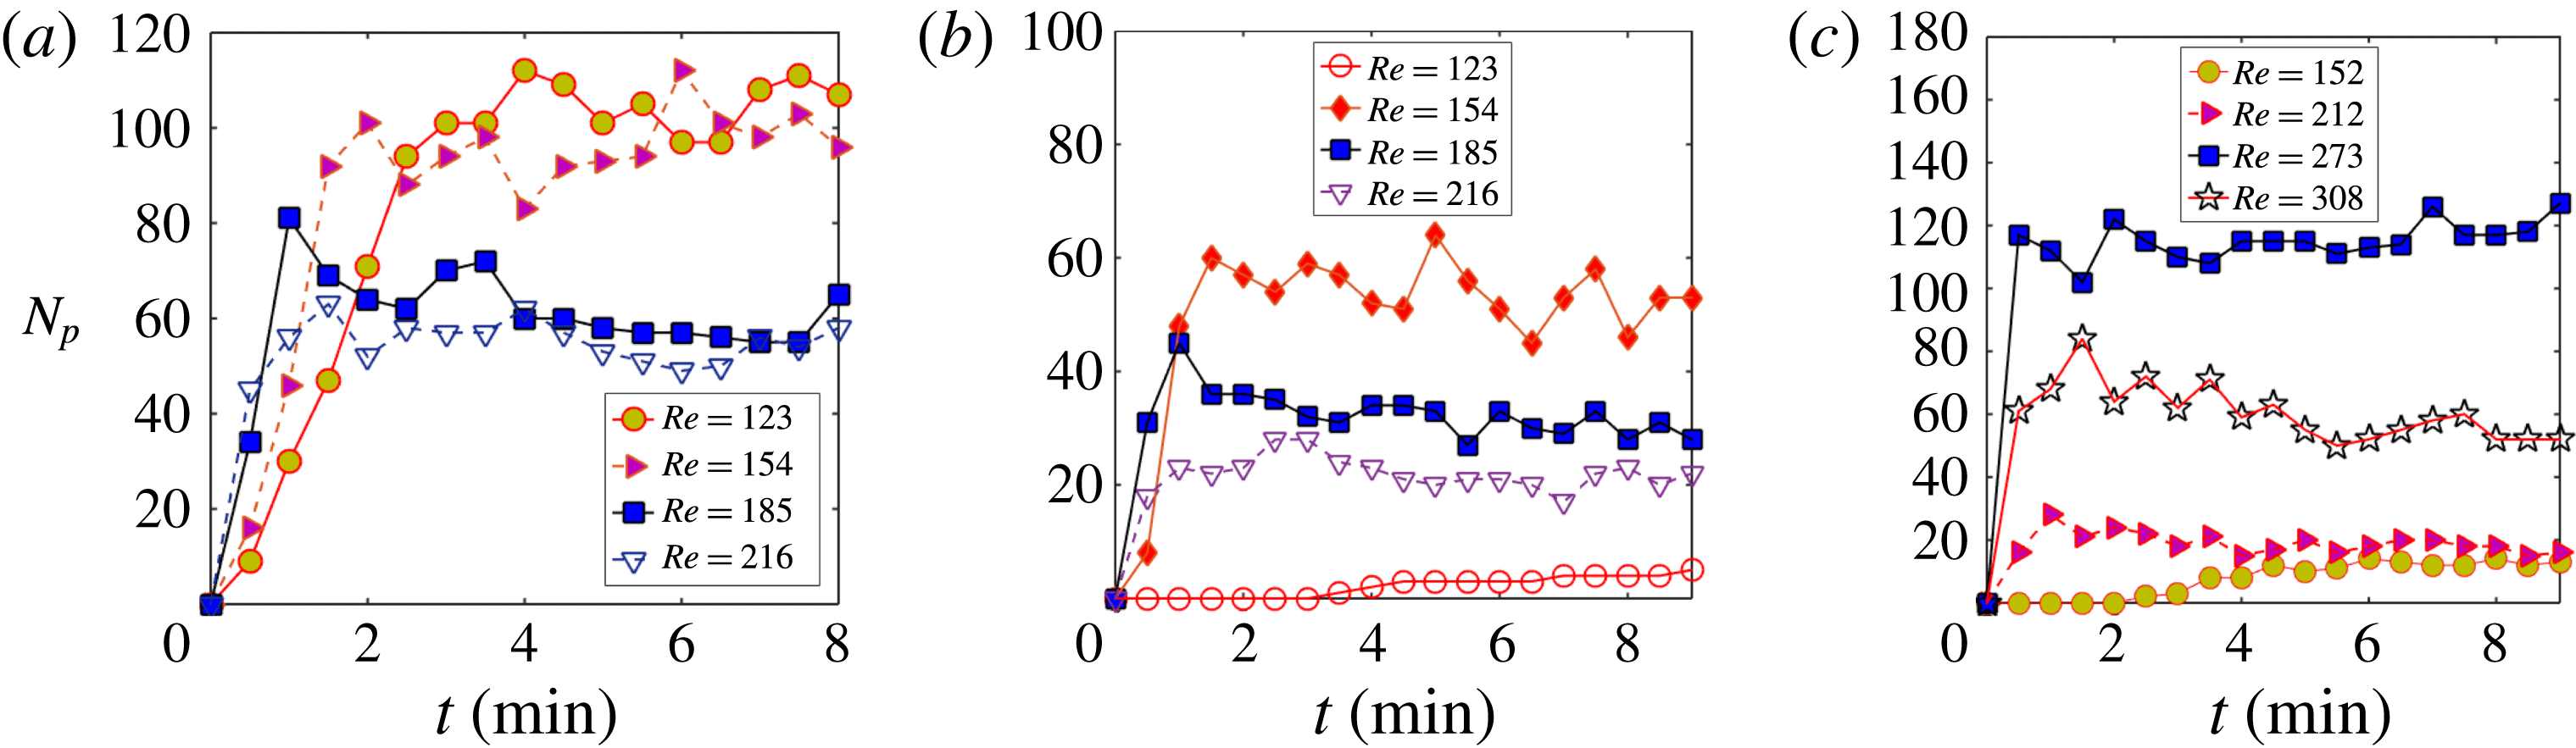
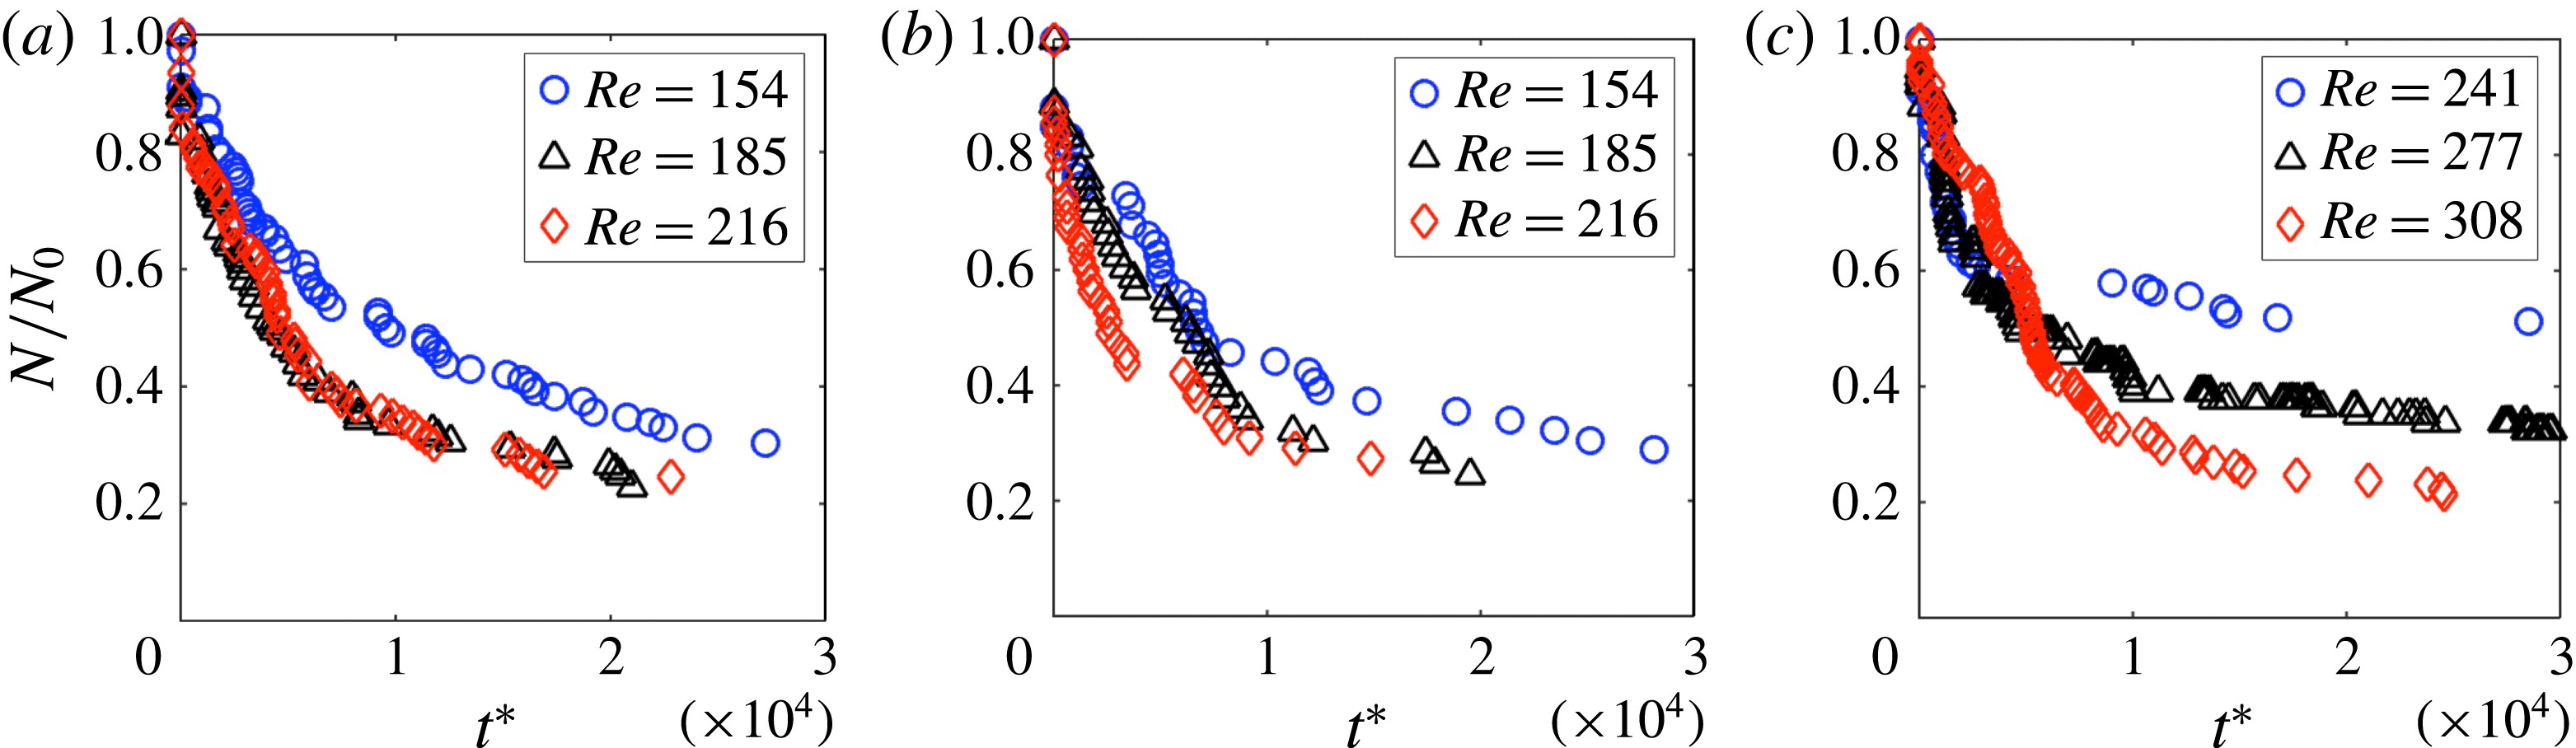
cavities versus time in figure 10. Considering that the size distribution of particles is uniform, the number of entrapped particles
 $N_{p}$
is indicative of the volume of the solid phase inside the cavity. After infusion of the suspension,
 $N_{p}$
increases until reaching a plateau where the number of particles fluctuates around an average. Experiments have been repeated at least three times to ensure consistency. The cavity capacity is computed by taking the average number of entrapped particles after reaching the plateau.
By infusing a dilute suspension of
 $d=20~\unicode[STIX]{x03BC}\text{m}$
particles into the microchannel, the number of particles in the cavity increases until reaching a plateau where the number of particles fluctuates around an average value. The plots demonstrate the time series of entrapment inside (a)
 $\unicode[STIX]{x1D706}=2.02$
, (b)
 $\unicode[STIX]{x1D706}=3$
and (c)
 $\unicode[STIX]{x1D706}=5$
cavities at various
 $Re$
.

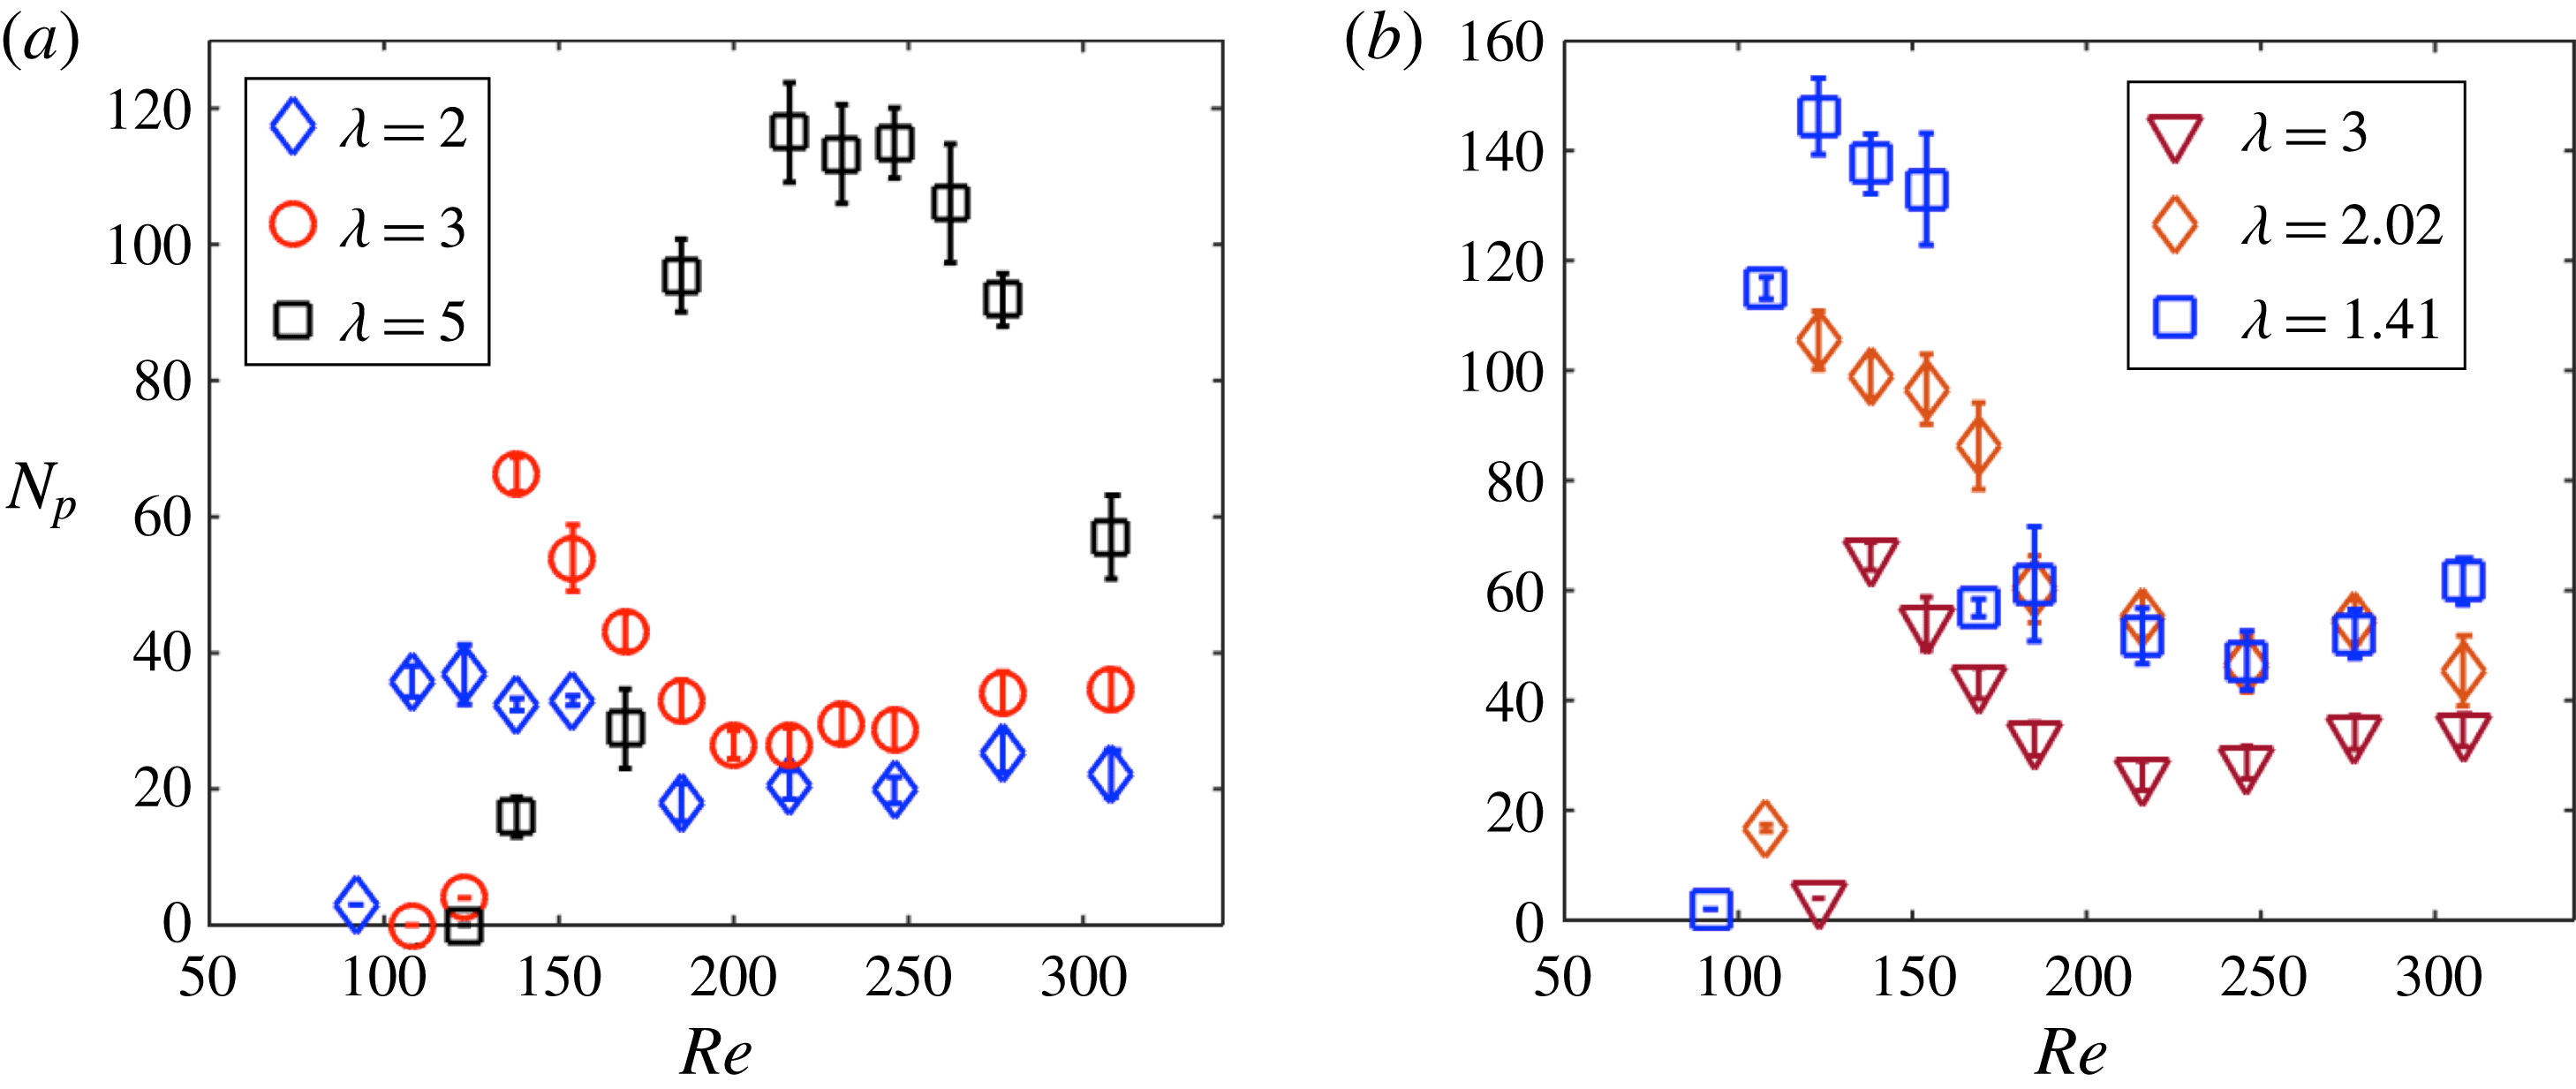
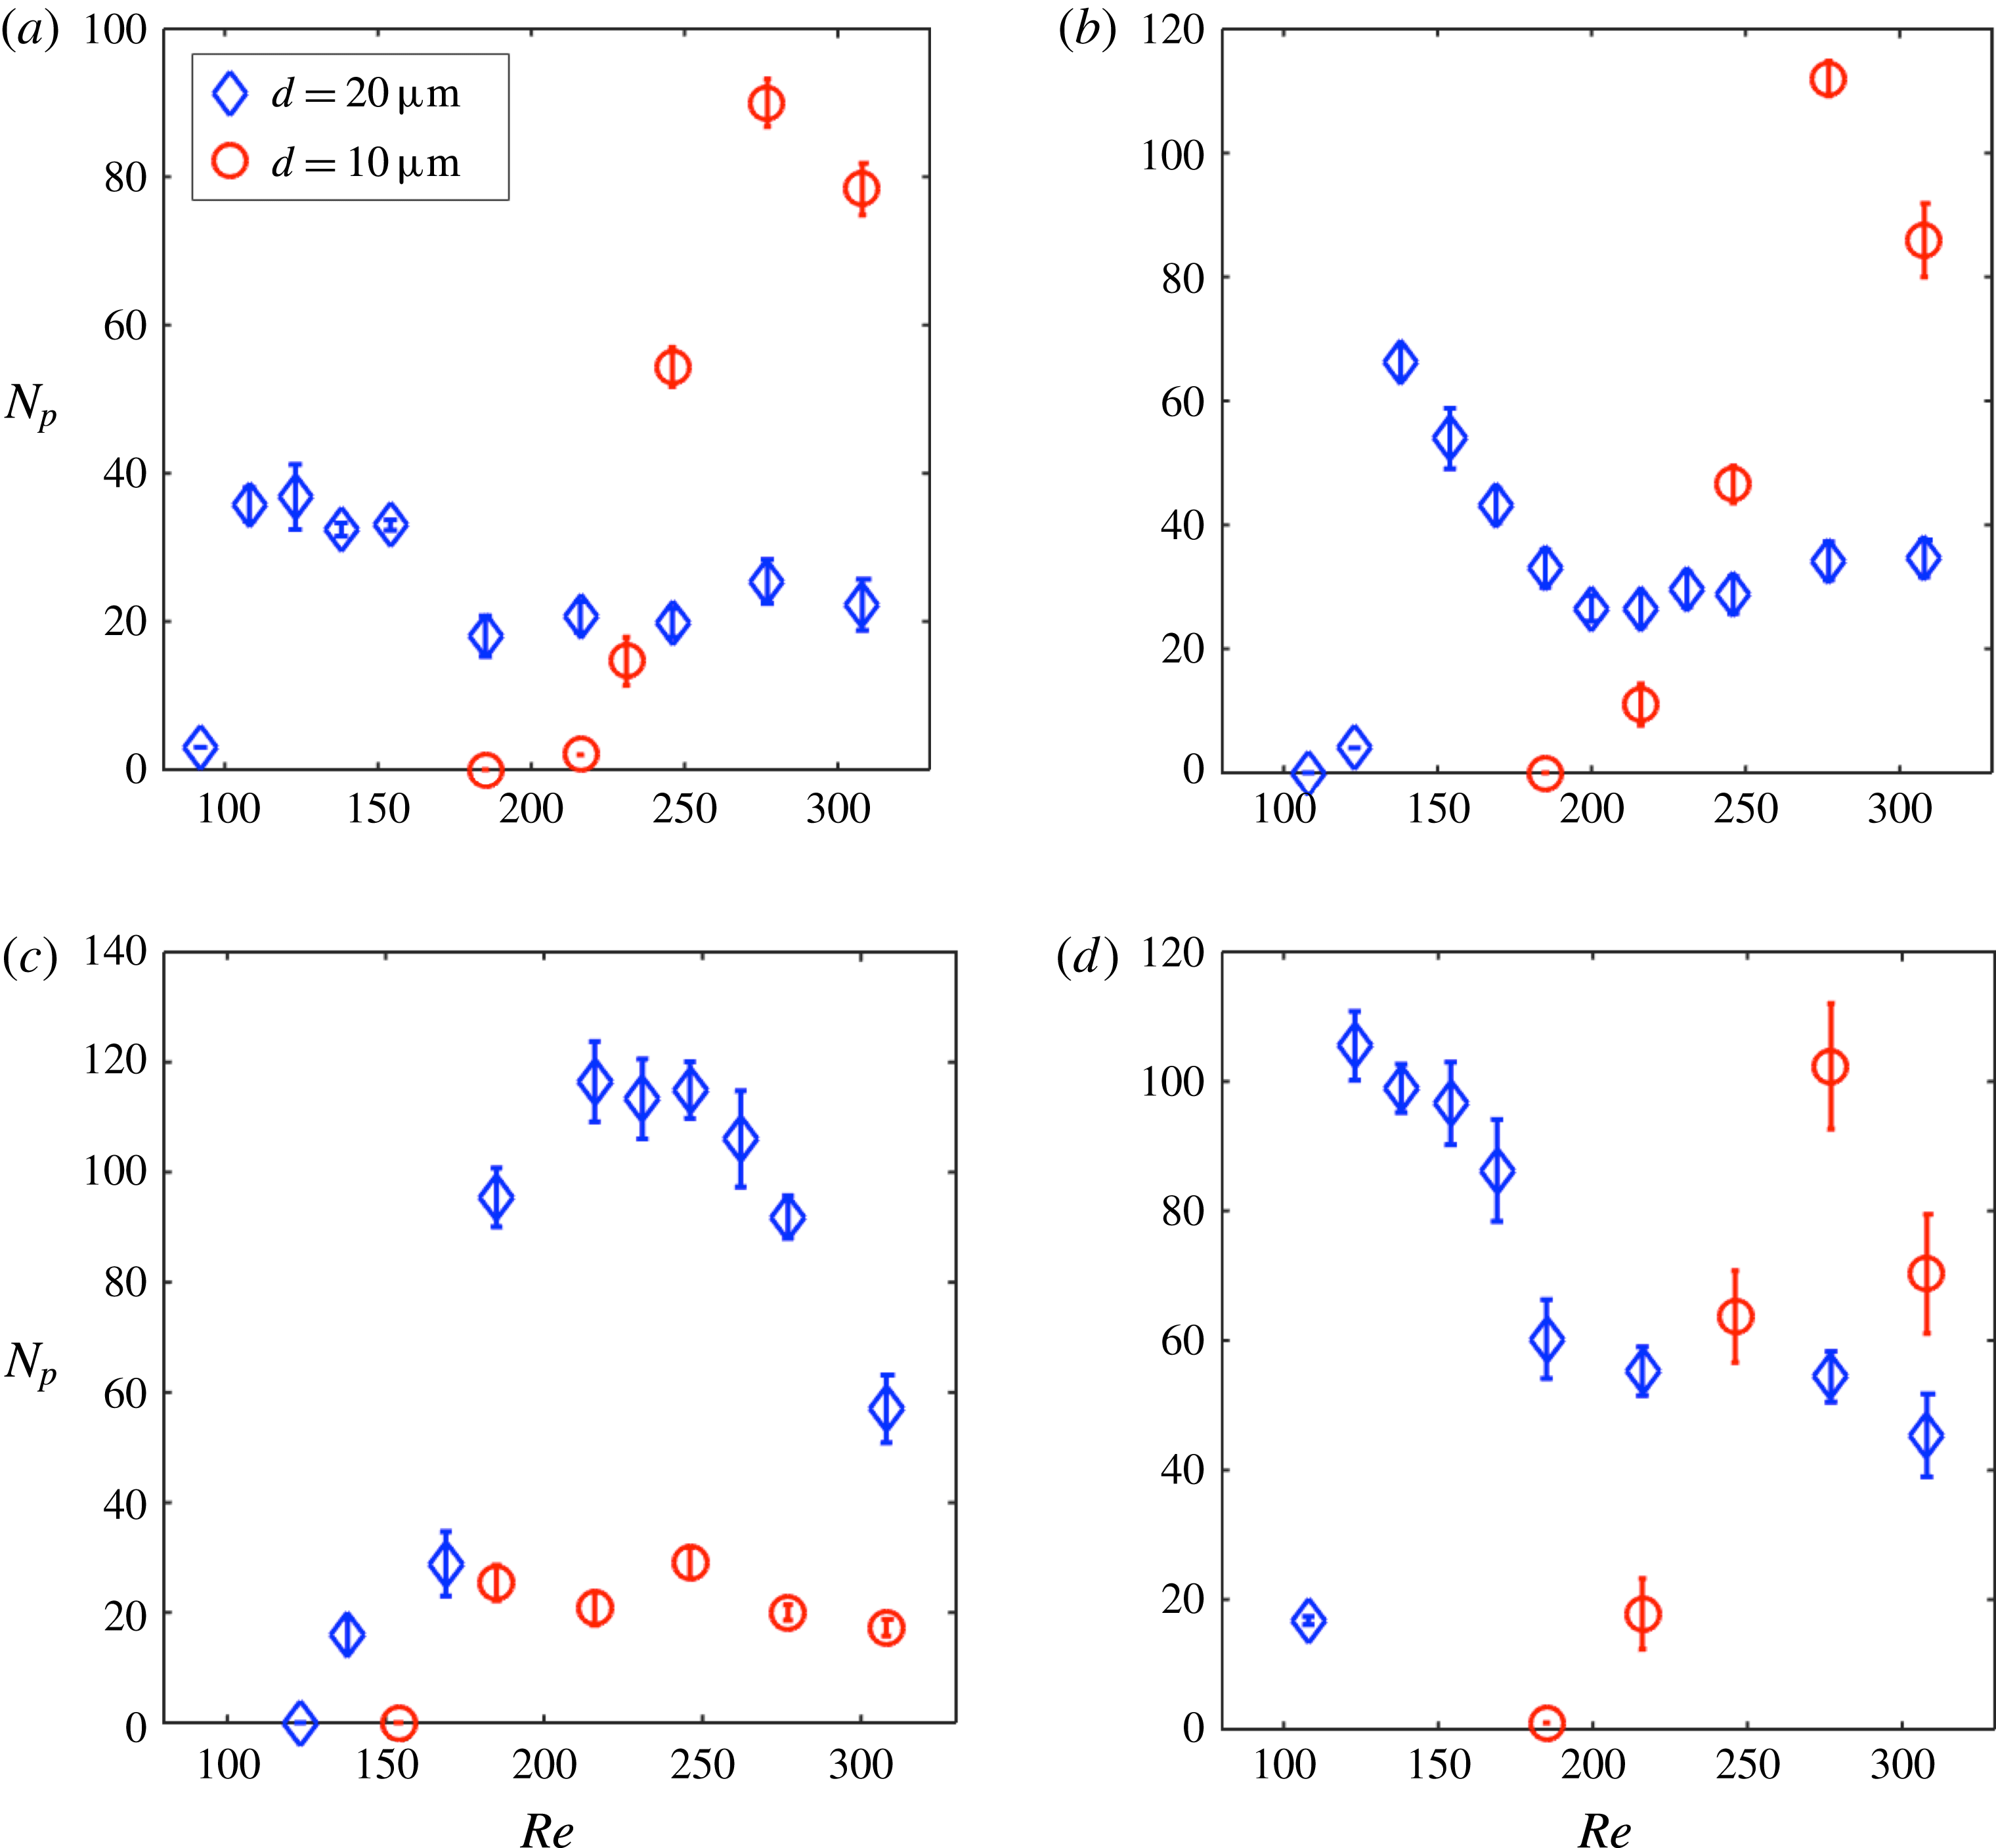
Figure 11 exhibits the effect of cavity aspect ratio
 $\unicode[STIX]{x1D706}$
on
 $N_{p}$
at different
 $Re$
. The error bar indicates fluctuation around the average in each experiment. The common feature of the variations of
 $N_{p}$
with
 $Re$
is formation of a maximum at a specific value of
 $Re$
, denoted as
 $Re_{max}$
. Increasing
 $Re$
beyond
 $Re_{max}$
results in reduction of
 $N_{p}$
. Both
 $Re_{max}$
and
 $N_{p}$
at
 $Re_{max}$
is higher for longer cavities (compare
 $\unicode[STIX]{x1D706}=2$
,
 $3$
and
 $5$
in figure 11
a). With increasing cavity width (compare
 $\unicode[STIX]{x1D706}=3$
,
 $2.02$
and
 $1.41$
in figure 11
b),
 $N_{p}$
increases without pronounced change of
 $Re_{max}$
. Therefore, a horizontal and vertical shift in particle entrapment is observed by increasing cavity length and width, respectively. Before further discussion of the effect of cavity aspect ratio
 $\unicode[STIX]{x1D706}$
on particle entrapment, we describe the particle entry and factors that influence migration of particles from the channel into the cavity.
The effect of cavity length (a) and width (b) on the maximum number of entrapped particles, i.e. cavity capacity. Cavity dimensions corresponding to different values of
 $\unicode[STIX]{x1D706}$
are stated in table 1.

7.2 Particle entrapment
In steady flow of pure fluids over unconfined cavities, molecular diffusion is the only mass transfer mechanism across the separatrix. Due to flow unsteadiness, lobes form on the separatrix and enhance convection of fluid mass between the cavity and free stream; a mechanism known as the lobe turnstile (Horner et al.
Reference Horner, Metcalfe, Wiggins and Ottino2002, Reference Horner, Metcalfe and Ottino2015). In K&G, the unsteadiness of pulsatile pressure-driven flow was employed to entrap populations of red blood cells inside the vortex of a tubular expansion. For flow of a
 $\unicode[STIX]{x1D719}=0.08$
suspension of neutrally buoyant hard spheres over a bluff body, fluctuations generated by collisions between particles result in particle exchange between the free stream and the recirculating flow (Haddadi et al.
Reference Haddadi, Shojaei-Zadeh, Connington and Morris2014, Reference Haddadi, Shojaei-Zadeh and Morris2016). In this work, we study flow of dilute suspensions at steady state. Therefore, unsteady infusion and collision between particles do not affect particle entry.
In this section we discuss factors affecting entrapment of particles in the cavities by revisiting the current explanations of the entry mechanism, which are based solely on inertial lift forces. We explain the combined effects of particle dynamics and flow morphology on particle entrapment. Although inertial lift force generates lateral migration towards the flow cell, we argue that the lift force cannot be distinguished from other hydrodynamic contributions on particle acceleration such as added mass force, motion in rapidly decelerating and accelerating flow and proximity to a plane wall.
7.2.1 Dynamics of entrapment
We discuss the dynamics of entrapped particles by studying the acceleration of particles flowing over the cavity. We first state the previous notion of particle entry mechanism, which is based on lift force induced migration of particles towards the vortex. The well-known effect of inertia in flow of dilute suspensions in a tube is the inertial migration, or accumulation of particles in an annular zone. The inertial migration in a tube, known as tubular pinch phenomenon has been first observed for inertial flow of dilute suspensions by Segré & Silberberg (Reference Segré and Silberberg1961, Reference Segré and Silberberg1962). The particle accumulation patterns depend on conduit geometry. Particles in a rectangular microchannel equilibrate at discrete focusing positions close to walls. The locations of focusing positions depend on the particle diameter, the channel size and
 $Re$
(Chun & Ladd Reference Chun and Ladd2006; Di Carlo et al.
Reference Di Carlo, Edd, Humphry, Stone and Tonner2009; Miura et al.
Reference Miura, Itano and Sugihara-Seki2014). The inertial migration phenomenon in conduits has been studied analytically, computationally and experimentally; mostly to explore dependence of the lateral force on fluid velocity, particle size and conduit dimensions (Ho & Leal Reference Ho and Leal1974; Asmolov Reference Asmolov1999; Matas et al.
Reference Matas, Glezer, Guazzelli and Morris2009; Di Carlo et al.
Reference Di Carlo, Edd, Humphry, Stone and Tonner2009; Miura et al.
Reference Miura, Itano and Sugihara-Seki2014; Hood et al.
Reference Hood, Lee and Roper2015). However, a mechanistic description for generation of lateral force on particles has not been proposed yet. The current explanations of inertial migration phenomenon are based on scaling arguments of the lift force. The same scaling arguments, which are based on the computational analysis of Di Carlo et al. (Reference Di Carlo, Edd, Humphry, Stone and Tonner2009), have been used to describe the particle entry into the vortex (Hur et al.
Reference Hur, Mach and Di Carlo2011; Sollier et al.
Reference Sollier, Go, Che, Gossett, O’Byrne, Weaver, Kummer, Rettig, Goldman and Nickols2014). According to scalings of the lift force, for a particle located close to the channel centreline the lift force scales as
 $F_{L}=(C_{L}\unicode[STIX]{x1D70C}_{f}U_{m}^{2}a^{3}/W_{c})$
, where
 $U_{m}$
is the maximum velocity of the fluid with density
 $\unicode[STIX]{x1D70C}_{f}$
,
 $a$
is the particle radius and
 $W_{c}$
is the channel size in the primary direction of the velocity gradient (
 $Y$
direction in the present work). Close to the channel wall, the wall lift force scales as
 $F_{W}=(C_{L}\unicode[STIX]{x1D70C}_{f}U_{m}^{2}a^{6}/W_{c}^{4})$
. For both
 $F_{L}$
and
 $F_{W}$
,
 $C_{L}$
specifies the lift coefficient. Due to the balance between velocity gradient and wall lift forces, particles equilibrate at inertial focusing positions in a close distance from the channel wall. In the abrupt flow expansion of the cavity, the wall lift force decreases and the particle is predominantly subjected to velocity gradient lift force; leading to a lateral motion towards the vortex.
In a straight conduit, fluid streamlines are parallel and the lateral particle acceleration can be attributed to inertial lift force. However, as it will be explained in the following, curvature of streamlines in flow over the cavity and motion towards the trailing cavity wall both contribute to the particle acceleration, therefore the lateral drift of particles towards the flow cell cannot merely be due to the effect of inertial lift. We refer to (6.1) to explain that in the cavity geometry, differentiating the hydrodynamic lift from other contributions on particle acceleration is not possible. Besides, the lift force arguments alone do not fully explain low particle entrapment at high
 $Re$
(
 $Re>Re_{max}$
). Although based on the lift force scalings, stronger lift force at higher
 $Re$
generates larger lateral migration and should lead to more entry, it is observed in figure 11 that the number of entrapped particles decreases at high
 $Re$
.
Velocity magnitude of an isolated
 $d=20~\unicode[STIX]{x03BC}\text{m}$
particle entering
 $\unicode[STIX]{x1D706}=3$
cavity along trajectory path at (a)
 $Re=123$
, (b)
 $Re=154$
, (c)
 $Re=246$
and (d)
 $Re=308$
. The velocity magnitude and particle trajectory are computed by image analysis of the high-speed camera recordings. The boundary between cavity and channel is indicated by the broken line.

In order to better discuss the particle dynamics in flow over the cavity, we present the acceleration of a
 $d=20~\unicode[STIX]{x03BC}\text{m}$
particle entering a
 $\unicode[STIX]{x1D706}=3$
cavity at
 $Re=123$
,
 $154$
,
 $Re=246$
and
 $Re=308$
. Figure 12 illustrates the velocity magnitude of the particle projected on the particle trajectory. We have obtained noisy values by computing the acceleration from image analysis of high-speed video recordings; therefore, we do not report the acceleration vector of particles. However, variation of velocity magnitude along the particle trajectory is indicative of acceleration. The particle deviates towards the flow cell and decelerates before entrapment. With increasing
 $Re$
, deflection of particle trajectory decreases and particle decelerates closer to the trailing wall, implying the possibility of particle–wall collision as an entry mechanism. We have examined the particle–wall collision by monitoring the trailing cavity wall at high frame rates (
 ${>}35\,000$
). Particle collision with the trailing wall has not been visually detected, as it can be observed in the movies provided in supplementary materials available at https://doi.org/10.1017/jfm.2016.709.
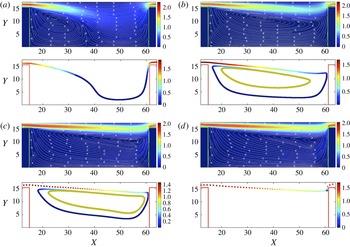
LBM simulations of particle trajectory and fluid velocity magnitude inside
 $\unicode[STIX]{x1D706}=3$
cavities at (a)
 $Re=74$
, (b)
 $Re=123$
, (c)
 $Re=230$
and (d)
 $Re=243$
. The velocity magnitudes are computed on a
 $z=1.73$
symmetry plane. The limit cycle orbit at
 $Re=123$
and
 $230$
is illustrated in the figures.

In addition to inertial lift force, which acts on the particle due to spatial variations of fluid velocity inside the channel, particle acceleration is affected by the background flow and particle motion towards the trailing cavity wall. Similar to flow over a wall-bounded backward facing step, abrupt deceleration of the fluid in the expansion region forms multiple flow separation zones in various locations, marked by vortex bubbles. In a backward facing step geometry, the primary vortex bubble covers the bottom wall of the step. A secondary vortex bubble forms on the upper wall downstream of the step (Williams & Baker Reference Williams and Baker1997). For a wall-confined cavity, the abrupt expansion at the leading cavity wall generates two flow separation zones. The primary separation region is the flow cell itself, extending between the leading and trailing cavity walls. The secondary separation region is not distinctly observed as a vortex bubble above the cavity in flow visualization experiments (figures 2 and 3). We use LBM simulations to demonstrate the location of the secondary separation zone. The LBM simulations of the fluid flow at various
 $Re$
are shown in figure 13. Fluid streamlines are overlain on the magnitude of fluid velocity at
 $Re=74,123,230$
and
 $245$
. The low velocity region on the top channel wall above the cavity corresponds to the second separation region. As it is seen in figure 13, the expansion and contraction of the geometry generates abrupt flow deceleration and acceleration and curvature of fluid streamlines above the vortex.
As we have discussed in § 2, particle inertia is represented by Stokes number
 $St=(\unicode[STIX]{x1D70C}_{p}/\unicode[STIX]{x1D70C}_{f})Re_{p}$
. For an inertial particle, the Stokes number can be defined as the ratio of inertial relaxation time of the particle
 $\unicode[STIX]{x1D70F}_{p}$
to the flow time scale
 $\unicode[STIX]{x1D70F}_{f}$
as
 $St=\unicode[STIX]{x1D70F}_{p}/\unicode[STIX]{x1D70F}_{f}$
(Subramanian & Brady Reference Subramanian and Brady2006). The inertial response time is proportional to the particle mass,
 $\unicode[STIX]{x1D70F}_{p}\sim m_{p}/6\unicode[STIX]{x03C0}\unicode[STIX]{x1D702}a$
, by assuming that the hydrodynamic drag is the only force on the particle (an assumption that does not exactly hold for a particle moving over a cavity). As opposed to a particle in Stokes flow with
 $\unicode[STIX]{x1D70F}_{p}=0$
, the inertial particles with finite mass and
 $\unicode[STIX]{x1D70F}_{p}>0$
do not respond to variations of flow direction instantly, leading to deviation from flow streamlines. Particularly in flow over cavities, deviation of particles from streamlines can be significant due to rapid deceleration and acceleration of the flow and streamline curvature. Other examples of deviation from streamlines induced by inertia are particle-laden flow in bifurcations (Manoorkar, Sedes & Morris Reference Manoorkar, Sedes and Morris2016) and particle–wall collision in T junction flows (Vigolo et al.
Reference Vigolo, Groffiths, Radl and Stone2013; Vigolo, Radl & Stone Reference Vigolo, Radl and Stone2014). In all the mentioned examples, sudden changes of the flow direction and velocity generates pronounced deviation in particle trajectories from fluid streamlines.
We describe hydrodynamic contributions on particle acceleration by referring to (6.1). It has been discussed in § 6 that undisturbed flow applies a force equivalent to
 $m_{f}\text{D}\boldsymbol{u}/\text{D}t|_{\boldsymbol{Y}(t)}$
on a sphere. The sphere can be a deformable fluid or a rigid particle. Rigidity and finite size generate additional hydrodynamic contributions on particle force; such as hydrodynamic drag, the added mass and the inertial lift force. The mentioned contributions to particle force result in deviation of the finite size particle from flow streamlines. Contribution of drag and added mass are directly included as separate terms in (6.1) (hydrodynamic drag in (6.1) is derived for a finite size particle in Stokes flow), however the effect of inertial lift on particle acceleration is implicitly stated in
 $\text{d}\boldsymbol{V}/\text{d}t$
terms. In addition to inertial lift force, particle acceleration
 $\text{d}\boldsymbol{V}/\text{d}t$
is affected by added mass forces, originating from acceleration of the surrounding fluid by the particle, and by hydrodynamic lubrication in proximity of the trailing wall. Therefore, as opposed to flow inside a straight conduit where lateral acceleration of particles can be related to the lift force, in particle flow over the cavity the streamline curvature, abrupt acceleration and deceleration of the background flow and particle motion towards the plane wall generate additional contributions to particle acceleration. The collective effect of all of these contributions are grouped in
 $\text{d}\boldsymbol{V}/\text{d}t$
term on the left-hand side of the equation of motion.
We explore the combined effects of particle dynamics and flow morphology on particle entrapment using LBM simulations. Figure 13 exhibits morphology of the flow cell inside a
 $\unicode[STIX]{x1D706}=3$
cavity along with trajectory of
 $\unicode[STIX]{x1D6FF}=0.5$
particles released inside the channel. The colour map specifies magnitude of particle velocity along trajectory. Particle dynamics and flow morphology inside the cavity at
 $Re=74$
are illustrated in figure 13(a). The initial separation between the particle surface and the channel wall before release is
 $h_{y}=0.0057d$
, which is the smallest achievable initial separation in our simulations. At
 $Re=74$
and for an incomplete flow cell, the particle does not enter the cavity. The combination of incomplete flow cell and insufficient lateral displacement of particle can result in particle passage without entrapment. It is also observed in figure 11 that the number of entrapped particles is zero for
 $Re<80$
, where an incomplete flow cell forms inside the
 $\unicode[STIX]{x1D706}=3$
cavity. Figure 13(b) exhibits the trajectory of a particle released in the upstream at
 $Re=123$
. The initial separation before release from rest is
 $h_{y}=0.06d$
. With further increase of
 $h_{y}$
, particle moves downstream without entrapment, therefore
 $h_{y}=0.06d$
is the largest initial separation leading to entrapment. The particle motion at
 $Re=123$
is affected by inertial lift force, which generates lateral motion and increases the proximity of the particle to the flow cell. Besides inertial lift force, rapid variations of flow direction and motion of the particle towards the trailing wall both contribute to particle deceleration before entrapment. Pronounced deceleration of particle before entrapment is observed in both LBM simulations of the particle trajectory (figure 13
b) and high-speed imaging of particle entry (figure 12
a). In figure 13(c), we demonstrate trajectory of the particle at
 $Re=230$
. The largest achievable initial separation leading to entry at
 $Re=230$
is
 $h_{y}=0.0076d$
. We have stated in § 6 that the attraction basin of the limit cycle trajectory extends to the channel. Comparing the values of
 $h_{y}$
for
 $Re=123$
and
 $230$
implies that with increasing
 $Re$
the size of the attraction basin inside the channel reduces to narrower regions in close proximity to the bottom channel wall. We also point out that particle deceleration before entrapment is more pronounced at intermediate
 $Re$
, i.e.
 $Re=123$
. By increasing the axial fluid velocity inside the channel at higher
 $Re$
, the deflection of particle trajectory towards the cavity reduces and deceleration occurs adjacent to the trailing cavity wall. With further increase of
 $Re$
to 245 and larger axial fluid velocity inside the channel, the particle shows less deflection towards the flow cell. The particle released from
 $h_{y}=0.0057d$
at
 $Re=245$
continues its motion downstream without entrapment. This implies that at higher
 $Re$
, the size of the attraction basin inside the channel reduces down to a narrow zone close to bottom channel wall which is not detectable by the resolution of our LBM simulations. The smaller size of the attraction basin inside the channel is manifested in the reduction of the number of entrapped particles at
 $Re>Re_{max}$
.
The streamline regions inside the channel entering the
 $\unicode[STIX]{x1D706}=3$
cavity at (a)
 $Re=74$
, (b)
 $Re=123$
, (c)
 $Re=140$
and (d)
 $Re=230$
. The shaded regions illustrate the streamline entry regions. The surface boundary of a particle equilibrated at the inertial focusing position is demonstrated by the dashed line. We show streamlines initiating from the entry region on bottom figures. Streamlines spiral into the cavity and leave downstream. Exchange of fluid mass implies breakdown of the separatrix that forms in unbounded flows. Movies in the supplementary material provide more details of cavity streamlines.

7.2.2 The separatrix breakdown
Wall confinement generates complex flow patterns around immersed objects. Changing streamline topology around spherical particles in Stokes flow (Zurita-Gotor, Blawzdziewicz & Wajnryb Reference Zurita-Gotor, Blawzdziewicz and Wajnryb2007), formation of vortices in T junctions (Vigolo et al. Reference Vigolo, Groffiths, Radl and Stone2013, Reference Vigolo, Radl and Stone2014) and secondary flows on transverse planes in microchannel flows (Amini et al. Reference Amini, Sollier, Masaeli, Yu, Ganapathysubramanian, Stone and Di Carlo2013) are among examples of confinement induced flow patterns. It was reported by Haddadi et al. (Reference Haddadi, Shojaei-Zadeh and Morris2016) that wall confinement in a microchannel forms spiralling flow which conveys the fluid mass between the wake and the free stream, consequently the well-defined separatrix around the wake breaks down. The ‘recirculating flow’ which appears behind bluff bodies in unconfined flow of the fluid is replaced by laminar ‘vortices’. Here, we present another example of separatrix breakdown in microchannel flows, mostly to address its effect on exchange of finite size particles. Absence of the separatrix significantly affects transfer of heat and mass in cellular flows and examination of its fluid dynamical details is outside the scope of the present study.
In order to discuss the effect of separatrix breakdown on entry of finite size particles, we first illustrate that fluid streamlines enter the cavity, spiral inside the cavity and leave towards downstream. Streamlines entering a
 $\unicode[STIX]{x1D706}=3$
cavity and their streaming location inside the channel are exhibited in figure 14. Entry regions are computed by tracing the streamlines, starting from various initial points on the
 $X=1$
plane inside the channel. Shaded zones illustrate streamline entry zones on the
 $X=1$
plane. We have also shown the boundary of the particle surface equilibrated at the inertial focusing location. The inertial equilibrium position is computed by LBM simulation of particle trajectories, similar to the procedure explained elsewhere (Kahkeshani et al.
Reference Kahkeshani, Haddadi and Di Carlo2016). We first discuss the effect of
 $Re$
on entry of streamlines into the cavity. It is observed in figure 14 that for all
 $Re$
, fluid streamlines which are close to side walls in the
 $Z$
direction enter the flow cell. At
 $Re=140$
, an additional entry region forms in the middle of the channel (
 $z=H/2$
). With increasing
 $Re$
, the size of the entry region in the middle of the channel increases.
The size of the streamline entry region inside the channel for (a)
 $\unicode[STIX]{x1D706}=2.02$
at
 $Re=123$
, (b)
 $\unicode[STIX]{x1D706}=3$
at
 $Re=123$
, (c)
 $\unicode[STIX]{x1D706}=5$
at
 $Re=123$
, (d)
 $\unicode[STIX]{x1D706}=2.02$
at
 $Re=230$
, (e)
 $\unicode[STIX]{x1D706}=3$
at
 $Re=123$
and (f)
 $\unicode[STIX]{x1D706}=5$
at
 $Re=230$
.

In addition to
 $Re$
, the size of the streamline entry regions depends on
 $\unicode[STIX]{x1D706}$
. Figure 15 illustrates dependence of streamline entry on
 $\unicode[STIX]{x1D706}$
at
 $Re=123$
and
 $230$
. While fluid entry zones with equal size form inside the channel for
 $\unicode[STIX]{x1D706}=2.02$
and
 $3$
cavities, the size of entry regions are different for
 $\unicode[STIX]{x1D706}=5$
cavities. Similar to formation of a complete flow cell inside a long cavity, which occurs at higher
 $Re$
(figure 2), forming middle channel streamline entry zones requires higher
 $Re$
.
Movies provided in the supplementary materials demonstrate more experimental and computational details of the streamlines in confined cavities. We focus our discussion on the possible effect of this phenomenon on particle exchange. The separatrix breakdown is an additional contribution leading to particle entrapment. However, as we have stated before, its effect cannot be distinguished from other factors, such as particle dynamics in the background flow. For instance, at
 $Re=140$
where the number of entrapped particles reaches a maximum, formation of the fluid entry region in the middle of the channel is an additional contribution to particle entry, compared to
 $Re=123$
where middle channel entry regions do not form.
Particle dynamics and vortex morphology at
 $Re_{max}$
for (a)
 $\unicode[STIX]{x1D706}=2.02$
(
 $Re_{max}=139$
), (b)
 $\unicode[STIX]{x1D706}=3$
(
 $Re_{max}=139$
) and (c)
 $\unicode[STIX]{x1D706}=5$
(
 $Re_{max}=216$
) cavity. Particle velocity along trajectory exhibits deceleration before entrapment. Formation of a complete flow cell inside a longer cavity requires higher
 $Re$
, leading to larger
 $Re_{max}$
for
 $\unicode[STIX]{x1D706}=5$
cavity.

In this section, we have expanded our explanations to the previous mechanism of particle entry by pointing out that particle entrapment should be viewed as the combination of vortex morphology and particle dynamics. Inertial lift force alone does not fully explain formation of the maximum in the number of entrapped particles (figure 11). We demonstrated in figure 15 that size of streamline entry regions inside the channel depends on cavity length and
 $Re$
. For cavities with identical length and different widths, i.e.
 $\unicode[STIX]{x1D706}=2.02$
and
 $3$
cavities, the size of the streamline entry regions and
 $Re$
required to form a complete flow cell is the same. With increasing length, the complete flow cell forms at a higher
 $Re$
. In order to show the combined effects of particle dynamics and flow cell morphology on entrapment, we compare fluorescent images of the cavity streamlines and particle trajectories at
 $Re_{max}$
in figure 16. Qualitatively, at
 $Re_{max}$
the flow cell is complete and its core is located almost in the middle for all cavities. Particle trajectory deviates towards the vortex and particle decelerates by approaching the trailing wall. Considering that formation of the complete flow cell inside the longer cavities requires higher
 $Re$
, a shift in maximum entrapment is observed with increasing cavity length.
We remind the reader that in addition to combined effects of particle dynamics, vortex morphology and separatrix breakdown, distribution of particles inside the channel also affects the particle entry. Particles are positioned close to the channel wall due to inertial migration before reaching the cavity (Chun & Ladd Reference Chun and Ladd2006; Di Carlo et al.
Reference Di Carlo, Edd, Humphry, Stone and Tonner2009). The number of inertial focusing positions depends on the geometry of the channel cross-section and
 $Re$
(Miura et al.
Reference Miura, Itano and Sugihara-Seki2014; Nakagawa et al.
Reference Nakagawa, Yabu, Otomo, Atsushi, Masato, Tamoaki and Sugihara-Seki2015). We have not changed the size of the channel cross-section, therefore the particle distribution does not vary in the range of
 $Re$
studied in this work (
 $Re\leqslant 308$
). Besides, we point out without presenting the results that LBM simulations ascertain invariance of the location of inertial focusing positions in the range of
 $Re$
studied in this work.
7.2.3 Cavity depletion
The interaction between multiple entrapped particles leads to motion fluctuations and deviation from the stable limit cycle trajectories. We study the influence of fluctuations by monitoring the average distribution of particles inside the
 $\unicode[STIX]{x1D706}=3$
cavity over a time span of 10 min. The average distributions are exhibited in figure 17 along with the limit cycle trajectory of an isolated particle. Particles tend to move on the limit cycle orbit, however hydrodynamic interactions between particles generate deviation from the stable orbit. Consequently, particle distributions form a spread around the limit cycle orbit of an isolated particle, which is shown in the figure 17.
Distribution of multiple particles inside
 $\unicode[STIX]{x1D706}=3$
cavities over 10 min at (a)
 $Re=123$
, (b)
 $Re=216$
and (c)
 $Re=308$
. Due to the tendency of particles to form the limit cycle trajectory and interaction between multiple particles, a distribution forms around the limit cycle trajectory.

Depletion rate of (a)
 $\unicode[STIX]{x1D706}=2.02$
, (b)
 $\unicode[STIX]{x1D706}=3$
and (c)
 $\unicode[STIX]{x1D706}=5$
cavities after entrapment at
 $Re_{max}$
and stoppage of the suspension flow. The flow cell is maintained by flow of the buffer solution. The initial number of particles inside the cavities is equal to the number of entrapped particles at
 $Re_{max}$
for each cavity.

Deviation from the limit cycle orbit can result in particle exit and depletion of the cavity. Particle exit starts after entrapment of multiple particles; however, the average number of particles inside the cavity does not change considering that the lost particles are replaced by new entry from the channel. We have experimentally studied cavity depletion by populating the cavities at
 $Re_{max}$
. After reaching the maximum entrapment, suspension flow is stopped and buffer solution is infused at the specified
 $Re$
from the second inlet to maintain the flow cell. The number of particles inside the cavity is monitored after stoppage of suspension flow. In figure 18, we present depletion rate for
 $\unicode[STIX]{x1D706}=2.02$
,
 $\unicode[STIX]{x1D706}=3$
and
 $\unicode[STIX]{x1D706}=5$
cavities. The time is made dimensionless using the time scale of one complete cycle on the limit cycle orbit at each
 $Re$
. It is observed that after stoppage of suspension flow and due to the presence of a large number of particles inside the cavity, particles exit the flow cell at high rate. The rate of depletion diminishes by decreasing the number of particles inside the cavity. Considering that deviation of particles from the stable limit cycle trajectory depends on the number of particles, reduction of the number of particles inside the cavity leads to less depletion. Conducting depletion experiments by entrapping small number of particles (
 ${<}10$
) shows that the depletion rate approaches zero. Although increasing
 $Re$
leads to relatively faster depletion, cavities should be monitored for significantly longer times to reach the zero depletion rate. The monitoring time is limited by capacity of syringe and quota on size of recorded images. Therefore, we do not provide any conclusion about the final number of particles inside the cavities at each
 $Re$
and time required to reach zero depletion. The alternative approach to conduct depletion experiments is loading the cavity at each
 $Re$
(rather than loading at
 $Re_{max}$
) and monitoring the depletion rate after stopping the suspension flow. By using this method, the number of particles initially present in the cavity varies for each
 $Re$
. However, a same conclusion regarding the dependence of depletion rate on the number of entrapped particles is reached.
7.3 Size selective particle entrapment
Here we discuss an important characteristic of confined cavities in inertial microfluidics which has been utilized for size selective separation of particles from a polydisperse mixture. We have shown in figure 8 that the limit cycle orbit of small particles forms closer to the outer boundaries of the vortex. We have explained that migration of small particles towards the vortex boundaries is due to the smaller lift force which generates weaker inward migration. We present that particle entrapment depends on particle diameter, a feature which can be used for size-selective particle separation.
Cavity capacity of (a)
 $\unicode[STIX]{x1D706}=2$
, (b)
 $\unicode[STIX]{x1D706}=3$
, (c)
 $\unicode[STIX]{x1D706}=5$
and (d)
 $\unicode[STIX]{x1D706}=2.02$
for
 $d=10~\unicode[STIX]{x03BC}\text{m}$
and
 $d=20~\unicode[STIX]{x03BC}\text{m}$
particles. At
 $Re=Re_{max}$
of
 $d=20~\unicode[STIX]{x03BC}\text{m}$
particles,
 $d=10~\unicode[STIX]{x03BC}\text{m}$
particles are not captured at
 $\unicode[STIX]{x1D706}=2$
,
 $3$
and
 $2.02$
. Increasing the length reduces the size selectivity.

In figure 19 we exhibit the number of entrapped particles in
 $\unicode[STIX]{x1D706}=2$
,
 $3$
,
 $5$
and
 $2.02$
cavities for
 $d=10$
and
 $20~\unicode[STIX]{x03BC}\text{m}$
particles. At each cavity aspect ratio, two distinct
 $Re_{max}$
are observed, corresponding to maximum entrapment for each particle size. Larger particles can be captured at lower
 $Re$
. One possible explanation for the distinction between
 $Re_{max}$
of large and small particles is based on size dependency of the lateral lift force. The magnitude of the lateral lift force is larger on a large particle, leading to closer proximity of particle to the vortex and particle entrapment at smaller
 $Re$
. We point out that similar to the explanations for
 $d=20~\unicode[STIX]{x03BC}\text{m}$
particles, interaction between particle dynamics, flow morphology and location of inertial focusing position inside the channel should also be considered in studying entrapment.
8 Concluding remarks
In this work we have shown that finite size particles form stable limit cycle trajectories inside confined cavities. We discussed the effect of cavity aspect ratio (
 $\unicode[STIX]{x1D706}=L/W$
) and
 $Re$
on topology of the limit cycle orbit. We qualitatively explained that a finite size particle migrates outward in the flow cell. The inertial lift force
 $F_{L}$
which scales with particle size (
 $F_{L}\sim d^{3}$
Di Carlo et al. (Reference Di Carlo, Edd, Humphry, Stone and Tonner2009),
 $F_{L}\sim d^{4}$
Hood et al. (Reference Hood, Lee and Roper2015)), generates inward migration opposing the outward migration of particles towards vortex boundaries. The limit cycle trajectory of a small particle forms closer to the vortex outer boundary and with increasing diameter, the particle orbits closer to the vortex core. In the absence of interaction between multiple particles, the particle motion on the limit cycle is stable. Our detailed discussions of the limit cycle trajectory, clarify the reason for significantly longer residence time of large particles inside the vortex, observed for the first time by Karino & Goldsmith (Reference Karino and Goldsmith1977). Formation of the stable limit cycle trajectory is important in biological and industrial applications, such as retention zones inside aneurysms and cleansing of indented surfaces from particulate pollutants.
We discussed that due to large
 $Re_{p}$
, inertial contributions on particle acceleration should be fully considered. We described the particle entry as the collective effect of flow morphology, particle acceleration and fluid exchange between the cavity and the channel, induced by wall confinement. However, distinct effect of each contribution is not clearly known. Although inertial lift forces generate lateral migration, leading to closer proximity of the particle and vortex, their effect is combined with other hydrodynamic contributions on particle acceleration such as added mass, proximity to wall and varying drag. At low
 $Re$
, small number of particles are entrapped due to combined effects of insufficient lateral migration of particles and small vortex size. With increasing
 $Re$
, entrapment of particles inside the flow cell is due to inertial lift force, deviation of particles from flow streamlines due to other hydrodynamic contributions and exchange of fluid between the cavity and channel. An inertial particle with
 $\unicode[STIX]{x1D70F}_{p}>0$
, does not instantaneously respond to steep changes of flow direction and continues its motion towards the flow cell. At high
 $Re$
, particles tend to follow the axial flow inside the channel, without manifesting sufficient deviation towards the vortex.
We have examined the effect of cavity aspect ratio and
 $Re$
on the number of entrapped particles. It has been observed that for each
 $\unicode[STIX]{x1D706}$
, the number of entrapped particles is maximized at a specific
 $Re$
, denoted by
 $Re_{max}$
. With increasing cavity length the number of particles inside the cavity increases and
 $Re_{max}$
shifts to higher values, i.e. a horizontal shift. With increasing the width, the number of entrapped particles increases, without a significant change of
 $Re_{max}$
(vertical shift).
Collisions between multiple entrapped particles generates deviation from stable limit cycle orbit and particles exit the cavity. We have examined particle exit and discussed that the depletion depends on the number of particles inside cavities. Finally, we have shown that the particle entrapment inside the cavities depends on the size of particles and by adjusting
 $Re$
, it is possible to entrap particles based on their size. This result can be used for separation of large human cells from a background of blood cells.
Acknowledgements
This work has been supported by the Office of Naval Research and Vortex Bioscience. The authors would like to thank Dr E. Sollier of Vortex Bioscience.
Supplementary movies
Supplementary movies are available at https://doi.org/10.1017/jfm.2016.709.