1. Introduction
The structural style and kinematic evolution of foreland fold-and-thrust belts become complex to understand when viscous salt in the sedimentary pile decouples deformation between the basement and the overburden. The interaction between pre-existing basement structures and the overlying salt layer is a major controlling factor in the deformation of different tectonosedimentary basins worldwide (Table 1; Misra & Mukherjee, Reference Misra and Mukherjee2015). Several studies have discussed the effect of basal décollement (Cotton & Koyi, Reference Cotton and Koyi2000; Bahroudi & Koyi, Reference Bahroudi and Koyi2003; Sherkati et al. Reference Sherkati, Letouzey and Frizon de Lamotte2006; Misra & Mukherjee, Reference Misra and Mukherjee2015; Farzipour-Saein & Koyi, Reference Farzipour-Saein and Koyi2016) and basement steps (Farzipour-Saein et al. Reference Farzipour-Saein, Nilfouroushan and Koyi2013; Tong et al. Reference Tong, Koyi, Huang and Zhao2014; Burberry & Swiatlowski, Reference Burberry and Swiatlowski2016; Lacombe & Bellahsen, Reference Lacombe and Bellahsen2016; Godin et al. Reference Godin, Roche, Waffle and Harris2019; Razavi Pash et al. Reference Razavi Pash, Davoodi, Mukherjee, Dehsarvi and Ghasemi-Rozveh2021 a) on the deformation of fold-and-thrust belts. Moreover, the spatial configuration and geometry of the deformation front of fold-and-thrust belts are affected by surface processes (sedimentation and erosion) (Storti & McClay, Reference Storti and McClay1995; Koyi & Maillot, Reference Koyi and Maillot2007; Pla et al. Reference Pla, Roca, Xie, Izquierdo-Llavall, Muñoz, Rowan and Huang2019) and transverse strike-slip basement fault (Hessami et al. Reference Hessami, Koyi and Talbot2001 a; Sepehr & Cosgrove, Reference Sepehr and Cosgrove2004; Farzipour-Saein et al. Reference Farzipour-Saein, Yassaghi, Sherkati and Koyi2009). However, complex geological settings in which the pre-contractional relation between the basement steps and overlaying ductile layers is affected by the subsequent shortening in fold-and-thrust belts is poorly understood.
A summary of previous publications that have evaluated effective parameters describing the structure style of the basin

The Dezful Embayment is one of the most productive oil provinces in the world. It contains 45 oilfields with > 360 billion barrels of oil in place and 8% of the global oil reserves (Bordenave & Hegre, Reference Bordenave and Hegre2005, Reference Bordenave, Hegre, Leturmy and Robin2010; Vergés et al. Reference Vergés, Saura, Casciello, Fernandez, Villaseñor, Jimenez-Munt and García-Castellanos2011). The South Dezful Embayment (SDE) in the Zagros foreland folded belt provides a good example of how the basement structural highs affect the overlying strata (Sherkati & Letouzey, Reference Sherkati and Letouzey2004; Farahzadi et al. Reference Farahzadi, Alavi, Sherkati and Ghassemi2019; Noori et al. Reference Noori, Mehrabi, Rahimpour-Bonab and Faghih2019; Vatandoust et al. Reference Vatandoust, Faghih, Burberry and Shafiei2020). Reactivation of Precambrian basement structures during Phanerozoic time influenced the tectonic history, geometry and deposition of the sedimentary cover (e.g. Edgell, Reference Edgell1992; Stewart et al. Reference Stewart, Muslem and Wibisono2018). The Kharg-Mish Palaeo-high (KMPH), one of the main structures in the SDE, is a gently elongated N–NE-trending basement structure extending to the Iranian sector of the NW Persian Gulf (Stewart, Reference Stewart2018; Farahzadi et al. Reference Farahzadi, Alavi, Sherkati and Ghassemi2019). It has been proposed that reactivation of the KMPH during Phanerozoic time has controlled the lateral facies changes and overburden thickness variations in the SDE (McQuillan Reference McQuillan1991; Motiei, Reference Motiei1994, Reference Motiei1995; Sherkati & Letouzey, Reference Sherkati and Letouzey2004).
In this article, we address three main issues: (i) the impact of the basement structural high on the geometry and thickness variation of the overlaying sedimentary pile in the SDE; (ii) how the KMPH controlled the structural style and folding of the SDE; and (iii) how the pre-contractional configuration of the KMPH affected the spatial variation and the geometry of the deformation front of the Zagros fold-and-thrust belt. We utilize seismic and stratigraphic data from > 300 wells, isopach maps and field observations to reconstruct the structural evolution and fold styles of the SDE. The kinematic evolution is addressed using scaled-analogue models of contractional setting with a pre-existing basement high.
2. Structures and stratigraphy
The Late Cretaceous – Palaeogene Alpine Orogeny closed the Neo-Tethyan Ocean between north Gondwana and south Laurasia margins and developed the Zagros Fold-and-Thrust Belt (ZFTB). The belt spans c. 2000 km from SE Turkey to Oman (Stöcklin, Reference Stöcklin, Mattox and Holser1968; Falcon, Reference Falcon1974; Berberian & King Reference Berberian and King1981; Alavi Reference Alavi1994, Reference Alavi2007; Vergés et al. Reference Vergés, Saura, Casciello, Fernandez, Villaseñor, Jimenez-Munt and García-Castellanos2011; Mouthereau et al. Reference Mouthereau, Lacombe and Vergés2012). The ZFTB is a 25° oblique transpression zone between the Afro-Arabian continent and the Iranian microcontinent (Sarkarinejad & Azizi, Reference Sarkarinejad and Azizi2008). The contractional reactivation of N–S- to NW–SE-trending basement structures inherited from the north Gondwana passive margin divides the ZFTB into different tectonostratigraphic zones. These basement structures are attributed to the 670–570-Ma Pan-African orogeny (e.g. Stöcklin, Reference Stöcklin, Mattox and Holser1968; Sarkarinejad & Goftari, Reference Sarkarinejad and Goftari2019).
Generally, from the NE to SW the ZFTB is divided into six main sub-parallel belts: (i) the Urumieh–Dokhtar Volcanic Arc (UDVA); (ii) Sanandaj–Sirjan Metamorphic Belt; (iii) imbricated zone; (iv) Zagros foreland Fold-and-Thrust Belt (High Zagros Belt); (v) Zagros foreland folded belt; (vi) the Mesopotamian–Persian Gulf Foreland Basin (e.g. Vergés et al. Reference Vergés, Saura, Casciello, Fernandez, Villaseñor, Jimenez-Munt and García-Castellanos2011; Sarkarinejad & Goftari, Reference Sarkarinejad and Goftari2019; Fig. 1). The Dezful Embayment in the central part of the Zagros foreland folded belt formed in the footwall of the Mountain Front Flexure (MFF), a fault zone rooted from a NW–SE-aligned basement step, and between two transverse basement faults of the Kazerun Fault to the SE and Bala Rud to the NW (Fig. 1; e.g. Alavi, Reference Alavi1994; Mouthereau et al. Reference Mouthereau, Lacombe and Vergés2012).
Main structural elements of the central part of the Zagros foreland folded belt and the Zagros foreland fold-and-thrust belt. Black rectangle: study area in Figure 3. The inset map shows the location of the region on the geological map of Iran. BFZ – Bala Rud Fault Zone; D – Dorood oilfield; Gs – Gachsaran oilfield; HBPH – Hendijan-Bahregansar Palaeo-high; HPH – Helleh Palaeo-high; HZF – High Zagros Fault; IFZ – Izeh Fault Zone; KMPH – Kharg-Mish Palaeo-high; KZF – Kazerun Fault Zone; MFF – Mountain Front Flexure; MZT – Main Zagros Thrust; SS HP-LT MB – Sanandej–Sirjan high-pressure–low-temperature Metamorphic Belt; SS HT-LP MB – Sanandej–Sirjan high-pressure–low-temperature Metamorphic Belt; UDVA – Uromieh–Dokhtar Volcanic Arc; ZDF – Zagros Deformation Front; ZSZ – Zagros Suture Zone. Modified after Berberian (Reference Berberian1995), Edgell (Reference Edgell1996), Stewart et al. (Reference Stewart, Muslem and Wibisono2018), Perotti et al. (Reference Perotti, Carruba, Rinaldi, Bertozzi, Feltre and Rahimi2011), Soleimany et al. (Reference Soleimany, Poblet, Bulnes and Sàbat2011), Tavakoli-Shirazi et al. (Reference Tavakoli-Shirazi, Frizon de Lamotte, Wrobel-Daveau and Ringenbach2013), Jahani et al. (Reference Jahani, Hassanpour, Mohammadi-Firouz, Letouzey, de Lamotte, Alavi and Soleimany2017), Derikvand et al. (Reference Derikvand, Alavi, Abdullahie Fard and Hajialibeigi2018) and Sarkarinejad & Goftari (Reference Sarkarinejad and Goftari2019).

Since Proterozoic time, the Dezful Embayment has endured various tectonic events (e.g. Sherkati & Letouzey, Reference Sherkati and Letouzey2004; Stewart, Reference Stewart2018; Stewart et al. Reference Stewart, Muslem and Wibisono2018). One of the important events that occurred after the consolidation of the Arabian shield was the late Phanerozoic extensional strike-slip phase known as Najd rifting (Husseini, Reference Husseini1988, Reference Husseini1989; Talbot & Alavi, Reference Talbot, Alavi, Alsop, Blundell and Davison1996; Al-Husseini, Reference Al-Husseini2000; Bahroudi & Talbot, Reference Bahroudi and Talbot2003). During this phase, several shallow pull-apart basins with different strikes (mainly N–S-trending) controlled the epicontinental deposition of the late Phanerozoic – early Cambrian evaporites of the Hormuz/Hormoz series (e.g. Edgell, Reference Edgell1996; Mukherjee et al. Reference Mukherjee, Talbot and Koyi2010, Mukherjee, Reference Mukherjee2011; Stewart, Reference Stewart2018). Several studies on the fold style and geometry of the Dezful Embayment suggest the presence of a detachment layer at the base of the sedimentary cover (e.g. Colman-Sadd, Reference Colman-Sadd1978; Carruba et al. Reference Carruba, Perotti, Buonaguro, Calabrò, Carpi and Naini2006; Heydarzadeh et al. Reference Heydarzadeh, Ruh, Vergés, Hajialibeigi and Gharabeigli2020). The outcrops of Hormuz salt in the northern border of the Izeh zone (e.g. Kent, Reference Kent1979; Tavakoli-Shirazi et al. Reference Tavakoli-Shirazi, Frizon de Lamotte, Wrobel-Daveau and Ringenbach2013; Jahani et al. Reference Jahani, Hassanpour, Mohammadi-Firouz, Letouzey, de Lamotte, Alavi and Soleimany2017), and the deep-seated salt domes in Abadan plain (e.g. Edgell, Reference Edgell1996; Abdullahie Fard et al. Reference Abdullahie Fard, Braathen, Mokhtari and Alavi2006) and the north of the Persian Gulf close to the SDE (e.g. Edgell, Reference Edgell1991; Soleimany et al. Reference Soleimany, Poblet, Bulnes and Sàbat2011; Stewart, Reference Stewart2018), all represent further evidence of the presence of the Hormuz salt around the Dezful Embayment (Fig. 1).
Based on the limited outcrops in the High Zagros, the Hormuz basin is overlain by a shallow-marine platform environment characterized by pre-Carboniferous shale and sandstone deposits (e.g. Stampfli & Borel, Reference Stampfli and Borel2002; Perotti et al. Reference Perotti, Carruba, Rinaldi, Bertozzi, Feltre and Rahimi2011). The characteristics of Palaeozoic rocks in the study area are not specified because of the lack of outcrops and well data.
Due to the vast Carboniferous unconformity (e.g. Faqira et al. Reference Faqira, Rademakers and Afifi2009; Asl et al. Reference Asl, Faghih, Mukherjee and Soleimany2019) as a result of Hercynian orogeny in the north Gondwana margin, Cambrian–Carboniferous thicknesses and tectonostratigraphy are unclear (e.g. Konert et al. Reference Konert, Afifi, Al-Hajri, de Groot, Al Naim and Droste1999; Stewart, Reference Stewart2018). The Hercynian orogeny locally eroded the Palaeozoic mega-sequence resulting in the direct deposition of Permo-Mesozoic rocks over the basement (e.g. Faqira et al. Reference Faqira, Rademakers and Afifi2009; Riahi et al. Reference Riahi, Sarkarinejad, Faghih, Soleimany and Payrovian2021). Permo-Triassic sea progression is determined by the deposition of basal red conglomerates and sandstones of the Faraghan Formation (Alavi, Reference Alavi2007). The opening of the Neo-Tethyan Ocean during the Permo-Triassic separated the north Gondwana margin to the SW from the south Laurasia margin to the NE. During this period, very shallow-marine carbonates of the Dalan and Kangan formations (Dehram Group), one of the main gas reservoirs in the ZFTB, were deposited in the NE passive margin of the Afro-Arabian Plate (Alavi, Reference Alavi2004; Sepehr & Cosgrove, Reference Sepehr and Cosgrove2004). Extensional passive margin faults of the north Gondwana margin led to a NW–SE-trending facies boundary at the rifting stage, in which the Dashtak evaporites formation changes to the Khanehkat carbonates formation from the Dezful Embayment towards the NE of the ZFTB (e.g. Setudehnia, Reference Setudehnia1978; Szabo & Kheradpir, Reference Szabo and Kheradpir1978; Sherkati et al. Reference Sherkati, Letouzey and Frizon de Lamotte2006).
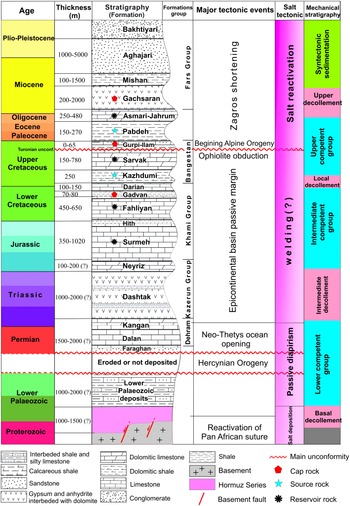
Triassic Dashtak evaporites act as the main intermediate décollement in most parts of the ZFTB during the contractional episode (Abdullahie Fard et al. Reference Abdullahie Fard, Braathen, Mokhtari and Alavi2006; Sepehr et al. Reference Sepehr, Cosgrove and Moieni2006; Vergés et al. Reference Vergés, Saura, Casciello, Fernandez, Villaseñor, Jimenez-Munt and García-Castellanos2011; Motamedi et al. Reference Motamedi, Sherkati and Sepehr2012; Najafi et al. Reference Najafi, Yassaghi, Bahroudi, Vergés and Sherkati2014). Facies and thickness of Jurassic – Lower Cretaceous sediments vary laterally across the Kazerun and Izeh fault zones towards the Dezful Embayment. Carbonate facies of the Surmeh Formation in the Fars zone changes to Adaiyeh, Mus, Alan, Sargelu, Najmeh, Gotnia and Garau formations in the Lurestan zone and North Dezful Embayment (e.g. Setudehnia, Reference Setudehnia1978; Farahzadi et al. Reference Farahzadi, Alavi, Sherkati and Ghassemi2019). In the study area, the Jurassic – Lower Cretaceous Khami Group including Surmeh, Hith, Fahliyan, Gadvan and Dariyan formations have been drilled by several wells. An unconformity related to the rifting of the Neo-Tethyan ocean separated this mega-sequence from Permo-Triassic sequences (Berberian & King, Reference Berberian and King1981; Koop & Stoneley, Reference Koop and Stoneley1982; Alavi, Reference Alavi2007). The Albian shales of the Kazhdumi Formation, one of the most important source rocks in the ZFTB, unconformably overlie the Jurassic – Lower Cretaceous mega-sequences. This formation has an average thickness of 250 m and acts as a local dećollement. Before the Turonian unconformity, a mega-sequence of carbonates including Sarvak and Ilam formations was deposited in a shallow continental shelf basin (Alavi, Reference Alavi2004). The first stage of the Alpine Orogeny, with the onset of ophiolitic obduction during Late Cretaceous (Turonian) time (Moghadam et al. Reference Moghadam, Stern, Chiaradia and Rahgoshay2013), created an important unconformity (Abdullahie Fard et al. Reference Abdullahie Fard, Braathen, Mokhtari and Alavi2006; Farahzadi et al. Reference Farahzadi, Alavi, Sherkati and Ghassemi2019). Late Cretaceous shallow-marine carbonates to continental siliciclastic deposits derived from the Zagros hinterland overlaid the Turonian unconformity (Alavi, Reference Alavi2004) (Fig. 2). The Late Cretaceous – Eocene marine shales, marls and marly limestones of the Pabdeh and Gurpi formations are the source rocks supplying oil to the Asmari Formation reservoir. These formations in the ZFTB and study area act as local décollement (e.g. Carruba et al. Reference Carruba, Perotti, Buonaguro, Calabrò, Carpi and Naini2006; Farzipour-Saein & Koyi, Reference Farzipour-Saein and Koyi2016).
Tectonostratigraphic column of the South Dezful Embayment based on surface and subsurface data. The right-hand-side column provides a general description of the mechanical rheology. Competent units are separated by several incompetent units acting as décollements. Modified after Alavi (Reference Alavi2004), Sherkati & Letouzey (Reference Sherkati and Letouzey2004), Abdullahie Fard et al. (Reference Abdullahie Fard, Braathen, Mokhtari and Alavi2006) and Soleimany et al. (Reference Soleimany, Poblet, Bulnes and Sàbat2011).

The Oligocene – early Miocene shallow-marine 250–450-m-thick Asmari Formation, the most important reservoir rock, covers the Pabdeh Formation in the study area (Fig. 2). The Miocene–Pleistocene Fars Group includes the Gachsaran, Mishan, Aghajari and Bakhtiyari formations as the post-collision transgressive sequence of the Zagros Orogeny with > 5000 m thickness (Pirouz et al. Reference Pirouz, Avouac, Hassanzadeh, Kirschvink and Bahroudi2017). The Dezful Embayment, a late Cenozoic depocenter that experienced rapid subsidence (Allen & Talebian, Reference Allen and Talebian2011), contains a huge volume of Fars Group formations. These formations significantly affected the kinematics and evolution of the folds (Abdullahie Fard et al. Reference Abdullahie Fard, Sepehr and Sherkati2011). Marine to continental deposits of Gachsaran Formation as caprock of the Asmari reservoir formed a major upper décollement horizon in the Zagros foreland fold-and-thrust belt (Bahroudi & Koyi, Reference Bahroudi and Koyi2003; Derikvand et al. Reference Derikvand, Alavi, Abdullahie Fard and Hajialibeigi2018). Overall, the thickness of the anisotropic sedimentary overburden reaches c. 10–12 km in the Dezful Embayment (e.g. Alavi, Reference Alavi2004; Derikvand et al. Reference Derikvand, Alavi, Abdullahie Fard and Hajialibeigi2018). Three main décollement layers, including the late Precambrian – Cambrian Hormuz series, the Triassic Dashtak evaporites and the Oligo-Miocene Gachsaran Formation, together with several local décollements, are involved in the sedimentary sequence of the study area (Fig. 2) (e.g. O’Brien, Reference O’Brien1950; Asgari et al. Reference Asgari, Ghaemi, Soleimany, Rahimi and Maleki2019).
3. Methodology and dataset
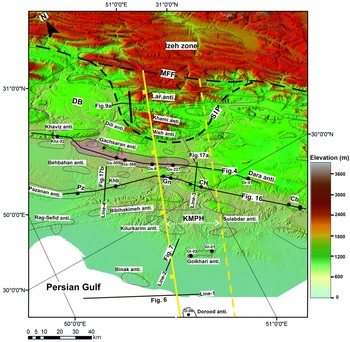
This study utilizes field observations, experimental modelling, and seismic and well data covering most of the study area. The seismic profiles (from the surface down to middle Palaeozoic strata) and well data (from the surface down to Lower Cretaceous strata) used in this work were provided by the National Iranian Oil Company (NIOC). About 45 post-stack time-migrated two-dimensional (2D) seismic profiles were interpreted across and adjacent to the KMPH in the SDE. Based on the well-to-seismic tie calibrated by six well check shots, seven key stratigraphic horizons that reach down to the Fahliyan Formation (lower Cretaceous) have been considered. However, because of the poor resolution of seismic profiles and the transparent seismic facies, it is difficult to interpret most of the lines, especially at the deeper parts (see Misra & Mukherjee, Reference Misra and Mukherjee2018 for a discussion of such issues). Four seismic profiles concerning the KMPH (Line-1 and Line-2: intersect; Line-3: along-strike above; Line-4: along-strike adjacent) illustrate the structural style of the study area (Fig. 3).
DEM of the study area with the main structural elements (see Fig. 1 for regional location). Yellow dashed and solid lines: KMPH borders; black dashed lines: Mountain Front Flexure (MFF) and SIP. Gachsaran oilfield highlighted in pink. CH – Chilingar field; Cb – Chahar–Bisheh anticline; DB – Dehdasht Basin; Gn – Garangan field; Khb – Kheirabad Field; KK – Kilurkarim structure; Pz – Pazanan field; SIP – South Izeh Promontory.

More than 400 wells from the different oil fields have been used in order to construct thickness maps, well correlation profiles, longitudinal sections and well-to-seismic ties, most of which reach the Asmari Formation. The Surmeh Formation (Jurassic) is the deepest formation drilled in the area. Two stratigraphic correlations perpendicular to the KMPH were constructed using well log analyses of the Khaviz (Khz), Gachsaran (Gs), Dara (Dr), Pazanan (Pz), Kheirabad (Khb), Garangan (Gn), Chilingar (CH) and Chaharbisheh (Cb) fields (Fig. 3).
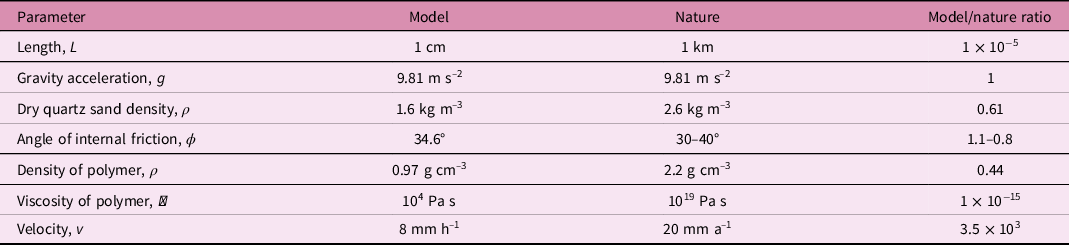
To investigate the effect of pre-salt structure on the structural style and kinematics of the study area we have used scaled 1 g analogue models as complementary data for this study. Experiments were performed in the tectonic laboratory of the Geomodel Research Institute at the University of Barcelona. Scaling assumptions of the model are similar to Mukherjee et al. (Reference Mukherjee, Koyi and Talbot2012), Granado et al. (Reference Granado, Ferrer, Muñoz, Thöny and Strauss2017), Roma et al. (Reference Roma, Ferrer, Roca, Pla, Escosa and Butillé2018) and Reber et al. (Reference Reber, Vidal, McLafferty and Mukherjee2021), in which dynamic scaling was achieved through establishing model/prototype ratios for fundamental units according to the scale model theory of Hubbert (Reference Hubbert1937). Table 2 presents the main properties of the experimental material and the scaling parameters.
Material properties and scaled parameters used in analogue models

4. Results
4.a. The Kharg-Mish Palaeo-high
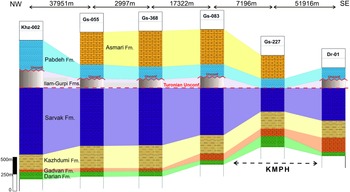
The Kharg-Mish Fault (KMF) is a N–S-trending extensional dip-slip basement fault bounding the KMPH (Fig. 3) (e.g. Sherkati & Letouzey, Reference Sherkati and Letouzey2004; Soleimany et al. Reference Soleimany, Poblet, Bulnes and Sàbat2011). The Haleh and Hendijan-Bahregansar Palaeo-highs are located in the east and west, respectively (Fig. 1). Well correlation down to the Lower Cretaceous sediments along the Khaviz, Gachsaran and Dara oilfields clearly show a progressive thinning of the Bangestan Group towards the KMPH from c. 1200 m to c. 350 m, possibly due to syn-kinematic sedimentation or erosion (Fig. 4). Further, the section displays progressive thinning of the Asmari and Pabdeh formations towards the KMPH from c. 500 m and c. 410 m to c. 290 m and c. 120 m, respectively. Based on the Gs-227 well log, the Upper Cretaceous Ilam and Gurpi formations were either eroded completely or were not deposited over the KMPH (Fig. 4). Moreover, the flattened horizon on top of the Turonian unconformity clearly shows the significant influence of the KMPH on the lateral thickness variation of the Sarvak Formation. In this regard, the thickness of this formation reduces from c. 954 m at the Khz-02 well in the west to c. 364 m at Gs-227 well in the east (above the KMPH) (Fig. 4).
Well correlation profile across the Khaviz, Gachsaran and Dara oilfields in the South Dezful Embayment (see Fig. 3 for location). The stratigraphic section is perpendicular to the Kharg-Mish Palaeo-high trend. Khz – Khaviz Field; Gs – Gachsaran field; and Dr – Dara field.

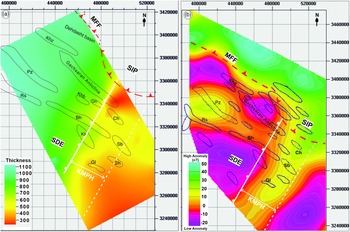
An isopach map shows that the Bangestan Group gradually thickens towards the NW across a NE–SW-trending linear feature, presumably a deep-seated dip-slip fault that acted as a depocenter (Fig. 5a). Reactivation of the N–S-trending basement faults during the Late Cretaceous ophiolite obduction might have given rise to the Turonian unconformity in the SDE (e.g. Sherkati & Letouzey, Reference Sherkati and Letouzey2004; Noori et al. Reference Noori, Mehrabi, Rahimpour-Bonab and Faghih2019). Here we also used magnetic data from the study area to delineate the structural boundaries related to the gneissic basement heterogeneity (Fig. 5b). A vertical magnetic intensity map derived from SDE magnetic data clearly traces the KMPH (Fig. 5b). A comparison between isopach and vertical magnetic intensity maps of the area reveals a good match in terms of trend and overall location of the KMPH (Fig. 5).
(a) Bangestan Group isopach map of the SDE. (b) Vertical magnetic intensity map derived from magnetic data of the South Dezful Embayment. Projected coordinate system (UTM) was applied to the maps. SIP – South Izeh Promontory; Pz – Pazanan anticline; Rs – Rag-e-Sefid anticline; Bh – Bibihakimeh anticline; KK – Kilurarim anticline; Sb – Sulabdar anticline; Sh – Shur anticline; Gl – Golkhari anticline; Ch – Chilingar anticline; Gn – Garangan anticline; Khb – Kheirabad anticline; Khz – Khaviz anticline; MFF – Mountain Front Flexure.

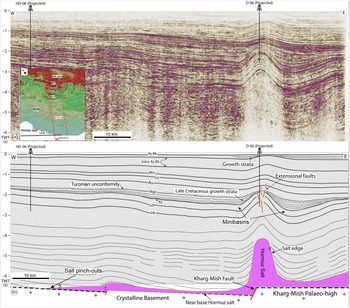
Although the origin of the KMPH has already been described by the reactivated basement faults (e.g. Motiei, Reference Motiei1994, Reference Motiei1995; Farahzadi et al. Reference Farahzadi, Alavi, Sherkati and Ghassemi2019), no deep-seated fault trace has been interpreted along-strike of the KMPH in the sedimentary cover (Fig. 6). Because of the low-resolution 2D seismic profiles, it is difficult to interpret the basement structure. Seismic profiles across the western edge of the KMPH in the southern part of the SDE indicate a subsurface anticlinal structure (Fig. 6). The shape and geometry of this structure and its related depocenter suggest that it is a salt-related structure (Soleimany et al. Reference Soleimany, Poblet, Bulnes and Sàbat2011) and probably controlled by a deep-seated fault in the gneissic basement (Fig. 6). This structure has a wavelength of c. 12 km with gentle dips at the top of the Bangestan Group (Fig. 6).
(a) Uninterpreted and (b) interpreted 2D seismic profile across the KMPH. The seismic line represents a developed deep-rooted anticlinal structure at the western edge of the KMPH (see Fig. 3 for location). Aj-Bk – Aghajari and Bakhtiyari formations; As – Asmari Formation; Bgp – Bangestan Group; D – Doorod well; Gd – Gadvan Formation; Gs – Gachsaran Formation; HD – Hendijan well; Hi – Hith Formation; Kz – Kazhdumi Formation; Mn – Mishan Formation; TWT – two-way travel time.

Folds below the Bangestan Group are tighter than those in the younger strata (Fig. 6). The variable thickness of sedimentary layers near the flanks of the structure are clearly visible (Fig. 6). Despite the significant thinning of the Late Cretaceous sediments, Pabdeh-Gurpi and Asmari formations are still thin towards the KMPH. On the other hand, the geometry and thickness (c. 2500 m) of the Upper Triassic (Dashtak top) to Upper Cretaceous sediments are uniform across the KMPH. Another clear variation in the thickness is indicated in the strata at the top of the Aghajari and Bakhtiyari formations (Fig. 6).
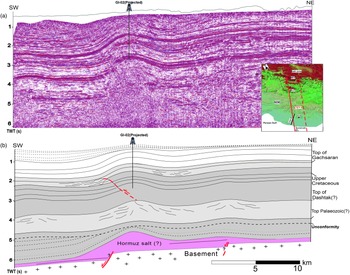
In Line-2, the geometry of the Golkhari anticline in the western margin of KMPH displays a salt-cored structure detached from the Hormuz salt layers (Fig. 7). Layer-parallel shortening related to the Zagros deformation front has caused slight vergence of this structure to the SW (similar to fore-folds) with the development of a fore-thrust (Fig. 7). This structure cannot be considered to be a normal drag fold since the layer away from the fault is also warped (Mukherjee, Reference Mukherjee2014). The structure of line-1 (Fig. 6) has been less affected by the shortening of the Zagros Orogeny, where some growth strata above the Aghajari and Bakhtiyari formations have been ascertained.
(a) Uninterpreted and (b) interpreted 2D seismic profile of the Golkhari anticline and the western side of the KMPH. Uplift of the NE syncline over the KMPH indicated. The interpreted approximately NE-dipping reverse fault has an associated fold. Gl – Golkhari well (see Fig. 3 for location).

4.b. Mountain Front Flexure (South Izeh Promontory)
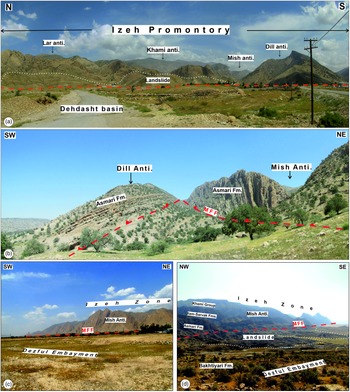
The Mountain Front Flexure (MFF) corresponds to a topographic step in the frontal part of the Zagros foreland folded belt. This structure is determined by active anticlines related to branched thrusts and back-thrusts in the outcrop (Fig. 8). The magneto-stratigraphic studies of the NW of ZFTB have determined the long-lasting activity of the MFF during 8.1–7.2 Ma, to around the Pliocene–Pleistocene boundary (Hessami et al. Reference Hessami, Koyi, Talbot, Tabasi and Shabanian2001 b, Reference Hessami, Nilforoushan and Talbot2006; Homke et al. Reference Homke, Vergés, Garcés, Emami and Karpuz2004). Several constructed cross-sections of the ZFTB demonstrate that the uplift of the MFF is related to basal detachment accumulation in the base of sedimentary cover (e.g. Hessami et al. Reference Hessami, Koyi, Talbot, Tabasi and Shabanian2001 b; Hinsch & Bretis, Reference Hinsch and Bretis2015). However, based on seismologic data and the different structural elevations of the sedimentary cover, other researchers have interpreted the MFF as a major blind thrust or a reactivated basement fault (e.g. Berberian, Reference Berberian1995; Tavani et al. Reference Tavani, Camanni, Nappo, Snidero, Ascione, Valente and Mazzoli2020). Seismicity in this area confirms the MFF to be active (Jassim & Goff, Reference Jassim and Goff2006; Karasözen et al. Reference Karasözen, Nissen, Bergman and Ghods2019; Zebari et al. Reference Zebari, Grützner, Navabpour and Ustaszewski2019). The review of the seismic evidence along the MFF supports the theory that most of the earthquakes occurred within the sedimentary cover rather than in the basement (McQuarrie, Reference McQuarrie2004). Dill, Mish, Khami and Lar anticlines, the outermost anticlines of the Izeh zone (South Izeh Promontory, SIP), steeply plunge NW-wards into the Dehdasht Basin (Fig. 8a). These anticlines are located along the trace of the KMPH. The development of the structures of the SIP was accompanied by several landslides (Fig. 8a, d). The most external folds of the SIP, the Mish anticline, is located to the north of the Gachsaran oilfield. This anticline is geometrically characterized by an overturned forelimb including the Asmari, Pabdeh and Gurpi formations. High uplift along the MFF has placed these formations over the Pleistocene conglomerates of the Bakhtiyari Formation in the SDE (Fig. 8c, d).
Landscape photographs of the MFF showing (a) elevation difference between the SIP and Dehdasht basins; (b) emergent SIP thrusts and back-thrusts in the Mish and Dill anticlines; (c) elevation difference between the SIP and Dezful Embayment; and (d) collapse structures and large landslides resulting from the MFF (see Fig. 3 for location).

4.c. Experimental results
4.c.1. Initial stage and procedure
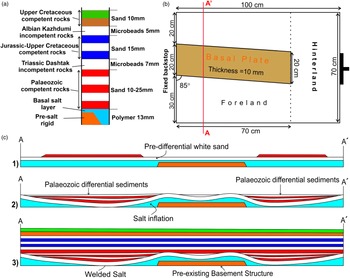
An experimental programme consisting of six experiments was developed to understand the kinematic and structural evolution of the SDE. Here, we present the results of the final model to compare with the structure of the area. The thickness and mechanical stratigraphy of the models were scaled according to the mechanical stratigraphy of the SDE (Fig. 9a). A rigid wooden block attached to a fixed wall and located at the central part of the experiments simulates the KMPH (Fig. 9b). This structural high was slightly oblique to the shortening direction (β = 5°) so that the oblique shortening direction (σ 1) of the Zagros Orogeny concerning the KMPH trend (c. 5°) is replicated (e.g. Zarifi et al. Reference Zarifi, Nilfouroushan and Raeesi2014).
Experimental set-up. (a) Mechanical properties of the model stratigraphy and equivalent prototype showing the composition of each layer. (b) Schematic top view of apparatus shows the position of the structural high. (c) Pre-contractional evolution of the experiment through conceptual sketches – 1, beginning of the down-building; 2, after salt welding at the end of the down-building stage and 3, at the beginning of the compression.

The basal plate was covered by a 1.3-cm-thick blue polymer layer, which lies 3 mm above the structural high. Polydimethylsiloxane (PDMS), a see-through polymer, was used as an analogue of basal salt. PDMS (Rhodia Rhodorsil Gum FB) has near-perfect Newtonian fluid behavioural properties at a laboratory strain rate of 1.83 × 10⁻⁴ s−1 at 20 °C; (Weijermars, Reference Weijermars1986; Mukherjee et al. Reference Mukherjee, Koyi and Talbot2012; Dell’Ertole & Schellart, Reference Dell’Ertole and Schellart2013), with a density (ρ) of 972 kg m−3 and a dynamic viscosity (η) of 104 Pa s. Once the polymer was completely flat, it was overlaid by a 6-mm-thick white sand layer. Layered white and coloured (blue, red, green and brown) quartz sands with an average grain size of 250 μm, an angle of internal friction of 34.6°, a bulk density of 1500 kg m−3, a coefficient of internal friction of 0.69 and a low apparent cohesive strength of 55 Pa (measured with a ring shear tester at the Fault Dynamic Analogue Modelling Laboratory of the Royal Holloway University of London) were used to simulate the brittle behaviour of the upper continental crust (see also Granado et al. Reference Granado, Ferrer, Muñoz, Thöny and Strauss2017; Roma et al. Reference Roma, Ferrer, Roca, Pla, Escosa and Butillé2018). Furthermore, following Warsitzka et al. (Reference Warsitzka, Kley and Kukowski2015), lateral polymer flow was forced by adding a sand wedge covering both sides of the structural high and the hinterland (Fig. 9c(1)). Polymer flow was enhanced by successive sand layers deposited at intervals of 8 hours, producing inflation above the structural high. Once the polymer layer was depleted below the main depocenters adjacent to the structural high (Fig. 9c(2)) the experiment was covered by layers of sands and microbeads before beginning shortening (Fig. 9a). Glass microbeads with an average grain size of 90 μm and an internal friction coefficient of 0.37 (Koyi & Vendeville, Reference Koyi and Vendeville2003) were used to simulate the Dashtak and Kazhdumi formations (the middle décollements) in the study area.
4.c.2. General features
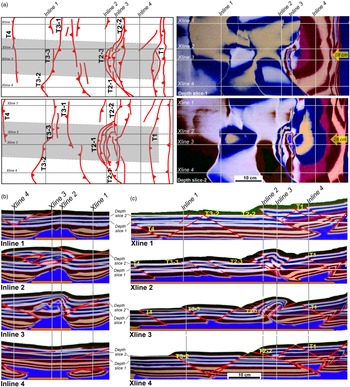
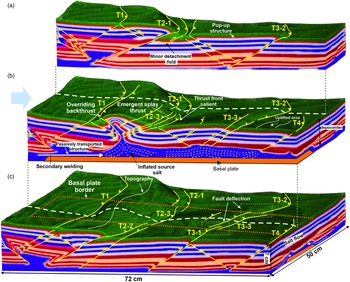
Figure 10 shows the structural style and geometry of the structures at the end of the shortening across the entire model. The model shows along-strike variation of the structures where the basal plate structurally defined two main deformation domains (Fig. 10). Four x-line sections, parallel to shortening direction, have been presented to demonstrate different geometries over and adjacent to the pre-existing structural high (Fig. 10c). Two different structural styles constrained by the salt thickness/structural high can be identified: (i) different thrust and back-thrust bounding large pop-up structures develop at both sides of the structural high where the salt layer was depleted before shortening (Fig. 10c, x-lines 1 and 4); and (ii) salt-cored anticlines or salt-inflated areas, closely-spaced thrusts and back-thrusts and smaller pop-up structures with different degrees of shortening rate developed above the structural high where the salt layer was thicker before shortening (Fig. 10c, x-lines 2 and 3). Different geometries for the salt anticlines over the frontal ramp of the structural high (T2-1) can be observed along-strike the structure towards the adjacent depocnters (T2-2 and T2-3, Fig. 10). The depth slice maps show how the geometry of the deformation front (T2-1, T2-2 and T2-3) varies from the centre towards the adjacent area (Fig. 10a, b).
Different view of developed structures at the end of the shortening – (a) two depth slices at different depths of the model and their respective structural interpretation; (b) four inline sections crossing the structural high (grey rectangle); and (c) four x-line sections along-strike the structural high and depocenters. T1–T4 indicate the main thrusts that developed as shortening increased. The location of each section is highlighted in all figures.

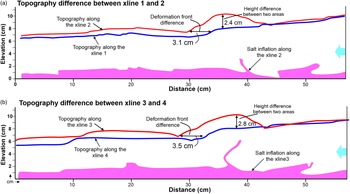
The topography profile of x-line sections along the basal plate and adjacent depocenters at the end of the experiment are depicted in Figure 11. The results indicate that the topography profiles along the basal plate (x-lines 2 and 3) are located at a higher level than the adjacent depocenters (x-lines 1 and 4). In addition, the difference in deformation front propagation (c. 3.5 cm) between two areas has been determined by the topography profiles. These profiles explain the local high elevation and propagation of the salt-cored anticline over the frontal ramp of the structural high (Fig. 11a, b).
Topography profile on the surface of the experiment at the end of the shortening shows the different elevation of the structures along the structural high and adjacent depocenters – (a) x-lines 1 and 2; and (b) x-lines 3 and 4. See Figure 10 for the sections. Blue line – along the depocenters; red lines – along the basal plate. The geometry of basal salt along the structural high is highlighted by the pink area in both sections.

4.c.3. Kinematic evolution
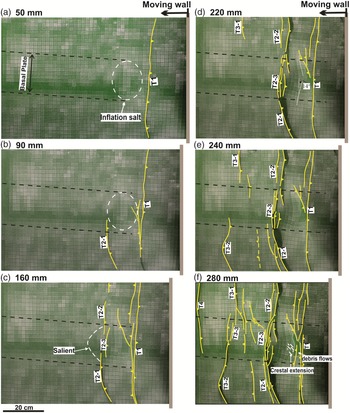
Figure 12 demonstrate how step-wide deformation progressed in the model in several steps. At shortening of 3–5 cm, a thrust verging towards the foreland develops parallel to the moving wall (T1 in Figs 12a, 13a–c). A gentle and symmetric anticline begins to rise, indicated by the inflated polymer at the boundary of the inherited structural high closer to the moving wall (Fig. 12a). At this point the structural high acts as a passive indentor inhibiting the propagation of the deformation towards the foreland, while in the adjacent zones it continues to propagate as evidenced by the development of two new thrusts (T2-1 and T2-2 in Fig. 12b, c) separated by a relay zone over the structural high.
Overhead photographs showing the kinematic evolution of the experiment after (a) 50 mm; (b) 90 mm; (c) 160 mm; (d) 220 mm; (e) 240 mm; and (f) 280 mm of shortening. T1–T4 indicate the main thrusts that developed as shortening increased. The emergence of the faults at the surface is represented by the yellow lines.

3D oblique view of the developed structures at the end of shortening in which interpreted structure traces such as folds and faults are indicated – (a) right-hand side of the basal plate; (b) along with the basal plate; and (c) left-hand side of the basal plate. T1–T4 indicate the main thrusts that developed as shortening increased. The dashed white lines on the surface of (b) and (c) represent the slice location of (a) and (b), respectively.

After 220 mm of shortening, this differential displacement causes a progressive inwards rotation of the structures up to 14° (note the curvature of the passive marker above the structural high in Fig. 12d). Coevally, the anticline growth amplifies until a back-thrust develops in its back-limb oblique to the rest of the structures (Fig. 12d). Further shortening increased tightening of the salt-cored anticline with the development of an imbricate thrust (T2-3) and back-thrust system at the frontal and back limb of this structure, respectively (Figs 12d, 13b). The development of these structures typically indicates the closure of the previous salt anticline and the consequent secondary welding (Fig. 13b). The salt from the adjacent area feeds the core of these anticlines and the salt is competently depleted. As a result, the central anticline becomes the structure with the highest topographic expression on the model’s surface. Shortening has squeezed the salt body welding the back-limb. Here, a foreland-directed thrust-weld nucleates at the pedestal. Thereafter, until 240 mm of shortening, contractional deformation propagates forwards with the development of two new thrusts at each side of the structural high (T3-1 and T3-2; Figs 12d, e, 13a, c). These structures nucleate with different timing from each other, and are located at different sides of the structural high. After 240 cm of shortening, while a foreland-verging thrust (T3-1) characterizes the structure on one side of the structural high, a pop-up structure bounded by a thrust and a back-thrust (T3-2) develops on the other (Figs 12e, 13a,c). Both structures terminate against the structural high, where salt inflates (Fig. 13c). In addition, the salt anticline is passively transported over the structural high using the salt layer as a detachment (Fig. 13b). Several extensional faults with a 45° trend develop by crestal collapse of the anticline, indicating coeval squeezing (Fig. 12f).
4.d. Comparison between model and prototype (SIP and SDE)
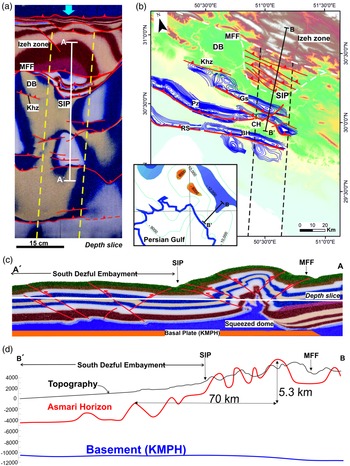
Lateral and vertical variations in the regional deformation style of the model can be compared with the study area in both the cross-section and map views (Fig. 14). Different along-strike geometry and style of the deformation front could be attributed to the pre-contractional distinct structural features, for example, salt structures (e.g. Davis & Engelder, Reference Davis and Engelder1985; Kergaravat et al. Reference Kergaravat, Ribes, Callot and Ringenbach2017) and basement topography (e.g. Molinaro et al. Reference Molinaro, Guezou, Leturmy, Eshraghi and de Lamotte2004; Razavi Pash et al. Reference Razavi Pash, Sarkarinejad, Sherkati and Motamedi2021b). An underground contour (UGC) map of the top of the Asmari Formation was integrated with the digital elevation model (DEM) to evaluate the key structural elements of the SDE and SIP (Fig. 14b). This map is compared with the interpreted structural features at the end of the experiments on the depth slice (Fig. 14a). The geometry and distribution of the thrust faults concerning the KMPH are visible in the study area and experimental model (Fig. 14). The model indicates thin overburden on top of the structural high with a pre-contractional salt dome as a weak zone, controlling thrust localization during folding (Letouzey et al. Reference Letouzey, Colletta, Vially, Chermette, Jackson, Roberts and Snelson1995; Letouzey & Sherkati, Reference Letouzey and Sherkati2004).
Overhead and section views of the key structures of the study area. (a) Depth slice of the model at the end of shortening. (b) DEM of the study area overprinted by the UGC map at the top of the Asmari Formation of the SDE structures. The inset map shows the location of the BB′ section on the top-magnetic basement map of the ZFTB (Morris, Reference Morris1977). (c) 2D section of the model along with the basal plate at the end of the experiment (see (b) for location). (d) Longitudinal profiles for the topography (black) and basement (blue) is based on Morris (Reference Morris1977), and the top of the Asmari Formation (red) in the study area is based on the outcrop and UGC map (see (b) for location). BH – Bibihakimeh anticline; CH – Chilingar anticline; DB – Dehdasht Basin; Gn – Garangan anticline; Gs – Gachsaran anticline; MFF – Mountain Front Flexure; Pz – Pazanan anticline; Rs – Rag-e-Sefid anticline; SIP – South Izeh Promontory.

The structural feature in the SDE is comparable between the model and the study area (Fig. 14). The basement high that acted as an indentor controlled the structural gain during shortening by salt inflation and squeezing over the structural high, and by the development of pop-up structures with thrusts and back-thrusts at the adjacent basins. Large-amplitude deflected, tight folds, for example, the Garangan, Chilingar and Gachsaran (eastern nose) anticlines, developed over the KMPH (Fig. 14b). Subsequently, a few large-wavelength folds, for example, the Pazanan, Rag-e-Sefid and Gachsaran (western nose) anticlines developed within the depocenter extended adjacent to the KMPH. Closely spaced and intense brittle structures, such as fore-thrusts, back-thrusts, oblique-slip faults and pop-up structures, more developed over the basement structural high as opposed to the adjacent depocenters (Fig. 14).
Closely spaced thrust faults and high-relief salt-cored anticlines are the main structural features of the SIP. These structures are convergent and then die out towards the two depocenters adjacent to the palaeo-high. The Dehdash Basin, a local structural basin in the west of the SIP, is emulated by the model (Fig. 14a). The structural evolution of the Dehdasht Basin specifies a local decrease in the thickness of the Hormuz salt (Heydarzadeh et al. Reference Heydarzadeh, Ruh, Vergés, Hajialibeigi and Gharabeigli2020). The thick overburden of the Cenozoic sediments in the Dehdasht Basin can be an effective factor for the withdrawal of basal salt and its movement to the adjacent areas. As simulated in the analogue model, feeding the salt dome over the KMPH by withdrawal from the Dehdasht Basin creates a significant elevation difference between these two areas.
Some of the SIP structures are still active (e.g. Berberian, Reference Berberian1995; Tavani et al. Reference Tavani, Camanni, Nappo, Snidero, Ascione, Valente and Mazzoli2020), as characterized by the many earthquakes as well as landslides in this area. This fact is consistent with the results of the experiment that show how the salt-cored anticlines uplifted by squeezing while being transported over the basement high as shortening increased. As contractional deformation progresses and the salt-inflated structure is transported over the structural high, a smooth arc develops. Although this structure is more subtle in our experiment, it is equivalent to the SIP (Fig. 14). Syntectonic sedimentation (not considered in our experiment) or different mechanical properties for the intermediate and upper detachments (Dashtak and Kazhdumi formations) probably enhanced the arcuate geometry of the salient (Pla et al. Reference Pla, Roca, Xie, Izquierdo-Llavall, Muñoz, Rowan and Huang2019).
5. Discussion
5.a. Evolution of the South Izeh Promontory
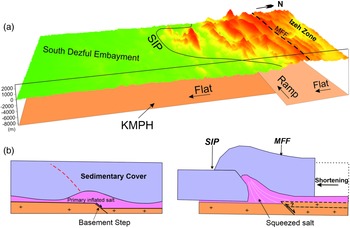
Several studies have shown that the reactivation/positive inversion of steeply dipping NW–SE-trending pre-existing basement fault in some parts of the Zagros foreland folded belt (e.g. Mouthereau et al. Reference Mouthereau, Lacombe and Meyer2006; Tavani et al. Reference Tavani, Camanni, Nappo, Snidero, Ascione, Valente and Mazzoli2020) governed the development of the MFF. However, our study suggests that the SIP, as part of the MFF, developed in relation to the Hormuz salt inflation constrained by inherited pre-salt topography (KMPH) (Fig. 15). The structural development of this study differs from that of Bahroudi & Koyi (Reference Bahroudi and Koyi2003), in which the variation of basal salt on the deformation style of sedimentary cover was tested without considering the gneissic basement configuration. In addition, Farzipour-Saein et al. (Reference Farzipour-Saein, Nilfouroushan and Koyi2013) demonstrated the effect of the basement step on the propagation of the deformation front during the shortening. Their results demonstrate that the impact of the basal salt in the propagation of the deformation front is greater than that of the thickness variation of the sedimentary cover across the basement step. However, in this work we study the structure and kinematics of the study area based on the detailed structural interpretation aided by previous studies of the area (e.g. Bahroudi & Koyi, Reference Bahroudi and Koyi2003; Sherkati et al. Reference Sherkati, Letouzey and Frizon de Lamotte2006; Farzipour-Saein et al. Reference Farzipour-Saein, Nilfouroushan and Koyi2013).
(a) 3D investigation of surface and basement morphology of the study area on top of the Palaeo-high structure, and interaction between the MFF and the frontal ramp of the KMPH. (b) 2D conceptual cross-sections showing the relation between the frontal ramp of KMPH in association with the salt ductile flow. KMPH – Kharg-Mish Palaeo-high; MFF – Mountain Front Flexure; SIP – South Izeh Promontory.

The accumulation of a thick Hormuz salt layer over the KMPH intensified deformation there compared with the adjacent area. The driving mechanism of the Hormuz halokinetic sequences controlled by the KMPH was the squeezing of the pre-contractional salt dome (Fig. 15b) (Letouzey & Sherkati, Reference Letouzey and Sherkati2004). The pre-existing structural high significantly weakens the sedimentary cover and localizes the deformation during the shortening, which increases the topography of the structures before the thrusting (Calignano et al. Reference Calignano, Sokoutis, Willingshofer, Brun, Gueydan and Cloetingh2017; Kergaravat et al. Reference Kergaravat, Ribes, Callot and Ringenbach2017; Duffy et al. Reference Duffy, Dooley, Hudec, Jackson, Fernandez, Jackson and Soto2018). Thin sedimentary cover over the KMPH contributed greatly to this deformation style, reducing the mechanical contrast between basal salt and sedimentary cover above the KMPH where deformation can localize. Strain localization by thick salt accumulated over the frontal ramp during the shortening is another reason for the initial rising of basal salt before thrusting.
The overburden at the SIP was arched in response to the active deformation front during shortening. Here, the top of the Asmari Formation is located vertically c. 5 km higher than in the SDE (Fig. 14b). This vertical displacement was observed in the field where the Lower Cretaceous sediments of the SIP were placed next to the Plio-Pliostocene sediments of the SDE by several steeply dipping thrusts at the base of the sedimentary cover (Fig. 8). Nevertheless, the thickness of the Hormuz salt at the end down-building stage, combined with the presence of the inherited basement high, was critical for the subsequent evolution during the contractional episode (Jahani et al. Reference Jahani, Hassanpour, Mohammadi-Firouz, Letouzey, de Lamotte, Alavi and Soleimany2017; Snidero et al. Reference Snidero, Muñoz, Carrera, Butillé, Mencos, Motamedi and Sàbat2019). The presence of the gneissic basement step below the basal salt localized the deformation in the sedimentary cover. The subsequent shortening resulted in the formation of the ductile ramp above the basement frontal ramp (Bonini et al. Reference Bonini, Sokoutis, Mulugeta and Katrivanos2000; Ter Borgh et al. Reference Ter Borgh, Oldenhuis, Biermann, Smit and Sokoutis2011). The ductile ramp developed as a result of the presence of a thick salt layer and the buttressing effect of the frontal ramp of KMPH as shortening increases. Salt at the core of the SIP anticlines was fed by the adjacent sinking basins (Heydarzadeh et al. Reference Heydarzadeh, Ruh, Vergés, Hajialibeigi and Gharabeigli2020) and the hinterland of the structural high.
5.b. Evolution of the Kharg-Mish Palaeo-high
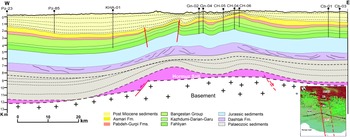
Based on the thickness and facies variations depicted in the well data, several authors concluded that the Kharg-Mish structure acted as a Palaeo-high from early Aptian time (e.g. Motiei, Reference Motiei1994; Farahzadi et al. Reference Farahzadi, Alavi, Sherkati and Ghassemi2019). The effect of the KMPH on the sedimentary cover geometry is depicted via a cross-section based on the well and seismic data in Figure 16, which can be interpreted as a major near-symmetric geometry in the sedimentary cover above the KMPH. Subsidence analyses in the numerous well data of the SDE show that the KMPH is not limited to fault zones, and should be considered as a large-scale structure related to regional up-warping of the basement (Farahzadi et al. Reference Farahzadi, Alavi, Sherkati and Ghassemi2019). The location and geometry of the KMPH have been geometrically inferred as per the cover deformation patterns characterized by the folding of the lower Palaeozoic reflectors.
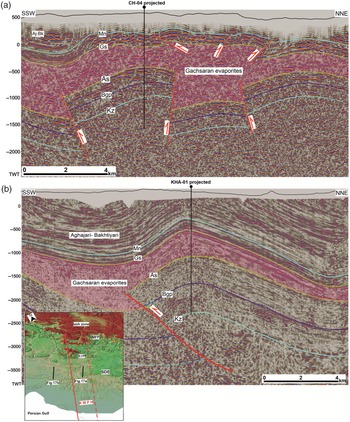
An interpreted longitudinal section through Pazanan, Kheirabad, Garangan, Chilingar and Chahar-Bisheh fields, perpendicular to KMPH, based on the well and seismic data. Cb – Chaharbisheh well; CH – Chilingar well; Gn – Garangan well; KHA – Kheirabad well; Pz – Pazanan well.

The KMPH represents a regional warp of c. 40 km width. The section across the KMPH shows an overall asymmetric concave-up geometry caused by extensional faulting of the inherited basement structure, and dominant salt upwarping and inflation as a result of the kinematics of differential ductile salt flow, gliding both laterally and vertically to the central portion of the structure resulting in a dynamic bulge (Fig. 16). The depocenter at the western flank of this structure is dominantly filled by the thick Palaeozoic, Upper Cretaceous and Upper Cenozoic sediments, which gradually thin towards the high. This can be attributed to the reactivation of the basement faults during Phanerozoic time that episodically grew the overlying salt layer (e.g. Letouzey & Sherkati, Reference Letouzey and Sherkati2004; Stewart, Reference Stewart2018).
During the Zagros Orogeny, post-Miocene sediments were deposited in the western depocenter to a thickness of > 2 km. Nevertheless, the KMPH is recognizable with a > 2 km height difference from the western depocenters at the top of the Asmari Formation. The anticline geometry of KMPH suggests that the major basement fault zone was decoupled by the Hormuz salt layer from the sedimentary overburden (Fig. 16). Decoupling of sedimentary cover by a salt layer mainly developed close to the edge of the extensional basement fault (Letouzey & Sherkati, Reference Letouzey and Sherkati2004).
5.c. Effect of the KMPH on fold style
The subsurface structures across the KMPH in the SDE are characterized by lateral changes in fold style controlled by differences in cover thickness. The thickness and facies variations shown on the stratigraphy column are the main controlling factors on the spacing, axial length and wavelength of anticlines (Sherkati & Letouzey, Reference Sherkati and Letouzey2004; Sepehr et al. Reference Sepehr, Cosgrove and Moieni2006; Casciello et al. Reference Casciello, Vergés, Saura, Casini, Fernández, Blanc and Hunt2009; Motamedi et al. Reference Motamedi, Sherkati and Sepehr2012; Farzipour-Saein & Koyi Reference Farzipour-Saein and Koyi2016). Isopach map and well correlation chart show that the Upper Cretaceous sediments were affected by an important tectonic movement along the KMPH (Figs 4, 5) (Hessami et al. Reference Hessami, Koyi, Talbot, Tabasi and Shabanian2001 b; Sherkati & Letouzey, Reference Sherkati and Letouzey2004; Noori et al. Reference Noori, Mehrabi, Rahimpour-Bonab and Faghih2019).
Figure 17 shows significant changes in fold style across two NE–SW-trending seismic reflection profiles along the central part of the KMPH and the western depocenter. The thinner Asmari-Sarvak competent rocks above the KMPH are folded with a small wavelength and possibly detached on top of the Kazhdumi Formation; however, on the western depocenter the folds have a larger wavelength. Several closely spaced steep thrusts and back-thrusts with strike-slip components bounded small folds over the KMPH (Fig. 17a). The initiation of these thrusts is strongly controlled by the pre-contractional salt inflated over the structural high. The geometry of fold in the thick competent layers of the Asmari and Bangestant formations control the overlaying sequences in the Kheirabad structure at the adjacent depocenter (Fig. 17b).
Interpreted 2D seismic sections of the structures in the SDE. (a) Line-1 – structures on top of the KMPH; and (b) Line-2 – Kheirabad anticline in the western depocenters of the KMPH (see Fig. 3 for location). Aj-Bk – Aghajari-Bakhtiyari Fms; As – Asmari Formation; Bgp – Bangestan Group; Gs – Gachsaran Formation; Kz – Kazhdumi Fm; Mn – Mishan Formation.

The Kheirabad anticline is bounded by two broad synclines, where they are filled with thick post-Gachsaran sediments of the Mishan, Aghajari and Bakhtiyari formations. Thick sequences of the Aghajari and Bakhtiyari deposits in the Kheirabad anticline have reduced the effect of the material flow of the Gachsaran evaporites. Consequently, the Gachsaran evaporites do not show significant effects on the overlying Aghajari and Bakhtiyari sediments (Fig. 17b) compared with their effects on the sediments deposited at the top of the KMPH (Fig. 17a). Detached minor folds of the Mishan and Aghajari sediments above the KMPH formed in response to the thick Gachsaran evaporite, which acts as the main décollement. The effect of the Gachsaran evaporates as the main detachment level in the deformation style of the Dezful Embayment structures has already been discussed by several authors (e.g. Letouzey & Sherkati, Reference Letouzey and Sherkati2004; Najafi et al. Reference Najafi, Vergés, Etemad-Saeed and Karimnejad2018). The Kheirabad anticline is a detachment fold with a thrust in its southern forelimb, which probably propagated from the underlying Dashtak evaporites formation. The thin Hormuz salt layer decreases the efficiency as a basal dećollement, which activated the intermediate décollement during folding (Motamedi et al. Reference Motamedi, Sherkati and Sepehr2012). The structure of the Kheirabad anticline is similar in geometry to those developed in the area flanking the structural high of the experiment where the overburden is thicker, imposed by the first down-bulding stage. In contrast, thicker Hormuz salt at the top of the KMPH resulted in a more localized deformation in the overlying sediments.
5.d. Conceptual tectonostratigraphy
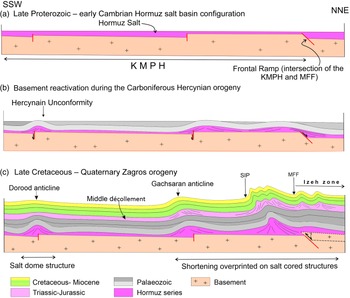
We propose a three-step tectonostratigraphic evolution of the KMPH at the SDE and NW of the Persian Gulf based on the results of this study and previous studies (Fig. 18). Since Late Proterozoic time, various tectonic events have affected the study area.
-
(1) Hormuz salt basin during late Proterozoic – early Cambrian time: the late Proterozoic – Cambrian Hormuz salt basin was controlled by pre-existing horsts and grabens with the sedimentation of evaporites (Fig. 18a; e.g. Alsharhan, Reference Alsharhan1989; Jahani et al. Reference Jahani, Hassanpour, Mohammadi-Firouz, Letouzey, de Lamotte, Alavi and Soleimany2017). The horst and graben structures strongly controlled the configuration of the predominantly N–S-trending basement. The N–S-trending KMPH extended towards the SDE. The top-magnetic basement map of the NE Arabian Plate shows the deepening of the basement top from the south towards the north along the KMPH (Morris, Reference Morris1977; Alavi, Reference Alavi2007; Figs 14b, 18a). However, based on the geometry of the basement it could be considered that the thickness of the Hormuz salt increased towards the hinterland to the NE.
-
(2) Basement reactivation by the Carboniferous Hercynian Orogeny: the reactivation of the deep-rooted extensional faults in the Hercynian Orogeny grew salt structures connected to these basement structures (Faqira et al. Reference Faqira, Rademakers and Afifi2009; Stewart, Reference Stewart2018). Domal structures NW of the Persian Gulf (e.g. the Dorood field) underwent salt movement linked to the reactivation basement fault (Soleimany et al. Reference Soleimany, Poblet, Bulnes and Sàbat2011) (Fig. 18b). This structure is mainly related to the pre-Zagros shortening, and is probably related to the salt flow and basement fault reactivation. It is suggested that the other N–S- to NW–SE-trending oilfields at the top of the KMPH in the SDE witnessed the same tectonic history during Palaeozoic time. Based on the analysis of the subsurface data and structures of the study area, the pre-Hercynian Palaeozoic sediments were most probably eroded over the KMPH during Carboniferous time (Fig. 18b).
-
(3) Late Cretaceous – present-day Zagros Orogeny: after the late Palaeozoic – Early Cretaceous tectonic quiescence, the result of the onset of the Zagros Orogeny, ophiolite obduction in the NE Arabian Plate reactivated pre-existing basement faults (Bahroudi & Talbot, Reference Bahroudi and Talbot2003; Sepehr & Cosgrove, Reference Sepehr and Cosgrove2004, Mohammadrezaei et al. Reference Mohammadrezaei, Alavi, Cardozo and Ghassemi2020; Orang & Gharabeigli, Reference Orang and Gharabeigli2020). This is documented by the huge unconformity and growth strata on the Sarvak, Ilam and Gurpi formations. Subsequent shortening caused by the Zagros Orogeny from Late Cretaceous time until the present day resulted in a thin-skinned deformation that detached over the basal salt in the SDE. It was then converted to a thick-skinned deformation in a process involving the pre-existing basement structures (Fig. 18c). The pre-existing Dorood structure, located far from the hinterland part and towards the foreland, demonstrates deformation by the Zagros shortening processes.
2D conceptual kinematic evolution from MFF to the coastline of the Persian Gulf (not to scale). The section was constructed along the KMPH. See Figure 1 for the location of the Dorood (D) and Gachsaran (Gs) anticlines.

Although we have mostly focused on the role of the N–S-trending basement structure on the structural evolution, the important role of the NW–SE-trending basement faults should not be neglected in considering the structural evolution of the area (Sherkati & Letouzey, Reference Sherkati and Letouzey2004). The intersection of these two basement trends, which was addressed in this study, better shows the role of the basement configuration in the structural evolution of the area. Nevertheless, the basement structures below the salt layer act weakly, which could nucleate deformation during the extensional, contractional or passive down-building processes. In the SIP, at the intersection of the KMPH and MFF, ductile flow over the basement structures as a result of contraction of the Hormuz salt led to the salt-cored anticlines of the SIP. This augmented salt flow over the frontal ramp of the KMPH (Fig. 18c).
Although this study has mainly considered the effect of the basal décollement on the structural style of the sedimentary cover, several researchers have also addressed the impact of the intermediate décollement layers on the fold style during the contractional deformation of the Zagros Orogeny (Fig. 18c; e.g. Sherkati & Letouzey, Reference Sherkati and Letouzey2004; Derikvand et al. Reference Derikvand, Alavi, Abdullahie Fard and Hajialibeigi2018).
5.e. Implications for hydrocarbon exploration
In the NE Arabian Plate, the N–S-elongated oilfields along the pre-existing basement faults rotated to NW–SE-aligned trends due to the overprinting of the Zagros shortening (Talbot & Alavi, Reference Talbot, Alavi, Alsop, Blundell and Davison1996; Hessami et al. Reference Hessami, Koyi, Talbot, Tabasi and Shabanian2001 b; Mohammadrezaei et al. Reference Mohammadrezaei, Alavi, Cardozo and Ghassemi2020). This fact is documented by the pattern of the oilfields in the NW of the Persian Gulf and SDE along with the Kharg-Mish and Hendijan-Bahregansar palaeo-highs (Fig. 1). In addition, the oilfields structure in the SDE varies significantly in size and style because of the different kinematic evolution across the KMPH. The well-known middle Cretaceous – early Miocene petroleum system in the Dezful Embayment is separated from two older systems (Palaeozoic and Jurassic) by thick evaporate sediments (Bordenave & Hegre, Reference Bordenave and Hegre2005). The Upper Cretaceous Bangestan reservoir, the second main reservoir in the SDE, is significantly affected by the KMPH reactivation. During the Late Cretaceous uplift, the Bangestan reservoir was eroded and the reservoir quality was enhanced by fractures and fault systems at the top of the KMPH. It is suggested that the development of the fractures was related to the reactivation of the basement fault in the Dezful Embayment, possibly enhancing the porosity and permeability of the reservoir rock (McQuillan, Reference McQuillan, Roehl and Choquette1985, Reference McQuillan1991; Ahmadhadi et al. Reference Ahmadhadi, Lacombe, Daniel, Lacombe, Roure, Lavé and Vergés2007). Furthermore, the timing of folding during the shortening of the SDE was strongly affected by the presence of the KMPH (as explained in the experimental results), which is important in terms of hydrocarbon migration. The anticlines that formed earlier may be favoured locations for hydrocarbon entrapment. In addition, the style of the individual fields is controlled by the stratigraphy, the structural architecture and the depth to the basement of the basin. However, reservoir, source and cap rocks in the SDE are controlled by the repeated reactivation of the KMPH.
6. Conclusions
This study characterized the different structural styles of the SDE in response to the pre-contractional KMPH using integrated field-based observation, subsurface data and analogue modelling. According to interpreted subsurface data, the reactivation of the KMPH during Phanerozoic time that episodically grew the overlying salt layer resulted in the gradual thinning of the Palaeozoic, Upper Cretaceous and upper Cenozoic sediments from the adjacent depocenters towards the high.
Fold style varies both laterally and vertically in the sedimentary cover as a result of the basal décollement layer and thickness variations of the sedimentary cover. Generally, fold structures in the SDE appear in large wavelengths in the depocenters where the sedimentary cover is thick, while small-wavelength and disharmonic folds developed over the KMPH.
Supporting experimental results, the pre-existing basement structure and overlying salt layer are critical controlling factors on strain localization, deformation pattern, fold style, spatial and temporal nucleation and propagation of structures, and the structural evolution of the salt-influenced fold-and-thrust belt. In other words, induced heterogeneities between the basement and overlaid salt layer are a controlling factor in the deformation of the sedimentary cover during the subsequent thin-skinned shortening.
The modelling results demonstrate that the intersection between the frontal ramp of the KMPH and MFF acts as a ductile ramp and a passive indentor during the shortening process. As shortening progresses to the foreland, strain localization and amplification over the ductile ramp of the KMPH are accommodated by a rising SIP, which is much higher than the two surrounding basins. Closely spaced thrust faults and high-relief salt-cored anticlines are the main structural features of the SIP.
The results of this study indicate that the basal architecture of the sedimentary basin, which is influenced by the basement structures and the salt layers, is one of the most important factors in the nucleation, style and evolution of structures, and their relative timing. These factors will have a far-reaching implication in future hydrocarbon exploration in the study area.
Acknowledgments
We thank the National Iranian South Oil Company (NISOC) for providing the seismic and well data and permission to publish this article. The first author (AS) appreciates the National Iranian Oil Company Exploration Directorate for providing the opportunity to collaborate during the seismic interpretation, with special thanks to Dr Gholamreza Gharabeigli. Experiments conducted at the Geomodels Analog Modelling Laboratory of Barcelona University were supported by the project ‘Structure and deformation of salt-bearing rifted margins’ (PID2020-117598GB-I00; grant no. MCIN/AEI/10.13039/501100011033). This study is part of the Ph.D. thesis of AS, who gratefully acknowledges financial support from the Shiraz University Research Council (SURC). A Cumulative Professional Development Allowance (CPDA) grant (Indian Institute of Technology, Bombay) supported SM. Editor Professor Olivier Lacombe and reviewers (Nicolás Molnar and some anonymous reviewers) are thanked for providing detailed comments.