


1. INTRODUCTION
The metropolitan French vowels are affected by several changes these days (cf., for instance, Fónagy, Reference Fónagy2006). ‘Loi de position’ effects are noticeable for the mid vowels, leading to neutralizations between [e ~ ɛ], [o ~ ɔ], [ø ~ œ], depending on the syllable structure. Furthermore, the front rounded nasal vowel [œ˜] tends to merge with its unrounded counterpart [ɛ˜] (which causes for instance brun et brin to become homophonous), and also the distinction between anterior [a] and posterior [ɑ] is gradually losing ground. This article studies the loss of this phonemic /a/-/ɑ/ contrast from a sociolinguistic perspective.
In order to place the present study in its proper perspective, section 2 will first of all describe the basic diachronic and synchronic characteristics of the /a/ - /ɑ/ contrast. Section 3 will set out the methodology adopted; the corpus material as well as the measurement practices will be described. The results will be presented and discussed in section 4. Section 5 is the concluding section, which also contains some directions for future research.
2. /A/ vs. /ɑ/
The distinction between anterior /a/ and posterior /ɑ/ was derived from an earlier opposition between short /a/ and long /a:/ (cf. Martinet and Walter, Reference Martinet and Walter1973).Footnote 1 Up to the middle of the twentieth century, these two vowels were pronounced distinctly, the a in patte had a very fronted realization, close to [ɛ], and the place of articulation of the a in pâte was further back, close to [ɔ] (Walter, Reference Walter1988: 256). In the period afterwards, the distinction gradually lost ground in favour of anterior [a].
The more conservative descriptions of the modern ‘standard’ French vowel inventory still make a distinction between two low vowels. The front vowel is by far the most frequently occurring token lexically: Léon (Reference Léon1966: 61) estimates that 95% of the lexical a tokens are instances of [a]. In a later study (Reference Léon1992: 87), he reports that 97.6% of all occurrences of a are of the anterior [a] type. If the contrast is maintained, it is generally found in word-final (i.e. stressed) syllables. In non-final syllables, the contrast has been virtually neutralised, and the [ɑ] tokens have merged with [a].Footnote 2
The southern varieties of French, ‘le français du Midi’, differ in a number of respects from ‘standard French’, especially as far as the vowel system is concerned. Not only does the mute-e show a different behaviour (e.g. Durand et al., Reference Durand, Slater and Wise1987; Durand, Reference Durand1995), but the other vowels also deviate from non-southern varieties. Midi French manifests strong effects of the ‘Loi de Position’ (which neutralises contrasts among mid vowels, cf. Grammont, Reference Grammont1922; Léon, Reference Léon1992; Durand and Lyche, Reference Durand, Lyche, Coveney and Sanders2004; Hansen and Juillard, Reference Hansen and Juillard2011), vowel nasalisation has a different character (e.g. Durand, Reference Durand, Baronian and Martineau2009), and the difference between /a/ and /ɑ/ is said to be inexistent (e.g. Brun, Reference Brun1931: 29–30; Durand, Reference Durand, Baronian and Martineau2009).
As a matter of fact, little is known about the actual preservation or reduction of the /a/-/ɑ/ contrast in contemporary spoken language throughout France; to what extent is the anterior-posterior distinction maintained, and to what extent does vowel length indeed play a distinctive role? Existing studies are often impressionistic or introspective, or limited to a single variety (the two most comprehensive analyses are the acoustic study of Lennig (Reference Lennig1978) and the impressionistic auditive study of Hansen and Juillard (Reference Hansen and Juillard2011), both based on Parisian French). Furthermore, the influence of sociolinguistic factors needs to be determined. The following sections will consider to what extent the qualitative and quantitative aspects of the two low vowels are maintained in contemporary French, by examining data from a spoken language corpus.
3. CORPUS MATERIAL
The data that were analyzed were taken from the Phonologie du français contemporain (PFC)Footnote 3 corpus, one of the largest databases of spoken French currently available (Durand et al., Reference Durand, Laks, Lyche, Pusch and Raible2002, Reference Durand, Laks, Lyche and Williams2005, Reference Durand, Baronian and Martineau2009). The aim of this survey is to collect speech in about 75 regions, in France as well as in other francophone countries. Each subcorpus consists of about a dozen speakers, with a more or less equal distribution of men and women, belonging to at least two different generations. For each speaker, four recordings are available: there are two reading tasks where the participant is asked to read aloud a one-page text and a list of 94 randomised words,Footnote 4 and spontaneous conversation is recorded during a guided interview and an unguided conversation. The recordings are transcribed orthographically.Footnote 5
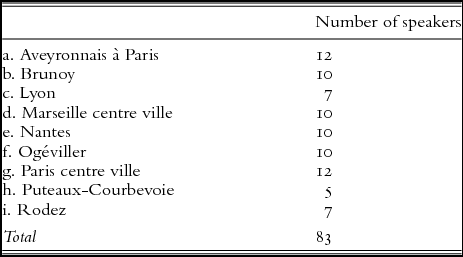
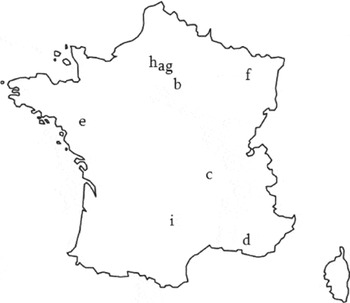
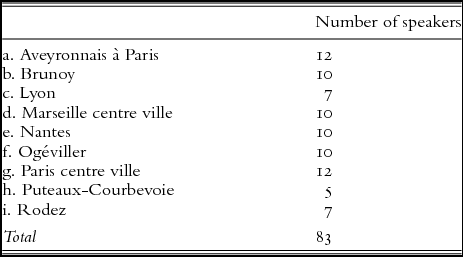
Pronunciation manuals generally refer to ‘standard French’, which is virtually always equated with the varieties spoken in Paris and its direct surroundings, i.e. the Ile de France areaFootnote 6 (for more discussion on standard or reference French, cf., for instance, Valdman, Reference Valdman1982; Detey et al., Reference Detey, Durand, Laks and Lyche2010). For the Parisian region, three PFC subcorpora are currently available. The first one captures the speech of French speakers living in the centre of Paris. The second one contains recordings of a specific group of Parisian residents who moved from the Aveyron region in the south of France to Paris from the middle of the nineteenth century until the first decades of the twentieth century. This subcorpus not only contains recordings of the older original migrants, but also of the younger generations who were born in Paris and have parents originating from the Aveyron.Footnote 7 The third corpus was recorded in the suburbs Puteaux and Courbevoie, which lie to the west of Paris, near the business quarter La Défense. In order to get a reasonable coverage of metropolitan France, six additional surveys were included in our selection. The Parisian varieties were supplemented by the northern varieties Brunoy and Ogéviller. For the mid-west area the corpus of Nantes was included, the mid-southeast was represented by the city of Lyon, and the surveys conducted in Rodez and the city centre of Marseilles were selected for the southern français du Midi. An overview of the number of speakers per survey is provided in Table 1, the geographical spread of the surveys is visualized in Figure 1.
Surveys
Geographical spread

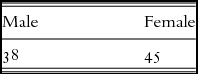
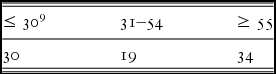
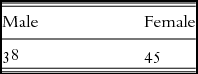
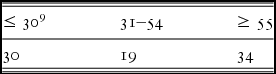
This selection contains a total of 83 speakers; their distribution with respect to the sociolinguistic variables ‘gender’ and ‘age’ is given in Tables 2 and 3.Footnote 8
Gender
Age
Both the PFC text and wordlist contain instances of the minimal pair patte (/a/ ‘paw’) and pâte (/ɑ/ ‘dough’). Only the instances of the wordlist were taken into consideration as, contrary to the text, the target words occur in stressed position, the site where the contrast is the most likely to be maintained (cf. Section 2). Patte and pâte figure twice in the list: once randomly ordered among the other items, and once directly in sequence. As the recordings were not accompanied by a phonetic transcription, an additional annotation layer was added in Praat (Boersma and Weenink, Reference Boersma and Weenink2013), indicating the segmental boundaries for these four tokens. The acoustic analysis focused on three parameters: the vowel height (reflected by the value of the first formant, F1), the frontness or backness of the vowel (reflected by the second formant, F2) and the vowel length. These qualitative and quantitative characteristics of the tokens were extracted by means of a Praat script. Following Harrington (Reference Harrington2010: 206–213), the formant values were extracted at the temporal midpoint of the vowel, where the effects of the surrounding elements are minimal.Footnote 10 The vowel length was measured by taking the zero crossing of the first glottal pulse of the vowel as the vowel onset, the end of the vowel was located at the zero crossing of the final glottal pulse preceding the silence of the plosive closure.
4. RESULTS
4.1 Average scores
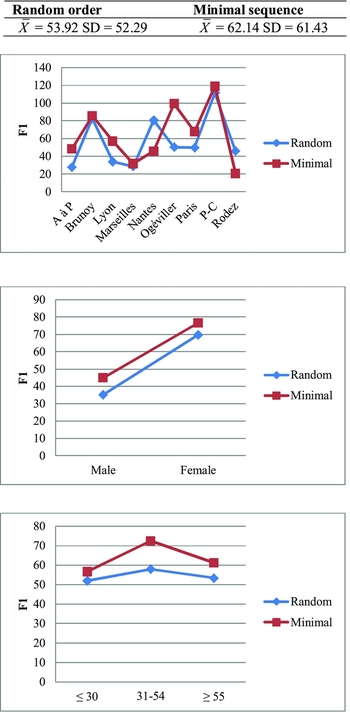
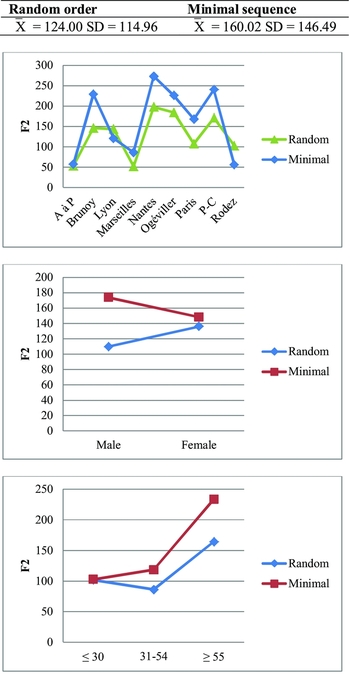
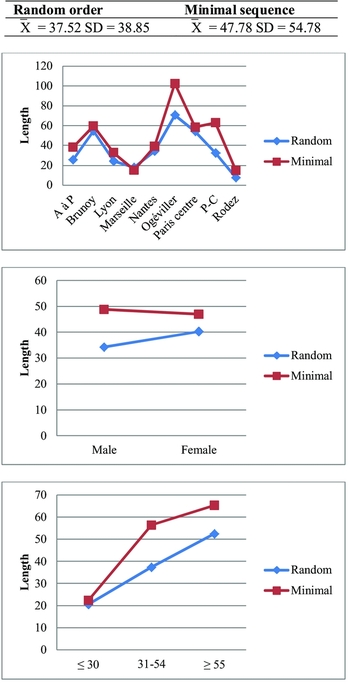
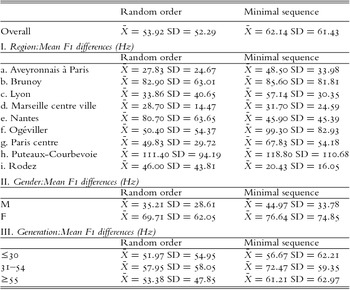
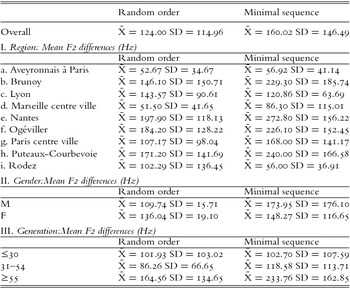
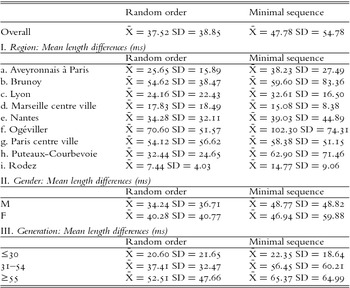
Graphs 1–3 show the average absolute differences between the vowel a in the patte and pâte tokens in terms of vowel spectra and duration, both when produced in random order and in direct sequence. The full descriptive statistics are provided in the Appendix.
Average F1 differences (in Hz)

Average F2 differences (in Hz)

Average length differences (in ms)

The graphs show a number of interesting similarities as well as differences between the different conditions, regions, genders and generations. With regard to the parameters (F1, F2 and duration), the surveys containing speakers from southern varieties (Marseilles, Rodez and Aveyronnais à Paris), appear to display the smallest contrasts, as was expected on the basis of the observations made in the existing descriptions of Midi French.
The differences between the two a tokens realized by the 83 speakers in the random order and minimal sequence were statistically analyzed with the General Linear Model Repeated Measures procedure in SPSS, with the significance level α set at 5%. The condition in which the target words occurred (i.e. random or directly sequenced) was included as a within-subject variable, the origin, age and gender of the speaker were included as between-subject variables. As perception of frequency is not linear, the formant frequency values in Hertz were converted to the Bark scale, using the formula presented in Traunmüller (Reference Traunmüller1990).Footnote 11 These converted values were used in the statistical analyses.
4.2 Contrast maintenance and reduction
4.2.1 F1 difference
No significant effectFootnote 12 for F1 between the two vowels was obtained for the within-subject factor ‘condition’ (i.e. minimal pair and random order). Still, the F1 difference between /a/ and /ɑ/ appears to be sensitive to the geographical background and gender of the speaker:Footnote 13 the differences in Puteaux-Courbevoie are significantly larger than the differences realized by the Aveyronnais of Paris, the speakers of Lyon, Marseilles, Paris and Rodez.Footnote 14 The F1 differences in Marseille, on the other hand, are not only significantly smaller than in Puteaux-Courbevoie, the values also significantly differ from Brunoy.Footnote 15 Moreover, females realize substantially larger F1 differences than male speakers. The factor ‘generation’, on the contrary, does not contribute significantly to the variation in F1Footnote 16 Thus, F1 appears to be subject to inter- and intra-speaker variation, but this variation seems rather random in nature.
4.2.2 F2 difference
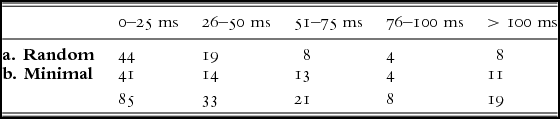
The average F2 difference realized in the minimal context differs substantially from the F2 difference realized in the random sequence (cf. Graph 2), and the majority of speakers indeed realize larger F2 differences in the minimal sequence.Footnote 17 At the same time, the standard deviations indicate that a considerable amount of inter-speaker variation can be found. If patte and pâte are read aloud in random order, speakers show a variety of realizations, summarized in Table 4. For a hearer to be able to perceive a qualitative difference between two vowels, the F2 difference should be at least 1.5% (cf. Rietveld and van Heuven, Reference Rietveld and van Heuven2001: 202). With respect to the overviews summarizing the /a/-/ɑ/ differences, this holds, roughly speaking, for differences larger than 25 Hz.
Individual F2 differences

In random order, a considerable number of speakers (38 out of the 83) maintain a very large difference of more than 100 Hz, a second group (19 out of the 83) preserves no or only a negligible F2 difference, smaller than 26 Hz. Then there is also a third group (26 out of the 83) that lies in between the two extremes, with a F2 difference between 26 and 100 Hz. If the two tokens are read in direct succession, the picture changes. In this condition, most speakers realize larger F2 differences in the minimal sequence than in the random condition. The number of speakers with a difference smaller than 26 Hz in Table 4b is somewhat smaller than in Table 4a, and the number of speakers in the mid-category remains more or less stable. Most importantly, when directly confronted with the contrast, more speakers fall into the category with differences larger than 100 Hz (n = 46), and even more striking is the near doubling of the number of speakers who produce a difference larger than 251 Hz (i.e. 12 in random, 20 in minimal condition).
The statistical analysis on the Bark values, however, does not yield a significant effect of the within-subject factor ‘condition’.Footnote 18 Even though speakers thus tend to accentuate the F2 contrast when confronted with the minimal pair, this condition does not contribute significantly to the variation in F2. For a considerable number of speakers, the contrast is just fully or partially neutralized in any context, the posterior vowel merging with its anterior counterpart (section 4.3 will show this in more detail). The actual F2 difference realized is rather dependent on other factors than ‘condition’. That is, the between-subject factors ‘region’ and ‘generation’, significantly influence the absence or presence of a F2 difference.Footnote 19 Even though some regions are more radical neutralizers than others (compare Nantes to the Aveyronnais à Paris for instance), the entire metropolitan French territory is affected by a reduction of the F2 difference, with the strongest effects in Midi French. This neutralization in vowel quality is also related to the age of the speaker where the speakers of the third generation, in particular, tend to maintain the contrast, while the two youngest generations are less conservative.
4.2.3 Length difference
Speakers not only differ from each other with respect to the spectral parameters of the vowels, they also show durational differences. Pâte is longer than patte in 126 out of the 166 renditions; the reverse scenario, where patte is longer than pâte, occurs 40 times. When listed randomly, pâte is longer than patte 64 times, when they are read as a minimal pair, pâte is longer than patte 62 times. 26 speakers produce considerably longer absolute differences in the minimal pair sequence, the realizations of 37 speakers fall in the same range in both environments, and for 20 speakers, the difference in the random sequence exceeds the length difference in the minimal condition. For a length difference between two vowels to be perceivable for the listener, there needs to be at a least 10% durational difference (cf. Rietveld and van Heuven, Reference Rietveld and van Heuven2001: 202–203).
The overall average length difference between the random and minimal sequence is about 10 ms, and in all regions, the average difference realized in the random order is smaller than, or about equal to, the average difference produced in the minimal sequence. Still, as the standard deviations show, speakers differ from each other as far as the precise length differences between the two words and between the two contexts are concerned. A more detailed overview of the individual scores is provided in Table 5.
Individual length differences
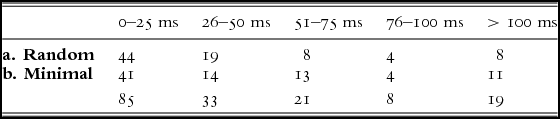
In the random context, most speakers realize a durational difference that does not exceed 50 ms. This slightly changes in the minimal pair condition, where the number of speakers in the lower categories decreases, and more speakers can be found in the three upper categories. As noted above, striking differences exist in the speakers’ individual behaviours: some never produce a length contrast, some always produce a certain length contrast, some realize (large) length differences in the minimal sequence, but no or a small(er) difference in the random context, and for yet others the pattern is the reverse.
In line with the qualitative parameters discussed above, the length difference realized in the random sequence does not turn out to differ significantly from the length difference realized in the minimal sequence.Footnote 20 Yet, the realized difference between patte and pâte as such appears to be sensitive to the age of the speaker and the region from which he or she originates.Footnote 21 The older generation manifests this length cue most clearly, but different length contrasts can be found across the entire metropolitan French territory, with again the southern varieties turning out to be the strongest neutralizers.
4.2.4 F1, F2 and length
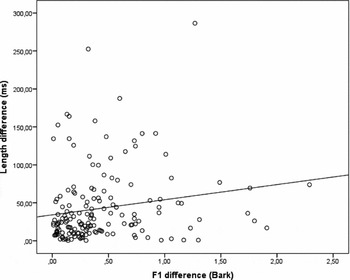
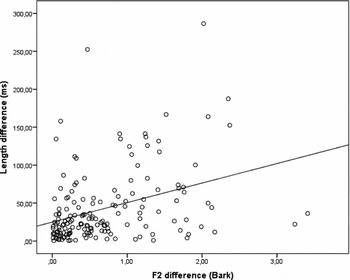
The results described thus far have focused on the contrastive parameters separately, but speakers show different patterns when it comes to the exact preservation or neutralization of the anterior-posterior contrast. Graphs 4 and 5 show scatter plots of the correlation between the degree of F1 or F2 contrast maintenance and the presence or absence of a length difference.
F1 and length (r2 = 0.030)

F2 and length (r2 = 0.130)

The squared correlation coefficient (r2) indicates that the link between F1 and length is very weak: only 3% of the variation in length can be ascribed to variation in F1. For the F2, the correlation is somewhat stronger, but F2 variations still only account for 13% of the variation in length. Length thus seems to be a parameter that stands on its own, rather than one that purely enhances either F1 or F2 cues.
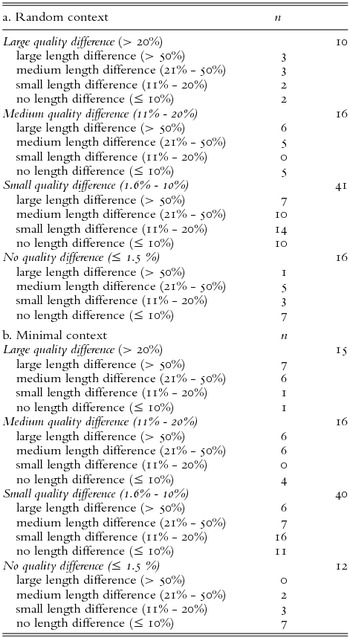
Let us focus on the two parameters that seem, overall, to be the most crucial ones in the actual manifestation of the /a/-/ɑ/ contrast: the degree of frontness and length. Some speakers neutralize both length and the F2 difference, others only neutralize length, others only neutralize the F2, and yet others show both a length and a F2 quality difference. An overview of the different patterns is given in Table 6.
Patterns of contrast maintenance and reduction

If no qualitative difference (i.e. ≤ 1.5%) is maintained between the two vowels, speakers mostly produce no, or only a small length difference. Striking, though, are the medium and large length differences for the randomly ordered tokens. In the category up to 10% quality difference, the length is still short or absent in more than 50% of the cases, but at the same time, larger differences show up as well.
This tendency gets more pronounced if a medium or large qualitative difference is realized, and where the medium and large length differences predominate, both in the random context and the minimal pair sequence. If length is maintained, it tends to be manifested with the larger F2 differences, and especially in the minimal pair context. At the same time, these results strongly suggest that the contrast under discussion has become a very unstable one. The contrast is fully neutralized by seven speakers in the random sequence and by seven speakers in the minimal pair context. In other cases, some kind of awareness of the contrast emerges, reflected by a smaller or larger difference in quality and/or length. Especially in the minimal pair sequence, speakers often become uncertain or get confused. The realizations may be preceded by a longer pause or hesitation, and the realization as such may sound hesitant as well. The unstable nature of the contrast is also witnessed by the fact that productions arise where the contrast is reversed: pâte is realized with a front vowel and patte with a back one, and/or the vowel in patte may be longer than the vowel in pâte.
It appears, then, that people may be aware of the fact that a distinction should be made between the two words, but they have lost confidence about the exact nature of the contrast. Given the results described here, it is possible that the contrast is an effect of age-grading (cf. Labov, Reference Labov1994: 73–112), meaning that speakers only start contrasting the two vowels at a certain age, but it is much more likely that the results indicate an ongoing change, which is gradually proceeding in the different areas of France and which will be completed once the older generation has passed away.
4.3 Degree of fronting
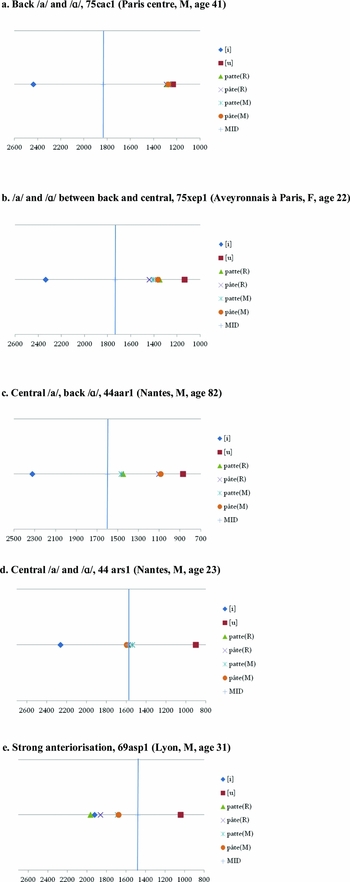
The F2 results described thus far provide information on the distance between the two low vowel tokens, but they do not tell anything about the precise location of these vowels with respect to the other French vowels, or in other words, the exact degree of ‘frontness’ or ‘backness’. In order to get an image of the vocalic spaces, a mean F2 value was derived for the vowels [i] and [u] for every speaker individually. These values give an approximation of the upper and lower bounds of the anterior-posterior dimension, and were obtained by averaging the F2 values (again measured at the midpoint of the vowel) of all instances of the vowel figuring in the word list. Positioning the F2 values of the a tokens in the patte-pâte items with respect to the F2 values of the extreme front and extreme back vocalic segments, gives a reasonable indication of the degree of frontness or backness of these vowels.
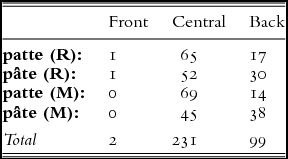
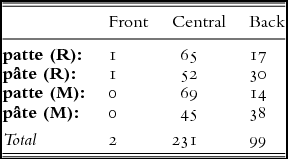
The relative position of the a tokens with respect to the front and back vowels not only varies considerably between the minimal pair and random contexts, but also between the speakers individually. In the more natural random order, some speakers articulate /a/ and /ɑ/ in the same range as the back vowels, for others the /a/ tokens are central whereas /ɑ/ is a back vowel, yet others realize both /a/ and /ɑ/ as centralized or genuine central vowels, or even as tokens that tend to move towards the front vowel region. The overall patterns are given in Table 7 and illustrated in Graph 6 by plots of the F2 values of the random sequence (R) and the minimal pair (M). The F2 values (in Hz) are given on the x-axis, the vertical line indicates the arithmetic midpoint between the [i] and [u] values.Footnote 22
/a/ - /ɑ/ realizations
/a/ - /ɑ/ realizations

The patterns in Table 7 show a considerable amount of variation, with a strong overall dominance of central a tokens. For the moment, ‘fronting’ thus seems to involve centralization, transforming the anterior-posterior contrast for a considerable number of speakers into a situation with two neutralized, or minimally distinct, central low vowels.
5. DISCUSSION AND CONCLUSION
This study has focused on the low vowels in the words patte and pâte, members of a minimal pair where the vowel occurs in stressed position. If speakers still maintain a difference between the front and back vowel, one would expect them to be most inclined to produce it in such a context. By focusing on these two particular tokens, the present study is in some sense more restricted than the studies of Lennig (Reference Lennig1978) and Hansen and Juillard (Reference Hansen and Juillard2011). At the same time, though, by broadening the scope of our acoustic analysis to vowel quality and length in nine varieties of metropolitan French, the results presented above add to, complement and refine our understanding of the loss of the low vowel contrast in France.
In line with extant observations, the PFC corpus data from metropolitan France show that posterior tokens are more likely to occur in stressed position, yet they also clearly demonstrate that even in this environment the phonetic and phonological contrasts are collapsing. Next to stress, Hansen and Juillard (Reference Hansen and Juillard2011: 339) also listed lexical aspects (orthography/frequency) as a factor determining the quality of the low vowel. They claimed that lexical tokens containing â are nowadays only exceptionally pronounced with a posterior vowel. The present study does not deny the influence of lexical factors as such, but as far as the grapheme â in pâte is concerned, we have found the exact opposite: it may actually trigger the preservation of the posterior variant, which thus rather suggests that speakers have some kind of lexical knowledge saying that specific tokens demand, or once demanded, a back vowel. Given these contradictory findings, it may be worthwhile to further explore the influence of spelling and word frequency on the degree of back vowel maintenance.
Our results demonstrate that the change has been effected across the European French territory to various degrees. Speakers display large differences in the actual preservation of a qualitative and/or quantitative contrast, and the variation (both inter- and intra-speaker) is such that the existence of two types of a in the metropolitan French vowel inventory can no longer be assumed. A perceptual evaluation task may shed more light on the actual communicative implications of the contrast reduction: to what extent are listeners actually still able to detect a difference? Future research also has to determine whether this low vowel movement is an isolated change, or whether some general tendency of fronting of the French back vowels is taking place, and constitutes a general shift with o-fronting (cf. Nguyen and Fagyal, Reference Nguyen and Fagyal2007; Hansen and Juillard, Reference Hansen and Juillard2011, and references therein). Time will tell how fast the change will proceed and when the traces of the contrasts found among the PFC speakers will have fully disappeared.
APPENDIX: DESCRIPTIVE STATISTICS OF THE SOCIOLINGUISTIC VARIABLES
Mean F1 differences (Hz)

Mean F2 differences (Hz)

Mean length differences (ms)