I. INTRODUCTION
Hydrogenated amorphous carbon (a-C:H) films consist of carbon atoms of both graphitic type bonding (sp 2) and diamond type tetrahedral bonding (sp 3). Similar to their counterparts, like diamond, graphite, and hydrocarbon polymers, The hydrogenated amorphous carbon films demonstrate some extraordinary properties such as excellent mechanical hardness, heat conduction, high electrical resistance, high transmittance of infrared (IR) and ultraviolet (UV) light-cut filter, and optical transparency in the infrared region. Reference Robertson1–Reference Pearce, Marks, McKenzie and Bilek4 These properties enable a-C:H films to be of wide applications in magnetic media, optical lens, biomedical and micro-/nano-electromechanical devices, and optical coating. Reference Robertson5–Reference Singh, Pandey, Chand, Biswas, Bhattacharya, Dash, Tyagi, Dey, Kulkarni and Patil9 In addition, a-C:H films are promising as antireflection coating, p-type window layer for solar cells, Reference Allon-Alaluf, Appelbaum, Maharizi, Seidman and Croitoru10,Reference Lee and Lim11 and active layer for light emitting diodes (LED), Reference Hattori, Kruangam, Toyama, Okamoto and Hamakawa12,Reference Hamakawa, Toyama and Okamoto13 etc.
The hydrogenated amorphous carbon films can be prepared by various techniques, such as plasma enhanced chemical vapor deposition (PECVD), Reference Shim, Chi, Baik and Lee14 pulsed laser deposition, Reference Lu, Huang, Huan and Luo15 ion beam assisted deposition, Reference Weissmantel, Bewilogua, Dietrich, Erler, Hinneberg, Klose, Nowick and Reisse16 sputtering, Reference Park, Cho and Hong17 and filtered cathodic vacuum arc. Reference Tay, Zhao and Chua18 However, PECVD is the most suitable and widely used technique, which enables the growth of a-C:H films on a variety of substrates, and in a wide temperature range, especially at room temperature. Moreover, PECVD also produces the uniform deposition of a-C:H films over large area. Reference Dwivedi, Kumar, Malik, Rauthan and Panwar19 To our knowledge, the effect of deposition parameter such as substrate temperature, gas flow, deposition pressure on the structural and optical properties have been widely studied. Reference Oliveira, Cruz and Aguiar20,Reference Wu, Wang and Kuo21 However, the reports about the effect of radio frequency (RF) power on chemical bonding and optical properties are few. More importantly, the chemical bonding and optical properties are useful to the optimization of process parameters and application of a-C:H films in different areas. Therefore, the effect of RF power on the structural and optical properties of a-C:H films deposited by PECVD has been researched in this work.
In this work, the a-C:H films were deposited on three kinds of substrates for different measurements (for example, FTIR test on crystalline KBr and UV–Vis spectrometry test on glass). However, different types of substrate may provide different physical properties and structure of a-C:H films. Reference Ahmad, Roy, Rahman, Okpalugo, Maguire and Mc Laughlin22 To exclude the influence of different substrates on the structural and optical properties of a-C:H films, a buffer layer of a-SiC:H is designed and adopted prior to the deposition of a-C:H films, which can also improve the adherence of a-C:H films on the substrates. Reference Schwarz, Heeg, Rosenberg and Wienecke23,Reference Cemin, Bim, Menezes, Aguzzoli, da Costa, Baumvol, Alvarez and Figueroa24 The fabrications are also conducted by PECVD. As a result, the effect of the RF power on the chemical bonding properties such as sp 3/sp 2, H concentration on the optical properties such as FTIR and transmittance is investigated. In addition, the excellent transmittance results indicate that optimal a-C:H films is suitable for the applications, for example, acting window layer for solar cells.
II. EXPERIMENTS
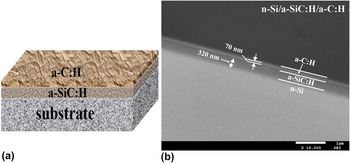
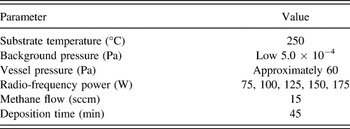
Via RF-PECVD technique (frequency f = 13.56 MHz), bilayer a-SiC:H/a-C:H films were deposited on single-crystal silicon (100), crystalline KBr and glass (microscope slides) substrate, respectively [Fig. 1(a)]. a-SiC:H films were deposited on the three substrates using silane and methane under the conditions of substrate temperature of 250 °C, (RF power of 150 W) and the pressure of 60 Pa. The deposition time is 30 min. Then, a-C:H films were subsequently deposited on a-SiC:H thin films at different RF power from 75 W to 175 W the step of 25 W. The deposition settings are given in Table I. All depositions were carried out under the optimal parameters of 250 °C and the chamber pressure of approximately 60 Pa. Prior to depositions, the background pressure of the chamber is about 3.0 × 10⁻⁴ Pa.
(a) Schematic view of a-C:H film and a-SiC:H layer on substrate; (b) the cross-section view of n-Si/a-SiC:H/a-C:H.

The deposition parameter for a-C:H.

Before deposition, to obtain good adhesion of the films, the silicon and glass substrates were cleaned by the following procedure: ultrasonic cleaning in acetone, rinsing with deionized water, ultrasonic cleaning in alcohol, and rinsing with deionized water. The silicon wafers were additionally etched by 25% HF to remove the oxide layer on the substrate surface.
The morphology and thickness of the films were examined by scanning electron microscopy (SEM; JSM-7500F, JEOL Ltd., Tokyo, Japan) and atomic force microscopy (AFM; INNOVA, Bruker Corporation, Billerica, Massachusetts). Raman spectrometry (HR800, Horiba Jobin Yvon Company, France, Paris) and Fourier transform infrared spectroscopy (FTIR; NEXUS, ThermoNicolet Corporation, Madison, Wisconsin) were used to characterize the microstructure and bond configurations of the films. The optical properties of the films were investigated by UV–Vis spectrometry (UV-2550v, Shimadzu Corporation, Kyoto, Japan).
III. RESULTS AND DISCUSSION
A. Microstructure analysis
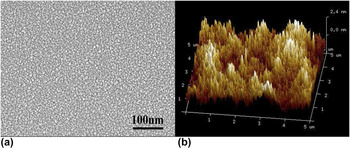
The cross-section image of n-Si/a-SiC:H/a-C:H which a-C:H films prepared at RF power of 75 W is shown in Fig. 1(b), where one can clearly see the presence of three well-defined regions including n-Si, a-SiC:H, and a-C:H. The respective thicknesses of the a-SiC:H layer and a-C:H layers are approximately 320 and 70 nm. Figure 2 shows the typical top view surface of SEM and typical AFM images of the films prepared at RF power of 175 W. The results of SEM show that the a-C:H films have uniform distribution, considerable smooth, homogeneous morphology, and carbon particle with nanometer in size. As is seen in Fig. 2(b), the scale bar is as small as 100 nm and the surface morphologies demonstrate that all fabricated a-C:H films homogeneous and compact. There are no visible difference from SEM and AFM images for these a-C:H films deposited at different powers from 75 W to 175 W. However, the RF power produces an obvious influence on chemical bonding and optical properties as seen in the next sections.
(a) The typical top view surface of SEM and (b) the typical AFM images of the films prepared at RF power of 175 W.

B. Fourier transform infrared spectroscopy (FTIR) analysis
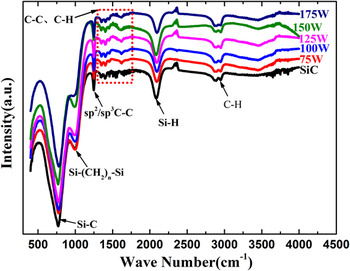
To study the bonding structure of the films and increase the signal/noise ratio of FTIR measurements, the a-C:H films on the KBr substrates were used to FTIR measurements. Because KBr is transparent from the near ultraviolet to long-wave infrared wavelengths and therefore it has no significant optical absorption in its high transmission region. The FTIR measurement was conducted in the wave-number interval from 400 to 4000 cm−1 with a resolution of 2 cm−1. Figure 3 shows the typical FTIR spectra of the a-SiC:H film deposited on KBr substrates as well as the a-C:H films grown on the a-SiC:H/KBr substrates at different RF powers. From Fig. 3, it is observed that the characteristic bands of the films: a broad contribution of Si–C bonds is around 780 cm−1, a band is around 998 cm−1, which is attributed to Si–(CH2) n –Si bonds, as well as the band is located around 1245 cm−1 referring to the different configurations of C (sp 2, sp 3), the band corresponding to Si–H bonds is around 2100 cm−1. In addition, one corresponding to the stretching vibrations of C–H bonds is in the 2800–3000 cm−1 area, one connecting with the skeleton vibrations of C–C bonds and with bending vibrations of C–H bonds is in the 1280–1680 cm−1 area. The measurement results indicate that a-SiC:H film and a-C:H films are successfully achieved, which are further supported by the relevant literature. Reference Robertson1,Reference Glaude, Thomas, Tomasella, Badie and Berjoan25–Reference Dischler, Bubenzer and Koidl28
FTIR transmission spectra of the a-SiC:H film deposited on KBr substrates and a-C:H films grown on the a-SiC:H/KBr substrates at various RF powers.

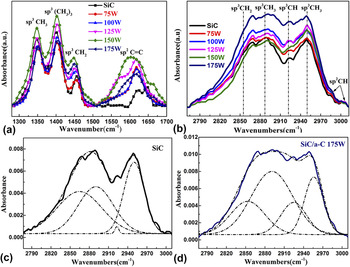
Figure 4 shows the FTIR absorption spectra of the fabricated films. The skeleton vibrations of C–C bonds and bending vibrations of C–H bonds corresponding to absorption peaks in the wavenumbers 1280–1700 cm−1 region are shown in Fig. 4(a). The four main peaks are located at 1350, 1400, 1450, and 1620 cm−1, which correspond to sp 3 CH3, sp 3 (CH3)3, sp 3 CH2, and sp 2 C=C aromatic or olefinic, respectively. Reference Robertson1,Reference Dischler, Bubenzer and Koidl28,Reference Couderc and Catherine29 Fig. 4(b) exhibits the stretching vibrations of C–H bonds related to absorption peaks in the 2750–3012 cm−1 region. By the fitting, it is found that the four Gaussian peaks are at 2855, 2890, 2920, and 2955 cm−1, respectively. The absorption peaks at 2855 and 2890 cm−1 correspond to sp 3 CH2 and sp 3 CH3 symmetrical modes whereas the peaks observed at 2955 cm−1 ascribes to sp 3 CH3 asymmetrical mode. In addition, the peak at 2920 cm−1 refers to sp 3 CH or the sp 3 CH2 asymmetric mode. Reference Robertson1,Reference Dischler, Bubenzer and Koidl28–Reference Akkerman, Efstathiadis and Smith30 Figs. 4(c) and 4(d) represent the deconvoluted FTIR absorbance spectra of a-SiC:H film and a-SiC:H/a-C:H films at RF powers 175 W in the wave number range of 2750–3012 cm−1. It shows that the a-SiC:H film has less sp 3 CH bonding content, which indicates that the carbon of a-SiC:H film serve as end groups in the bond chain. From the areas of sp 2, sp 3 C–C bonds, and C–H bonds peaks, we can estimate the binding ratio of sp 3 to sp 2. Reference Dischler, Bubenzer and Koidl28,Reference Couderc and Catherine29 The total content of H bonded to C, N H, was estimated from the integrated intensity of the stretching vibrations of C–H bonds, using the following equation:
 $${N_{\rm{H}}}\left( {{\rm{c}}{{\rm{m}}^{ - 3}}} \right) = A\int {{{\alpha \left( \omega \right)} \over \omega }} {d_\omega }\quad ,$$
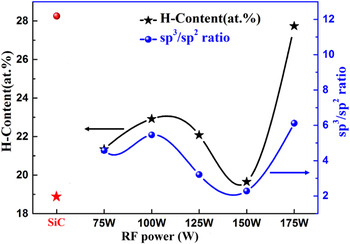
where A is a normalization factor proportional to the inverse of the absorption strength and changes on the position of the absorption peak, and α(ω) is the absorption coefficient at each frequency ω. Here A = 1.35 × 1021 cm−3 has been assumed to estimate N H for all the films. Reference Akkerman, Efstathiadis and Smith30,Reference Basa and Smith31 The estimated sp 3 to sp 2 binding ratio and H-content are plotted in Fig. 5. It is seen that the sp 3 to sp 2 ratio value and H-content present an irregular change, which can be described by using the sublantation model. Reference Lifshitz, Kasi, Rabalais and Eckstein32,Reference Robertson33
FTIR absorption spectra of the films in the region of (a) 1280–1700 cm−1, (b) 2750–3012 cm−1, (c) the deconvoluted FTIR absorption spectra of a-SiC:H film deposited on the KBr substrates at region 2750–3012 cm−1; (d) the deconvoluted FTIR absorption spectra of a-C:H films grown on KBr/a-SiC:H complex substrates at r.f.-powers 175 W in the wavenumbers 2750–3012 cm−1 region.

The variation of H-content and sp 3/sp 2 ratio with r.f.-power.

For deposition of a-C:H from CH4 plasma, the situation is complex since many molecular (CH4, C2H6, C2H4, and H2), radicals and atom (CH3, CH2, CH, C2H5, and H), ions species (CH4 +, CH3 +, CH5 +, and C2H5 +) interact with the growing film. Reference Rhallabi and Catherine34,Reference Mantzaris, Gogolides, Boudouvis, Rhallabi and Turban35 Among these species, the CH3 radical has a large amount of number density and plays a major role as precursors in the carbon film deposition. At low RF power (or low ion energies), the film deposition process is attributed to the CH3 radicals adsorption physically on the growing film surface (weakly bonded precursor state) and then transfer to the chemically bonded state by means of reactions with hydrocarbon ions. Reference Mutsukura and Saitoh36 So the H-content of the films and sp 3 to sp 2 binding ratio increases at low RF power. With the RF powers increasing, the surface coverage decreases and the content of ions species increases. The ions can dehydrogenate and leave sp 3 site. Along with the increase of RF power, H-content of the films and sp 3 to sp 2 binding ratio begin to decrease. While higher RF power (higher ion energies) lead to the direction incorporation into mainstream, sp 2 to sp 3 conversion by compression at constant H content and hydrogenation gives sp 3 sites. As a result, the H-content and sp 3 to sp 2 binding ratio increases again. Reference Rhallabi and Catherine34,Reference Mantzaris, Gogolides, Boudouvis, Rhallabi and Turban35
C. Raman spectrum analysis
Raman spectroscopy is one of the most popular nondestructive and principal characterization tools to characterize the structural change of carbon materials. For amorphous carbon films, the Raman-spectrum analysis includes deconvolution of the spectrum with two main Gaussian peaks: the G-peak places in the range 1555–1600 cm−1, as it does arise from the C=C sp 2 stretch vibrations of aromatic rings and olefinic or conjugated carbon chains; the D-peak around 1350 cm−1 is due to the breathing modes of sp 2 atoms in ring. Reference Robertson37,Reference Liu, Yamaguchi, Umehara, Deng, Kousaka and Murashima38 The linewidths, positions of the G graphite peak and D disordered peak, and their intensity ratios can reliably predict hydrogenation, optical gap, and other mechanical properties. Reference Schwan, Ulrich, Batori, Ehrhardt and Silva39,Reference Ferrari and Robertson40 I(D) and I(G) are used to describe the intensity of G graphite peak and D disordered peak.
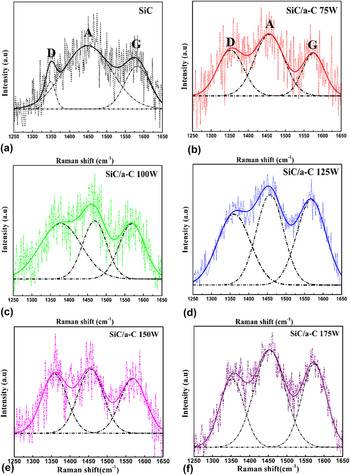
Figure 6 shows the Raman spectra of a-SiC:H film and a-C:H films with different powers on the SiC:H and glass complex substrate. To extract the information from Raman spectra and determine the values of the I(D)/I(G) ratio, D, and G-peak positions, the spectra were decontaminated with Gaussian function and highlighted with dashed line peaks. It should be mentioned that the rather high nonlinear background (or a wide spectral band) centered approximately near 1450 cm−1 is displayed in all spectra simultaneously with G-and D-bands. It may arise from vibrations of C–H Reference Schwan, Ulrich, Batori, Ehrhardt and Silva39,Reference Colthup, Daly and Wiberley41 or amorphous graphite, Reference Nistor, Van Landuyt, Ralchenko, Kononenko, Obraztsova and Strelnitsky42 the later line denotes hereafter as A-band. The size of the graphite cluster (La) depends on the intensity ratio of the D band to the G band [I(D)/I(G)] based on the following relationship Reference Robertson1,Reference Cappelli, Orlando, Mattei, Zoffoli and Ascarelli43 :
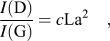 $${{I({\rm{D}})} \over {I({\rm{G}})}} = c{\rm{L}}{{\rm{a}}^{\rm{2}}}\quad ,$$
where c is equal to ∼0.0055 (for La in Angstrom). Reference Paulmier, Bell and Fredericks44,Reference Sui, Gao, Cai and Zhang45
Raman spectra of a-SiC:H and a-SiC:H/a-C:H films deposited on glass with different powers of (a) a-SiC:H films, (b) a-SiC:H/a-C:H films 75 W, (c) 100 W, (d) 125 W, (e) 150 W, and (f) 175 W.

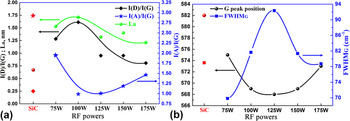
Figure 7(a) shows the I(D)/I(G) integral intensities ratio versus RF power. This ratio values demonstrate an increase with the power from 75 W to 100 W reaching the maximum value of 1.61. But, the values decrease when the powers are increased from 100 W to 175 W. Using the expression (2), the crystallite size La changes from 0.5 nm to 1.75 nm as seen from the green line in Fig. 7(a). Figure 7(b) shows that the G-peak position moves from ∼1582 cm−1 to ∼1568 cm−1 by increasing the RF power till 125 W. By this enhancement, the half-width of G-peak increases with the increasing power. At the higher power, the G peak position moves back to ∼1573 cm−1 and the half-width values of G-peak reduce with increasing RF power. For the Raman spectra of carbon based materials, the G-peak position, move to higher wave number due to sp 2 content or cluster size increases. Reference Shin, Lee, Lee and Eun46 The half-width of G-peak increases linearly with increasing order of carbon films. Reference Ferrari and Robertson40,Reference Ferrari, Rodil and Robertson47 In combination with FTIR results, it can be concluded that (i) at the initial stage (namely, the power is less than 100 W), the graphitic clusters size increases and the G-peak position moves to greater wave number whereas the sp 2 content decreases; (ii) in the middle range of 100 W–150 W, the graphitic clusters size is decreased while the sp 2 content and the number of graphitic clusters are increased. (iii) from 150 W to 175 W, all of the graphitic clusters size, number of graphitic clusters, and the sp 2 content decreases. The G-peak position moves down. The trend is consistent with the literature. Reference Al-Jishi and Dresselhaus48–Reference Cho, Veirs, Ager Iii, Rubin, Hopper and Bogy50 The ratio of integral intensities I(A)/I(G) show a decrease first and then an increase with the increasing RF power, which indicates a structural transition from sp 2-bonding amorphous graphite to crystalline graphite resulting in increased graphitic clusters size at lower power. In contrast, for higher RF power the graphitic clusters size decrease and the number of graphitic clusters increase result in A-peak intensity increase.
(a) The integral intensity ratio I(D)/I(G), I(A)/I(G), and calculated graphitic cluster size La versus r.f.-power; (b) positions and FWHM of G peak versus r.f.-power.

D. Optical properties analysis
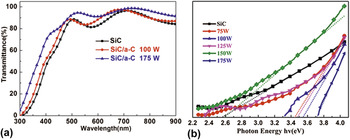
Figure 8(a) shows the transmittance of a-SiC:H film, and a-SiC:H/a-C:H films with a-C:H films prepared at RF power of 100 W and 175 W, respectively. The optical and structural properties of a-SiC:H film and a-C:H films prepared at various RF power are list in Table II.
(a) Transmittance spectra for a-SiC:H film and a-SiC:H/a-C:H films deposited on glass; (b) optical gap of a-C:H films prepared at different r.f.-powers.

Optical and structural properties of a-SiC:H film and a-C:H films prepared at various RF power.

In contrast to a-SiC:H film, the transmittance of a-SiC:H/a-C:H films are enhanced. Particularly, the transmittance of a-SiC:H/a-C:H films with a-C:H films prepared at RF powers 175 W, reaches 94.2% at the absorption wave length 550 nm (as shown in Table II). It indicates that a-C:H films can be grown onto silicon carbide layer as an antireflection coating. Figure 8(b) shows the optical energy gap of a-C:H films deposited on a-SiC:H/glass prepared at different RF powers. The optical gap of a-C:H films are calculated by the well-known Tauc equation. Reference Robertson1,Reference Herak, McLeod, Kao, Card, Watanabe, Katoh, Yasui and Shibata51 Table II lists the optical and structural properties of the fabricated a-SiC:H film and a-SiC:H/a-C:H films. It can be seen that the optical gaps of a-C:H films are in the range of 2.89–3.71 eV and increase with the increasing of RF power. Based on the discussion above, we can conclude that the transmittance of a-SiC:H/a-C:H films have the same variation trend as the increasing the sp 3 to sp 2 ratio and H-content. According to the cluster model proposed by Robertson and O’Reilly, Reference Robertson and O’reilly52 a-C:H contains both sp 2 and sp 3 sites, with sp 2 sites segregated into clusters embedded in a sp 3-bonded matrix. The difference between the π–π* gap of the sp 2 sites and the σ–σ* gap of the sp 3 sites creates very strong static disorder fluctuations. The optical gap of a-C:H films depends primarily on the sp 2 fraction, followed by the number of 6-fold rings in the graphitic clusters. Reference Robertson53 The influence of RF power on the optical gap of a-C:H here is due to the percentage of sp 2 coordinates, which changes along with the variations of the RF power.
IV. CONCLUSIONS
a-C:H films/a-SiC:H/substrates were fabricated to investigate the effect of the RF power on the structural and optical properties of a-C:H films. The ratios of sp 3 to sp 2 of carbon atoms and H contents are determined in the power range of 75–175 W. The ratios of sp 3 to sp 2 of carbon atoms and hydrogen contents in the a-C:H films changes as a function of RF powers. The increase of sp 3 to sp 2 ratio leads to the increase of transmittance and optical gap of a-C:H films. At the optimal power of 175 W, the optical transmittance of a-C:H films demonstrate the best value with average value of 90% in the wave length range of 350–900 nm, which is higher than the transmittances of a-C:H films deposited at other powers as well as SiC thin films. The highest transmittance value is up to about 95% at the wave length 550 nm. These results show the optimal a-C:H films, which are promising for the applications in solar cells acting a window layer and antireflection layer.
ACKNOWLEDGMENTS
This study was supported by the National Natural Science Foundation of China (11374181 and 61604087).