INTRODUCTION
For some years now, it has been evident that dairy cow nutrition models are vital to the continued success of the dairy industry. In addition, the production emphasis in several places in the world has shifted from milk volume and fat to include also milk protein concentration and yield. Mathematical models of ruminant nutrition have been employed for over three decades (Chalupa & Boston Reference Chalupa and Boston2003) and have stimulated improvements in feeding cattle. Accumulated research knowledge and complete data sets available in recent years combined with different mathematical approaches have led to improved nutrition models.
Several mathematical models of ruminant nutrition have been developed in the past (Tedeschi et al. Reference Tedeschi, Fox, Sainz, Barioni, Medeiros and Boin2005) and it is likely that frequency of use will increase to support decision making not only in the nutrition of cattle, but also for other aspects including farm economics, animal management and assessment of environmental impact (Tylutki et al. Reference Tylutki, Fox and McMahon2004).
The Cornell-Penn-Miner (CPM) Dairy was a product of the combined effort by researchers at Cornell University, University of Pennsylvania and the W.H. Miner Agriculture Research Institute. The development of version 1 (CPM 1.0) was considered by Boston et al. (Reference Boston, Fox, Sniffen, Janczewski, Munsen, Chalupa, McNamara, France and Beever2000) who described the conversion of the Cornell Net Carbohydrate and Protein System (CNCPS 4.0; Fox et al. Reference Fox, Tedeschi, Tylutki, Russell, Van Amburgh, Chase, Pell and Overton2004) into this applied model that is being used by the dairy industry. The CNCPS and consequently the CPM Dairy have been used and evaluated using data from several places in the world.
Kolver et al. (Reference Kolver, Muller, Barry and Penno1998) assessed the reliability of the CNCPS predictions for grazing dairy cows from four studies conducted in New Zealand and in the US. The authors reported the model provided good estimates of changes in body condition scores (BCS; R 2=0·78), energy balance (R 2=0·76), blood urea (R 2=0·94), microbial N flow (R 2=0·88), dry matter intake (DMI; R 2=0·80) and ruminal pH (R 2=0·47). The predictions of milk production were sensitive to changes in pasture lignin content, physical effective fibre, rate of fibre digestion and amino acid composition of ruminal microbes. In addition, metabolizable energy (ME) was described to be the first limiting factor when lactating cows grazed high quality pastures.
In predicting milk production of individually fed high-producing dairy cows, Fox et al. (Reference Fox, Tedeschi, Tylutki, Russell, Van Amburgh, Chase, Pell and Overton2004) indicated the CNCPS was able to account for 88% of the variation with a mean bias of 1·8 kg/d, which corresponds to 0·055 of the model predicted mean. These authors indicated that, when metabolizable protein (MP) was first limiting, the model adequacy was superior to when ME was first limiting.
More recently, using data from two experiments, Chaves et al. (Reference Chaves, Brookes, Waghorn, Woodward and Burke2006) evaluated the CNCPS for grazing dairy cows supplemented with silages (0·30–0·40 of DMI). The authors observed no significant mean bias in predicting DMI, milk yield, or body weight (BW) changes. However, the precision (R 2) of the model was lower than previously reported by Kolver et al. (Reference Kolver, Muller, Barry and Penno1998) and Fox et al. (Reference Fox, Tedeschi, Tylutki, Russell, Van Amburgh, Chase, Pell and Overton2004). It ranged from 51 to 59%, indicating a satisfactory prediction of milk yield when cows were neither gaining nor losing BW, but a systematic bias was observed probably due to the partition of energy between milk yield and BW changes. Tedeschi et al. (Reference Tedeschi, Seo, Fox and Ruiz2006) developed a model to account for changes in BW and/or BCS that are not accounted for when estimating ME- or MP-allowable milk production from the intake above or below animal requirements for maintenance, pregnancy and growth. The authors recommended adjustment for BCS changes in a period longer than 7 days for accurate prediction of milk production of dairy cows.
The objectives of the current paper are: (1) to provide a description of the changes made to the CPM Dairy 1.0 in developing the CPM Dairy 3.0 and (2) to assess the adequacy of the CPM Dairy 3.0 in predicting milk production of high producing-lactating dairy cattle.
MATERIAL AND METHODS
Background
The CPM Dairy 1.0 was originally programmed in Microsoft C™ and was released in October 1998. The CPM Dairy 2.0 and 3.0 are 32-bit Microsoft Windows applications and were programmed in Microsoft Visual Basic 6.0™ and Microsoft C++ 6.0™ with a Microsoft Access 2000™ database capability to store input and output values. The CPM Dairy 2.0 was an intermediate release that allowed for software development and testing. It was only available for selected users of the CPM Dairy 1.0 to provide feedback on software design, focusing on field implementation and usability. Considerable effort was directed towards the development of the CPM Dairy 3.0 to meet the guidelines discussed by Newman et al. (Reference Newman, Lynch and Plummer2000) to be successfully used as a decision support system for dairy cattle.
Development of the CPM Dairy 3.0
The CNCPS model was developed to define more accurately rumen bacterial growth and whole animal requirements, to assess feed utilization and to predict production responses (Fox et al. Reference Fox, Tedeschi, Tylutki, Russell, Van Amburgh, Chase, Pell and Overton2004). The CNCPS was developed from basic principles of rumen function, microbial growth, feed digestion and passage rates and animal physiology. It also accounts for farm-specific management, environmental and feed characteristics. The system can be applied at the farm level because feeds are characterized according to fractions that are measured by most feed analysis laboratories. The CPM Dairy 3.0 is based on the CNCPS 5.0 level 2 of solution biological core (Fox et al. Reference Fox, Tedeschi, Tylutki, Russell, Van Amburgh, Chase, Pell and Overton2004). The main modifications towards the development of the CPM Dairy 3.0 were the inclusion of a new carbohydrate fractionation scheme (Lanzas et al. Reference Lanzas, Sniffen, Seo, Tedeschi and Fox2007) and a new lipid sub-model (Moate et al. Reference Moate, Chalupa, Jenkins and Boston2004). A revised feed dictionary was added to support these additions.
Carbohydrate fractionation scheme
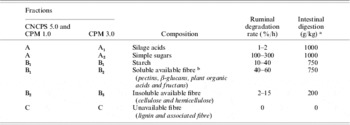
The comparison of carbohydrate fractionation schemes in CNCPS 5.0 and CPM Dairy 3.0 are listed in Table 1. In the CNCPS 5.0 and CPM Dairy 1.0, the carbohydrate fractionation scheme assumed two fractions of non-fibre carbohydrate (NFC): the A fraction that contains organic acids and sugars, and the B1 fraction that contains soluble fibres and starch (Sniffen et al. Reference Sniffen, O'Connor, Van Soest, Fox and Russell1992) as listed in Table 1.
Composition and digestion of carbohydrate fractions in the CNCPS and CPM Dairy models

a Intestinal digestibility of the rumen escape fraction.
b Contains plant organic acids and may contain fructans depending on the method used to measure sugars.
During silage fermentation, some of the soluble non-cell wall components are metabolized primarily to lactic and acetic acids (McDonald et al. Reference McDonald, Henderson and Heron1991). These silage acids are useful to the animal as a component of ME but are depleted fermentable sources of ATP for microbial growth under normal rumen conditions (Van Soest Reference Van Soest1994). Thus, ensiling has little effect on feed energy values but can affect supply of protein to the host animal substantially by decreasing bacterial protein production. Therefore, a separation between sugars and organic or silage acids was needed. In the CPM Dairy 3.0, The CHO A fraction has been separated into silage acids (CA1) and sugars (CA2) as shown in Eqns (1)–(4).


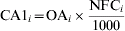
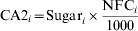
where CHO is g carbohydrate/kg of DM; CP is g crude protein/kg of DM, EE is g ether extract/kg of DM; Ash is g/kg of DM; NFC is g non-fibre carbohydrate/kg of DM, NDF is g neutral detergent fibre/kg of DM; NDICP is g neutral detergent insoluble CP/kg of CP; CA1 is g carbohydrate fraction A1/kg of DM; OA is g organic acids from silage/kg of NFC; CA2 is g carbohydrate fraction A2/kg of DM; Sugar is g simple sugars/kg of NFC; and i is the ith feed.
In the CNCPS 5.0 and CPM Dairy 1.0, the CB1 fraction contained starch, pectin and β-glucans. Grouping these carbohydrates together is not nutritionally correct because they may have different rates of fermentation in the rumen (Engstrom et al. Reference Engstrom, Mathison and Goonewardene1992; Hatfield & Weimer Reference Hatfield and Weimer1995; Hall et al. Reference Hall, Pell and Chase1998), they are not precisely defined or analysed (Van Soest Reference Van Soest1994; Pitt et al. Reference Pitt, Van Kessel, Fox, Pell, Barry and Van Soest1996; Alderman et al. Reference Alderman2001; Offner & Sauvant Reference Offner and Sauvant2004), and it does not account for all the variability observed in NFC digestibility when various processing treatments are applied (Offner & Sauvant Reference Offner and Sauvant2004). Lanzas et al. (Reference Lanzas, Sniffen, Seo, Tedeschi and Fox2007) provided more discussion of fractionation of carbohydrates. As shown in Table 1, some organic acids and fructans might be pooled in CB2 depending on the method used.
In the CPM Dairy 3.0, starch (CB1; Eqn (5)) has been separated from pectin and β-glucans (CB2; Eqn (6)). The composition of fraction CC (Eqn (7)) was not changed. The fraction CC consists of lignin and fibre associated with lignin, representing the material that is not fermented after 200 h (Van Soest et al. Reference Van Soest, Van Amburgh, Robertson and Knaus2005). Carbohydrate fraction C is calculated as lignin×2·4 (Van Soest et al. Reference Van Soest, Van Amburgh, Robertson and Knaus2005). Remaining carbohydrate fraction is the insoluble available fibre (fraction CB3 (Eqn (8)) in the CPM Dairy 3.0), which was fraction CB2 in the CNCPS 5.0 and CPM Dairy 1.0. Several techniques for determining NDF have been developed and used (Hintz et al. Reference Hintz, Mertens and Albrecht1996; Mertens Reference Mertens2002). If sodium sulphite is used in the determination of NDF, a variable amount of NDICP will be removed from the neutral detergent residue, depending on the feed. Therefore with this NDF analysis, the CB3 may be under-estimated when the correction for NDICP is applied. The B fraction carbohydrates are determined as shown in Eqns (5)–(8) below.
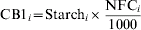



where CB1 is g carbohydrate fraction B1/kg of DM; Starch is g starch complexes/kg of NFC; NFC is g non-fibre carbohydrate/kg of DM; CB2 is g carbohydrate fraction B2/kg of DM; CA1 is g carbohydrate fraction A1/kg of DM; CA2 is g carbohydrate fraction A2/kg of DM; CC is g carbohydrate fraction C/kg of DM; NDF is g neutral detergent fibre/kg of DM; NDICP is g neutral detergent insoluble CP/kg of CP; Lignin is g sulphuric acid or acid detergent lignin/kg of NDF; and i is the ith feed.
Lipid sub-model
Fatty acids and glycerol are lipid compounds of nutritional significance. Crude fat is normally determined by extraction using ether; however, not all ether soluble materials are fatty acids (Van Soest Reference Van Soest1994). As a consequence, the CPM Dairy 3.0 contains a lipid sub-model developed by Moate et al. (Reference Moate, Chalupa, Jenkins and Boston2004) that describes the ruminal digestion and metabolism of long-chain fatty acids (LCFA).
The lipid sub-model was developed to account for (1) intake of fatty acids, (2) ruminal lipolysis of dietary lipids, (3) ruminal biohydrogenation of fatty acids, (4) de novo synthesis of fatty acids in the rumen, (5) effects of fat on rumen digestion and fermentation and (6) intestinal digestion of fatty acids (Moate et al. Reference Moate, Chalupa, Jenkins and Boston2004). The following LCFA were included in this sub-model: n-dodecanoic acid (lauric acid, C12:0), n-tetradecanoic acid (myristic acid, C14:0), n-hexadecanoic acid (palmitic acid, C16:0), hexadecenoic acid (palmitoleic acid, C16:1), n-octadecanoic acid (stearic acid, C18:0), octadecenoic acid (oleic acid, C18:1c, C18:1t); octadecadienoic acid (linoleic acid, C18:2) and octadecatrienoic acid (linolenic acid, C18:3) (Nelson & Cox Reference Nelson and Cox2005).
The lipid sub-model was developed almost entirely with data from published experiments involving lactating dairy cows in which daily dietary intakes, duodenal flows and faecal outputs of individual LCFA were reported (Moate et al. Reference Moate, Chalupa, Jenkins and Boston2004). The initial evaluation included seven experiments utilizing non-lactating cattle (mostly young growing steers) and one experiment utilizing lactating dairy cows. The lipid sub-model explained more than 86% of the variation between predicted and measured absorbed C12:0, C14:0, C16:0, C18:0, C18:1t, C18:1c and C18:2. The predicted mean bias was 12% or less for C12:0, C14:0, C16:0, C18:0 and C18:2. For C18:1t and C18:1c, the correlation was good (r>0·96) but the mean bias was about 20%. This may be a consequence of the small number of comparisons as C18:1t and C18:1c data were only reported for eight diets in two experiments. The absorption of C16:1, C18:3 and other LCFA was poorly predicted by the sub-model. However, only small amounts (2–3 g/d) of C16:1 and C18:3 were absorbed and other LCFA includes LCFA were not always reported in all experiments.
In a more recent evaluation, Moate et al. (Reference Moate, Boston, Lean and Chalupa2006) examined the ability of the lipid sub-model to predict the apparent absorption (intake minus faecal) of total LCFA in lactating dairy cows. There were two types of experiments: abomasal infusion experiments and feeding experiments. The amounts of total LCFA apparently absorbed were regressed against the reported amounts of total LCFA apparently absorbed. For the diets from the infusion experiments, the CCC (r c; Lin Reference Lin1989) was 0·923 and Pearson correlation coefficient (r) was 0·940. For the diets from the feeding experiments, these values were r c=0·975 and r=0·977. These evaluations indicated that because the lipid sub-model accurately predicted the apparent absorption of total LCFA infused into the abomasum of dairy cows, appropriate intestinal absorption coefficients were used in the lipid sub-model. Furthermore, the model also accurately predicted the apparent absorption of total LCFA in the feeding experiments, suggesting the model may be correctly describing ruminal processes such as lipolysis, biohydrogenation and the de novo synthesis of LCFA that can influence apparent absorption of total LCFA.
Feed dictionary
The main goal of a feed dictionary or feed library is to provide values for feed chemical analyses needed by the model that are not available for the feeds to be used for the development of rations. The feed dictionary in the CPM Dairy 3.0 represents an evolution from the first dictionary published by Fox et al. (Reference Fox, Sniffen, O'connor, Russell and Van Soest1990) and Sniffen et al. (Reference Sniffen, O'Connor, Van Soest, Fox and Russell1992). More than 10 000 feed analyses were utilized in the development of the feed library for the CPM Dairy 3.0. Degradation rates of available NDF (CB3) were estimated from 30 h in vitro NDF digestion (Van Soest et al. Reference Van Soest, Van Amburgh and Tedeschi2000). For instance, the newly generated degradation rates of CB3 for corn silage were lower and those for alfalfa were higher than the feed dictionary values in the CPM Dairy 1.0.
Despite the effort made to provide correct values in the feed dictionary, actual chemical compositions of the feed carbohydrate and protein fractions used in CPM Dairy 3.0 should be measured in order to determine accurately intake of nutrients and prediction of animal performance. The values reported in a feed dictionary do not represent the mean of the chemical components of randomly selected feed samples because it assumes the chemical components are independent (Tedeschi et al. Reference Tedeschi, Fox, Pell, Lanna and Boin2002). In fact, the chemical components are highly correlated (Tylutki Reference Tylutki2002).
Some feed ingredients (e.g. ground maize) have a low variance in analysis and may not require frequent analysis. Others (e.g. forages, distillers' grains) are quite variable in composition and require frequent analysis. For some components (e.g. lignin, soluble protein, non-protein nitrogen (NPN), amino acids) there is less variance if expressed as a percentage of another component (e.g. NDF, CP, soluble protein, ruminally-undegraded protein (RUP)) than if expressed as a proportion of dry matter (DM). Additionally, some feed components such as lignin, NPN and amino acids may not be analysed and use of the feed dictionary values are facilitated when they are expressed on the basis of a fraction usually analysed or calculated.
Optimization and ration formulation
Ration formulation involves the selection of feed ingredients within a specified DMI so that nutrient supplies meet nutrient requirements at the lowest cost. Nutritional constraints are based upon application of the factorial approach to describe the requirements of cows to perform specific or multiple functions (maintenance, growth, lactation and pregnancy). Linear programming is commonly used for auto-balancing in most nutrition models (Tedeschi et al. Reference Tedeschi, Fox, Chase and Wang2000). In fact, ration formulation was one of the first applications of linear programming. Not only could solutions be found in seconds, but building on contributions of Dantzig (Reference Dantzig and Koopmans1951) to operational research, an array of other very helpful economic properties (shadow prices) relating to the optimal solution could be derived. Nonetheless, the suitability of linear programming for optimization depends on the linearity of the problem. The CPM Dairy 3.0 utilizes a non-linear optimization called the ‘Feasible Sequential Quadratic Programming’ approach (Zhou et al. Reference Zhou, Tits and Lawrence1997). Feed cost is a logical objective for ration formulation; however, other objectives may be desirable for diet formulation in the near future. These include minimization of nutrient excretion by animals and production of specific components of milk that are nutritionally valuable.
Evaluation of the CPM Dairy 3.0
The proper evaluation of a mathematical model employs a combination of statistical and empirical analyses and proper scrutiny regarding the purposes of the model that was initially conceptualized (Tedeschi Reference Tedeschi2006). Therefore, the adequacy of the CPM Dairy 3.0 was assessed based on its ability to predict milk production of high-producing dairy cows when animal and feed inputs required by the model are available. The concepts of precision and accuracy as described by Haefner (Reference Haefner1996) and Tedeschi (Reference Tedeschi2006) were utilized to determine model adequacy: precision measures how closely individual model-predicted points are within each other whereas accuracy measures how closely model-predicted points are from the true value (Haefner Reference Haefner1996; Tedeschi Reference Tedeschi2006). The precision and accuracy of the predictions were assessed using several statistical and modelling techniques as described by Tedeschi (Reference Tedeschi2006) to guarantee a thorough evaluation of CPM Dairy 3.0 for practical applications. The main techniques used to evaluate the predictions of the model were linear regression analysis between observed and model-predicted values, CCC (Lin Reference Lin1989; Liao Reference Liao2003) and MSEP (Bibby & Toutenburg Reference Bibby and Toutenburg1977).
Database description
A database containing 228 individually-fed high-producing lactating dairy cows from five studies was utilized to assess the adequacy of the CPM Dairy 3.0 to predict first-limiting ME- or MP-allowable milk production. The database contained adequate information on feed composition and intake, animal description and performance, and environment information necessary to predict milk production with CPM Dairy. Study 1 had 36 primiparous and 40 multiparous Holstein cows fed wet corn gluten feed over 2 years (Kononoff et al. Reference Kononoff, Ivan, Matzke, Grant, Stock and Klopfenstein2006) at the University of Nebraska-Lincoln Dairy Research Unit. Only the post-peak milk production data were utilized in the evaluation. Study 2 consisted of 23 multiparous and 16 primiparous Holstein cows averaging 263 days in milk and 614 kg BW. These cows received three levels of CP (low, medium and high) in a total mixed ration (TMR) for 4 weeks (Ruiz et al. Reference Ruiz, Tedeschi, Marini, Fox, Pell, Jarvis and Russell2002). Study 3 was comprised of 60 multiparous and 21 primiparous Holstein cows (Stone Reference Stone1996). Cows from Study 3 were fed three treatments to evaluate soy hulls as forage or concentrate replacement over a 14 week period. Study 4 consisted of 15 multiparous Holstein cows averaging 126 days in milk and 560 kg BW that were fed fresh-cut orchardgrass (Dactylus glomerata L.) and a concentrate mix with or without Rumensin™ for 3 weeks (Ruiz et al. Reference Ruiz, Albrecht, Tedeschi, Jarvis, Russell and Fox2001). Studies 2, 3 and 4 were conducted at the Cornell University Teaching and Research Centre. Study 5 was conducted at the experimental station of the Brazilian Agricultural Research Corporation (EMBRAPA) at Coronel Pacheco, MG (Brazil) with 14 lactating Holstein cows in a free-stall confinement (Fernando C. F. Lopes, unpublished). Maize silage was offered ad libitum while the concentrate mixture was fed based on the milk production level (4·08–8·16 kg of DM/d). Maize silage and concentrate mixture DMI was measured daily for 5 consecutive days using individual, electronic feeders (Calan gate system). Cows were mechanically milked twice per day (06·00 and 14·00 h) and milk production and milk composition (fat, protein and solids) were determined daily. Dietary ingredients were individually analysed for nutrients necessary to estimate ME and MP using CPM Dairy 3.0. The observed DMI was used to predict ME and MP allowable milk because the use of predicted DMI would cause two uncertainties in predicting milk production: prediction of intake and subsequent milk production.
The LCFA and degradation rates of the feeds used to perform these simulations were set to match comparable feeds listed in the CPM Dairy 3.0 feed dictionary; all other feed compositions were measured as indicated.
Statistical methods
A random coefficients model (Littell et al. Reference Littell, Milliken, Stroup, Wolfinger and Schabenberger2006) was used to combine model predictions of the five studies using PROC MIXED of SAS (Littell et al. Reference Littell, Milliken, Stroup, Wolfinger and Schabenberger2006). Observed milk production was regressed on model-predicted milk production, assuming study as random effects and unstructured variance–(co)variance matrix, as shown in Eqn (9). Adjusted observed milk production was computed as the sum of fixed effects and uncontrolled-random error. Similar analysis was performed for observed and model-predicted DMI for all five studies included in the evaluation data set.

where:
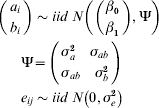
The variance component analysis of fixed effects (model predictions, R 2FixedEffects) and study effects (R 2RandomEffects) in explaining the observed milk production was assessed based on coefficients of partial determination (Eqn (10)). The coefficients of partial determination were estimated by regressing observed milk production on fixed effects, study effects and uncontrolled-random error (Neter et al. Reference Neter, Kutner, Nachtsheim and Wasserman1996) using PROC REG of SAS (SAS Inst., Cary, NC) with options PCORR1 (for sequential sum of squares) and PCORR2 (for partial sum of squares).
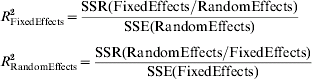
where SSR(FixedEffects/RandomEffects) is partial sum of squares of regression of fixed effects when random effects was in the model, SSE(RandomEffects) is sum of squares of error when random effects was the only independent variable in the statistical model, SSR(RandomEffects/FixedEffects) is partial sum of squares of regression of random effects when fixed effects was in the model and SSE(FixedEffects) is sum of squares of error when fixed effects was the only independent variable in the statistical model.
RESULTS AND DISCUSSION
Assessing the adequacy of model prediction of intake
The analysis of the random coefficients model between observed and model-predicted DMI indicated no significant variance for the intercept (P=0·138) and for the slope (P=0·202), suggesting no interaction between intercept or slope with study. When the random study effects were removed from the observed DMI and regressed against model-predicted DMI (St-Pierre Reference St-Pierre2001), an R 2 of 0·63, root of mean square error (MSE) of 2·62 kg/d, mean bias of 2·14 kg/d (P<0·001), root of MSEP of 3·4 kg/d (0·15 of the observed mean) and model accuracy (as measured by the Cb statistic) of 0·82 were observed.
Even though the regression of observed on model-predicted DMI were parallel (no interaction in the slope×study, P=0·202), individual regressions by study indicated that CPM Dairy predictions of DMI were not uniform. The coefficient of determination varied from 0·34 (study 1) to 0·81 (study 5) and the root of MSE ranged from 1·06 to 3·47 kg/d. Intake is controlled by a complex and multifactorial system (Forbes Reference Forbes2003) that is not fully understood. There are short- (Allen Reference Allen2000) and long-term (Bauman Reference Bauman and Cronjé2000) effects that control the intake of dairy cows. The prediction of DMI by the CPM Dairy 3.0 is based on the equations developed by Roseler et al. (Reference Roseler, Fox, Chase, Pell and Stone1997) and Fox et al. (Reference Fox, Tedeschi, Tylutki, Russell, Van Amburgh, Chase, Pell and Overton2004). These equations are empirical and static by nature with adjustments for BW, week of lactation, days pregnant and milk protein yield (kg/d), as described by Fox et al. (Reference Fox, Tedeschi, Tylutki, Russell, Van Amburgh, Chase, Pell and Overton2004).
It is almost impossible to construct equations that will accurately predict DMI under all management, feeding and environmental conditions. The DMI predictions by the CPM Dairy model are intended as guidelines. Rations should be formulated on the basis of actual DMI. However, even when there are accurate records of feed delivered and unconsumed feed, actual DMI will often be over-estimated under field conditions. This is likely to occur because of the inability to account for feed wastes such as feed thrown out of bunks, losses across feed alleys and feed wasted into the animal area.
The evaluation indicated an unacceptable variation in predicting intake of lactating dairy cows under field conditions. It is possible that mechanistic and dynamic models might include short- and long-term factors (Illius & Jessop Reference Illius and Jessop1996; Allen et al. Reference Allen, Bradford and Harvatine2005) affecting DMI in ruminants and may improve its DMI predictability.
Assessing the adequacy of model prediction of milk production
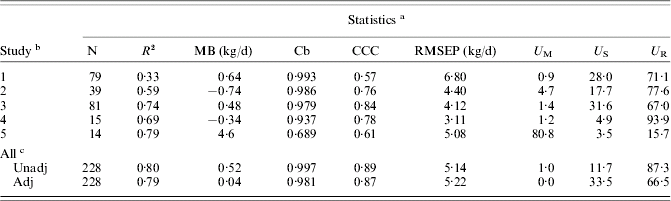
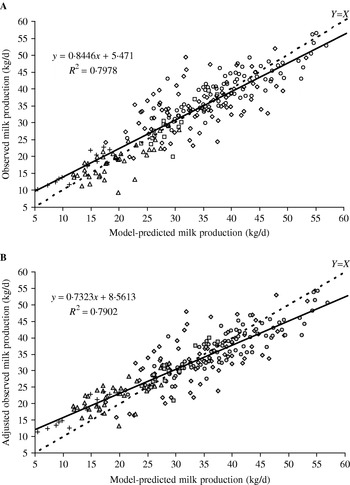
Across all studies, an overall regression between observed and model-predicted milk yield indicated the CPM Dairy 3.0 was able to account for 79·8% of the variation in observed milk yield with a mean bias of 0·52 kg/d of milk (P>0·124) when observed DMI was inputted in the model. The mean bias was approximately 1·6% of model-predicted milk yield; CCC of 0·89 (Cb of 0·997), and root of mean square error of prediction (RMSEP) 5·14 kg/d (15·9% of the observed mean) in which 0·87 of the MSEP was due to random errors, 0·12 was due to systematic bias and only 0·01 was due to mean bias (Table 2). This analysis suggests that further improvements in the model may be possible by accounting for more of the variation and the level of milk production may slightly affect the model prediction. The mean and standard error of observed and model-predicted milk production were 32·3±0·71 and 31·8±0·75 kg/d. The intercept (5·47) and slope (0·84) of the regression were simultaneously different from zero and unity (P<0·001), respectively. These results were similar to those reported by Fox et al. (Reference Fox, Tedeschi, Tylutki, Russell, Van Amburgh, Chase, Pell and Overton2004) when evaluating the CNCPS model.
Summary of model adequacy statistics between observed and model-predicted milk production values
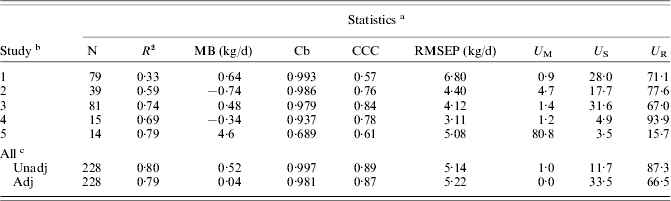
a MB=mean bias (kg/d); Cb=Lin's (1989) accuracy; CCC=Lin's (1989) concordance correlation coefficient; RMSEP=root of mean square error of prediction (kg/d); and U M, U S and U R are percent decompositions of MSEP due to mean bias, systematic bias and random errors (Tedeschi Reference Tedeschi2006).
b 1=Kononoff et al. (Reference Kononoff, Ivan, Matzke, Grant, Stock and Klopfenstein2006), 2=Ruiz et al. (Reference Ruiz, Tedeschi, Marini, Fox, Pell, Jarvis and Russell2002), 3=Stone (Reference Stone1996), 4=Ruiz et al. (Reference Ruiz, Albrecht, Tedeschi, Jarvis, Russell and Fox2001) and 5=EMBRAPA (Fernando C. F. Lopes, unpublished).
c Observed milk production values are unadjusted (Unadj) or adjusted (Adj) for random effects of studies.
The milk production data used in the present evaluation were derived from lactating cows raised under diverse production and management situations, but it represents the post-peak milk production, not the entire lactation period. Macciotta et al. (Reference Macciotta, Vicario, Di Mauro and Cappio-Borlino2004) have indicated an independency (weak correlation) between the increasing rate of milk yield in the first part of the lactation and the declining rate of milk yield after the lactation peak, suggesting that a change in milk yield could be the result of changing either rate. Therefore, a high milk yield prior to the peak of milk production may not guarantee a high milk yield during the post-peak period. Because the post-peak milk production represents the majority of the milk produced during the lactation of a cow and the variation due to metabolic and physiological changes associated with transition phase (Hayirli et al. Reference Hayirli, Grummer, Nordheim and Crumps2003; Overton & Waldron Reference Overton and Waldron2004) and the independency between the first and second phases of the lactation curve, only post-peak milk production was used in the current evaluation.
Despite the relatively high precision (R 2) of the overall regression, amongst studies, the precision varied from 0·33 to 0·79 (Table 2) even though the mean bias was relatively low and accuracy was high. The discrepancy in low precision and high RMSEP suggest models based on the CNCPS framework have a good ability to accurately predict the mean when large sample sizes are used, but individual animal predictions may not be satisfactory. The decomposition of the MSEP indicated the source of error was not consistent amongst studies (Table 2). Chaves et al. (Reference Chaves, Brookes, Waghorn, Woodward and Burke2006) reported a low precision with no mean bias of CNCPS-based models in predicting milk production.
The CPM Dairy 3.0 predicted that 0·76 (n=173 cows) of the milk production was limited by protein (MP allowable milk) and 0·24 (n=55 cows) was limited by energy (ME allowable milk). Changes in BCS might have affected the prediction of the first-limiting ME or MP allowable milk as shown by Tedeschi et al. (Reference Tedeschi, Seo, Fox and Ruiz2006). The extent of this BCS change depends upon energy reserves at calving. This is because under-conditioned cows consume more feed and mobilize less body reserves than over-conditioned cows (Overton & Waldron Reference Overton and Waldron2004), which will consume less feed. The magnitude of the energy/protein loss or gain may be indicated and monitored in terms of predicted BCS changes. When cows do not lose, or even gain, BCS during the early stages of the lactation cycle, this may reflect inadequate MP, especially if milk production does not achieve a high peak but is relatively a lower peak following parturition (Garnsworthy & Topps Reference Garnsworthy and Topps1982; Garnsworthy & Jones Reference Garnsworthy and Jones1987).
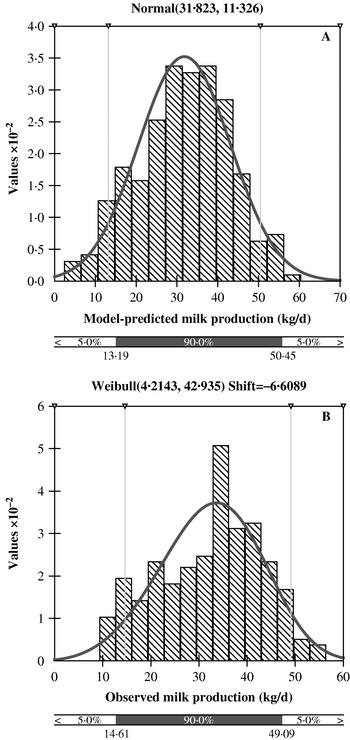
Figure 1 depicts the frequency and distributions of observed and model-predicted milk production. The data had slightly different distributions as assessed by the χ2 (Figs 1 A and 1 B). Based on the Kolmogorov–Smirnov ranking analysis (Kolmogoroff Reference Kolmogoroff1933), the observed milk production had a Weibull distribution whereas the model-predicted had a normal distribution. This is an evaluation of the goodness-of-fit of the model in which we tested whether observed and model-predicted milk productions had the same population distribution. The distributions were similar but more points might be needed to obtain a normal distribution for the observed dataset and secure an adequate level for the Type II error – the error of accepting model adequacy when, in fact, models differ (Tedeschi Reference Tedeschi2006).
Histogram and normal distribution of (A) observed and (B) CPM Dairy-predicted milk production using the data of five independent studies. The 90% confidence interval is shown by the vertical lines and the curve shows the bell shape of a normal distribution. Analyses were done with @Risk 4.5.7 (Palisade, Newfield, NY).

The null model likelihood ratio test indicated a significant improvement over the model consisting of no random effects and a homogeneous residual error (P<0·001). In fact, the random coefficients model analysis indicated that study 1 had an intercept (P=0·029) and slope (P=0·041) different from all other studies. Even though intercepts and slopes of the random effects were negatively correlated (−0·62), they were not different from zero (P=0·403). Similarly, the variances of intercepts (29·48) and slopes (0·016) of the random effects were not different from zero (P=0·150 and 0·214, respectively). Nonetheless, this indicates that adjustment for study effects was needed.
The decomposition of the total sum of squares (SS=26 032·4) into fixed effects (SSFxd), random effects of studies (SSRnd), and uncontrolled-random errors (SSE), reduced the SSE from 5264·2 (SSFxd+SSE) to 4135·8 (SSFxd+SSRnd+SSE), indicating that SSRnd was responsible for 0·21 of the SSE. Indeed, the partial coefficient of determination (Neter et al. Reference Neter, Kutner, Nachtsheim and Wasserman1996) confirmed that random effects of studies was 0·21 and fixed effects was 0·72. Therefore, the majority of the SS of the regression between observed and model-predicted milk production was accounted for by the CPM Dairy 3.0 model.
These analyses suggested that when fixed effects (CPM Dairy predictions) and random effects of studies were combined into the same statistical model, 0·84 [(26 032·4–4135·8)/26 032·4] of the variation was explained. Therefore, based on these analyses, an adjusted observed milk production was calculated removing the random effects of studies (St-Pierre Reference St-Pierre2001). The adjusted observed milk production was comprised of the fixed effects (CPM Dairy predictions) plus the uncontrolled-random error (residue) of the random coefficients model.
Table 2 lists the statistics of the model accuracy using the adjusted observed milk production. As expected, the coefficient of determination (R 2 of 0·79), accuracy (Cb of 0·98), CCC (0·87) and RMSEP (5·22 kg/d) remained relatively unaltered; but mean bias was significantly reduced from 0·52 to 0·04 kg/d. This analysis indicated that removing the random effects of studies further demonstrated the ability of the CPM Dairy model to predict the average milk production of lactating Holstein cows without changing precision and accuracy. The decomposition of the MSEP indicated an increase in the proportion of systematic bias compared to the unadjusted data, likely due to the broad aspect of our database that contained climate effects (tropical v. temperate regions), production level (high- v. low-producing cows), first limiting component (energy- v. protein-deficient rations) and different ration ingredients and genetics.
Figure 2 depicts the relationship of unadjusted and adjusted observed milk production v. model-predicted milk production of the 228 lactating dairy cows. The simultaneous F-test indicated the intercept and slope of both the observed milk production (5·47 and 0·84, respectively) and for observed milk production adjusted for study effects (8·56 and 0·73, respectively) were different from zero and one (P<0·001), respectively. This analysis supports those statistics listed in Table 2.
Relationship of (A) unadjusted and (B) adjusted observed milk production for study effects to model-predicted milk production with data from five independent studies (◊=Kononoff et al. (Reference Kononoff, Ivan, Matzke, Grant, Stock and Klopfenstein2006) ; △=Ruiz et al. (Reference Ruiz, Tedeschi, Marini, Fox, Pell, Jarvis and Russell2002) ; ○=Stone (Reference Stone1996) ; □=Ruiz et al. (Reference Ruiz, Albrecht, Tedeschi, Jarvis, Russell and Fox2001) ; and +=EMBRAPA (Fernando C. F. Lopes, unpublished) using the CPM Dairy v. 3.0 model. The solid line is the regression between Y and X and the dashed line is the Y=X line).

IMPLICATIONS
Based on the model evaluations performed in the current study, it was concluded that the CPM Dairy model accurately predicts nutrient requirements and diet ME and MP supply in lactating dairy cattle at the farm level when feed intake and content of carbohydrate and protein fractions can be adequately measured or estimated. These predictions allow for accurate formulation of diets to meet energy and protein requirements of lactating dairy cows, which minimizes cost and nitrogen excretion per amount of milk produced. Further improvements in the CNCPS-based models should include accounting for more of individual variability of animals and improvements in the prediction of feed intake for use when it is not known.