Adolescence is a period of gradual transition from childhood to adulthood, characterised by significant psychological, social and physiological changes. It is the phase of assuming responsibility for one’s own health-related behaviours, including eating habits. Also, dietary habits acquired during this phase have implications for adult life(Reference Delisle1).
In the last decade, a decrease in the consumption of foods considered healthy, such as fruits and vegetables, was observed in Brazil in all age groups. Among adolescents, there was an increase in the intake of high-energy-dense foods, rich in sugars and fats, such as fast food and sugar-sweetened beverages. These characteristics are associated with the increase in non-communicable chronic diseases across all age groups(Reference Monge, Canella and López-Olmedo2), including adolescents(Reference Lane, Davis and Beattie3).
Dietary inadequacies are associated with higher prevalences of inappropriate weight status, such as malnutrition and overweight. Brazilian school adolescents have a nutritional status characterised by a high prevalence of overweight (approximately one in four adolescents) and a low prevalence of underweight(Reference Lisbôa Conde, Medeiros da Silva Mazzeti and Cumpian Silva4).
Studies evaluating the food intake of adolescents, as well as anthropometric data, have been conducted in school representative sample of this Brazilian population. However, the dietary intake assessment in one of these surveys (PeNSE – National Adolescent School-based Health Survey) is limited to the frequency of consumption of items marking healthy and unhealthy eating habits. Another study, ERICA (Study of Cardiovascular Risks in Adolescents), despite investigating individual consumption using a 24-h dietary recall, was conducted at a single point in time (2013)(5,Reference De Moura Souza, Barufaldi and De Azevedo Abreu6) .
The Household Budget Surveys (HBS), conducted by the Brazilian Institute of Geography and Statistics, have been a good source of information for estimating consumption based on household food availability data since the 1970s. In the HBS of 2008–2009 and 2017–2018, a module for food consumption, called the National Dietary Survey (NDS), was included. The NDS gathers food consumption data for individuals aged 10 and above from a subsample of selected households from the HBS, making it possible to estimate, for the first time, changes in food consumption in a representative sample of Brazilian adolescents(7,8) .
The objective of the present study is to assess changes in dietary intake and weight status among Brazilian adolescents using data from the NDS of 2008–2009 and 2017–2018.
Methods
Data from the NDS of 2008–2009 and 2017–2018 were analysed. Both surveys have national coverage and use a two-stage cluster sampling plan based on a ‘master sample’ of the Integrated Household Surveys System. The master sample consists of a set of census tracts, corresponding to primary sampling units, which are stratified according to geographical area, household situation (rural or urban) and household income based on the 2000 Census for the 2008–2009 HBS and the 2010 Census for the 2017–2018 HBS. In the second stage, households are selected in each tract by simple random sampling. The stratification scheme allows for estimates to be generated for the entire Brazilian population across different socio-economic strata, for urban and rural areas and for the five Brazilian regions. The sampling weights were calculated based on the inverse of the household selection probability, adjusted for non-response and calibrated through post-stratification. This calibration aimed to align the sample with population totals according to the 2000 Census (for the 2008–2009 HBS) and the 2010 Census (for the 2017–2018 HBS). Details about the sampling can be found in the Brazilian Institute of Geography and Statistics(7,8) .
To assess dietary consumption, a subsample from each HBS was selected. The total number of households in the NDS was 13 569 in 2008–2009 HBS and 20 112 in 2017–2018 HBS. Residents aged 10 and above participated, totalling 34 003 individuals in 2008–2009 and 46 164 in 2017–2018. The present study includes adolescent residents (aged 10–19 years) of both sexes who were not pregnant or breastfeeding at the time of the survey: 7425 adolescents in 2008–2009 and 8264 adolescents in 2017–2018.
Questionnaires with socio-economic and demographic data were answered by the household reference person, containing information about the age and sex of residents and per capita family income. Data collection for the surveys was conducted over 12 months, uniformly across strata, to account for potential variations in assessment due to seasonal food consumption in the four quarters of the year.
In 2008–2009, dietary consumption data were collected through two non-consecutive food records. Participants recorded all foods and beverages consumed during the day, including quantity, preparation method, time and place of consumption. The records were reviewed and stored in a computer programme developed for this purpose. This step was carried out by interviewers with participants in their households.
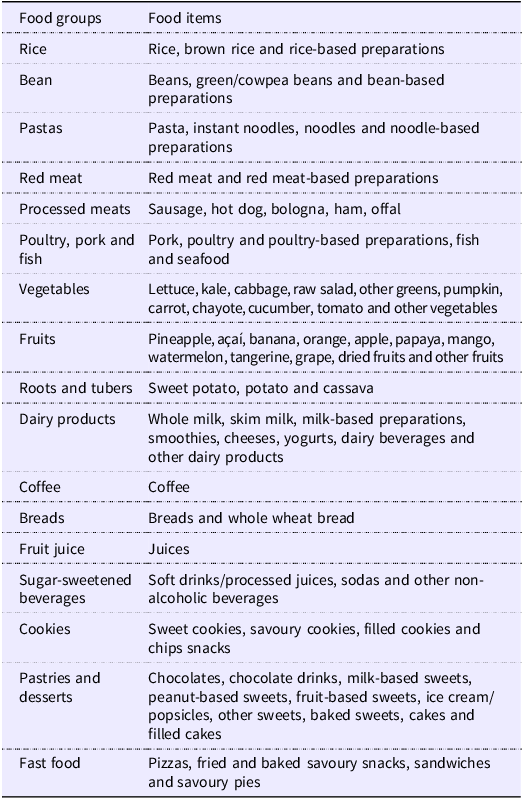
Food groups and items. National Dietary Surveys 2008–2009 and 2017–2018

In 2017–2018, data collection occurred through two 24-h dietary recalls completed on non-consecutive days. In addition to the information collected in 2008–2009, probing questions were asked about the addition of certain items: olive oil, butter, margarine, sugar, sweetener, honey, molasses, mayonnaise, ketchup, mustard, soy sauce, grated cheese and cream. The recalls were conducted in person with interviewers trained in the multiple-pass method. The data were collected using tablets and were also processed using a programme developed by the Brazilian Institute of Geography and Statistics.
In both surveys, trained interviewers reviewed the responses to identify possible errors and omissions in food reporting, especially easily forgotten items. When participants had difficulty reporting the unit of measurement used, they were asked to show the utensil used to the interviewer, who then entered the corresponding household measure into the system.
The food items reported in the surveys were grouped into seventeen groups, considering nutritional composition of the food: rice; beans; pasta; red meat; processed meats; poultry, pork and fish; vegetables; fruits; roots and tubers; dairy products; coffee; bread; fruit juices; sugar-sweetened beverages; cookies; pastries and desserts; and fast food (Box 1). The first day of consumption was considered to calculate the mean consumption in grams per food group per day. In both surveys, weekdays and weekends were represented.
The quantity in grams or millilitres of foods and beverages consumed, respectively, was estimated based on the Food Measurement Tables for Foods Consumed in Brazil, developed in 2008–2009 HBS and revised and updated in 2017–2018 HBS(7,8) .
In the 2008–2009 survey, participants were weighed and measured by interviewers. Weighing was performed using portable, battery-powered electronic scales with a minimum sensitivity of 100 g, a maximum capacity of 150 kg and automatic shut-off. Participants were instructed to wear light clothing, be barefoot and without heavy objects that could interfere with the total weight such as keys, belts, glasses and cell phones. Regarding height, participants were also instructed to remove shoes, as well as hats and hair ornaments that could interfere with measurement. Portable adult stadiometers from the KaWe brand were used, with a retractable internal tape measure, precision of 0·1 cm and extension of up to 200 cm. In the 2017–2018 survey, weight and height were self-reported.
Weight status was classified based on the BMI (BMI = weight/(height × height)). Weight status classification followed the criteria proposed by the WHO (WHO et al. 2007)(Reference Onis, Onyango and Borghi9), considering the BMI curves for age and sex from the Z score (Z score < –3: severe thinness; Z score ≥ –3 and Z score < –2: thinness; Z score ≥ –2 and Z score ≤ +1: normal weight; Z score: ≥ +1 and Z score < +2: overweight; Z score ≥ +2 and Z score ≤ +3: obesity; and Z score > +3: severe obesity).
All the estimates were performed separately for two age categories: 10–14 years old and 15–19 years old.
Changes in dietary consumption by sex and age category were evaluated in each survey. Differences in means were considered when the 95 % CI did not overlap. For the groups with statistically significant differences in the consumed mean amount, linear regression models evaluated changes adjusted for total energy intake.
The mean consumption of each food group was also estimated according to the level of per capita family income (≤ 0·5 minimum wage; between 0·5 and 1 minimum wage; between 1 and 2 minimum wages; and above 2 minimum wages). The minimum wage considered was R$ 465·00 ($ 202·17) for 2008–2009 HBS and R$ 954·00 ($ 298·13) for 2017–2018 HBS, considering the reference day of each survey.
Analyses were performed using SAS software, version 9.4, considering the survey design parameters.
Results
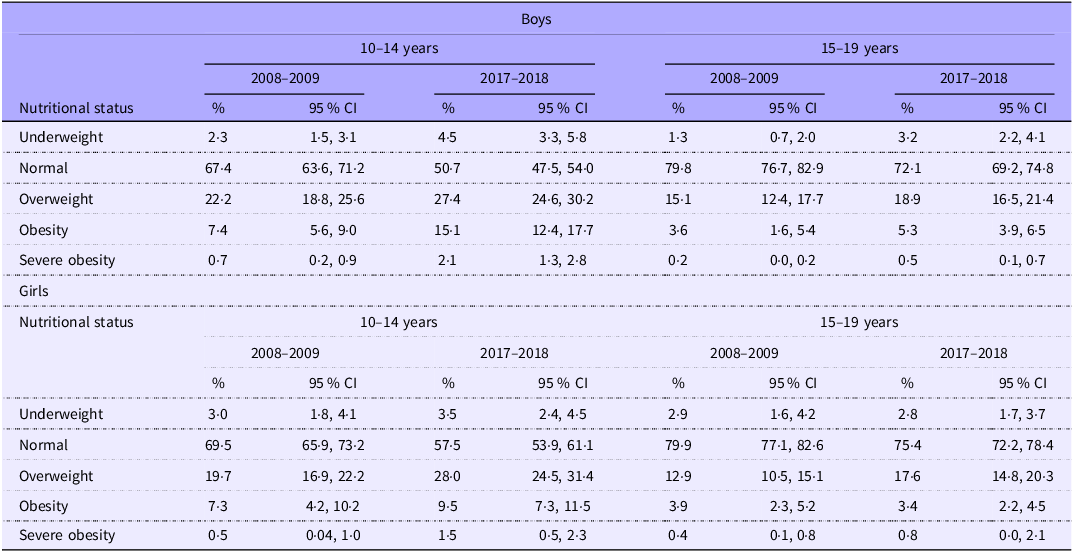
The prevalence of weight status differed between sexes. Among boys aged 10–14 years, significant increases were observed in the prevalence of underweight (from 2·3 to 4·5 %), obesity (7·4–15·1 %) and severe obesity (0·7–2·1 %), while normal weight decreased (67·4–50·7 %). Among boys aged 15–19, underweight also increased (1·3–3·2 %), and normal weight declined (79·8–72·1 %). Among girls aged 10–14, overweight rose significantly (19·7–28·0 %), and normal weight decreased (69·5–57·5 %). In the 15–19 age group, there were no statistically significant changes in nutritional status between the two survey periods (Table 1).
Nutritional status of Brazilian adolescents by sex: National Dietary Surveys 2008 –2018

Obesity: Z score ≥ +2 and Z score ≤ +3. Severe Obesity: Z score > +3.
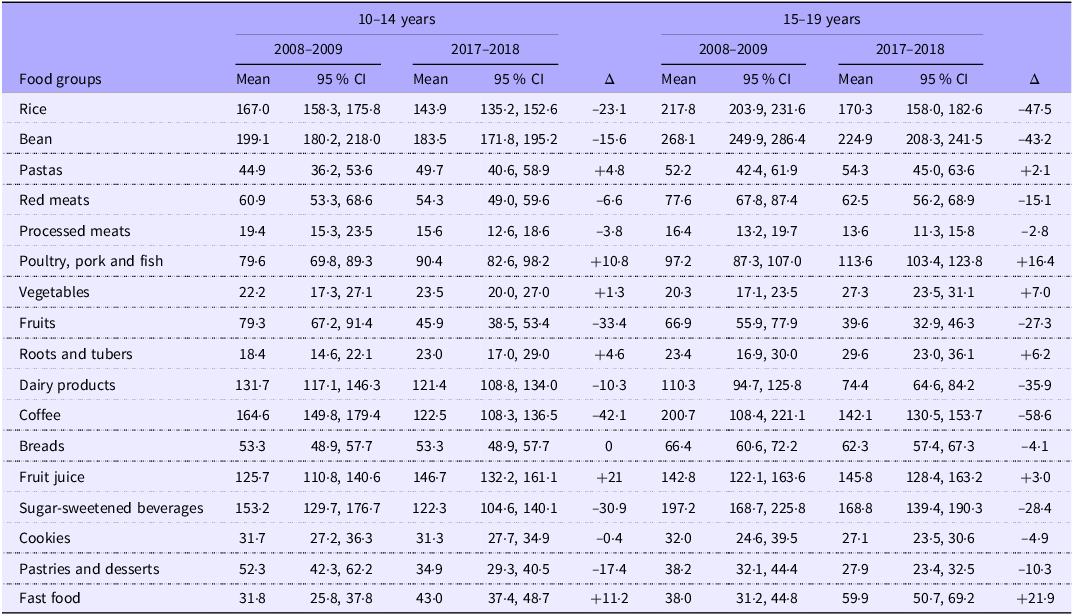
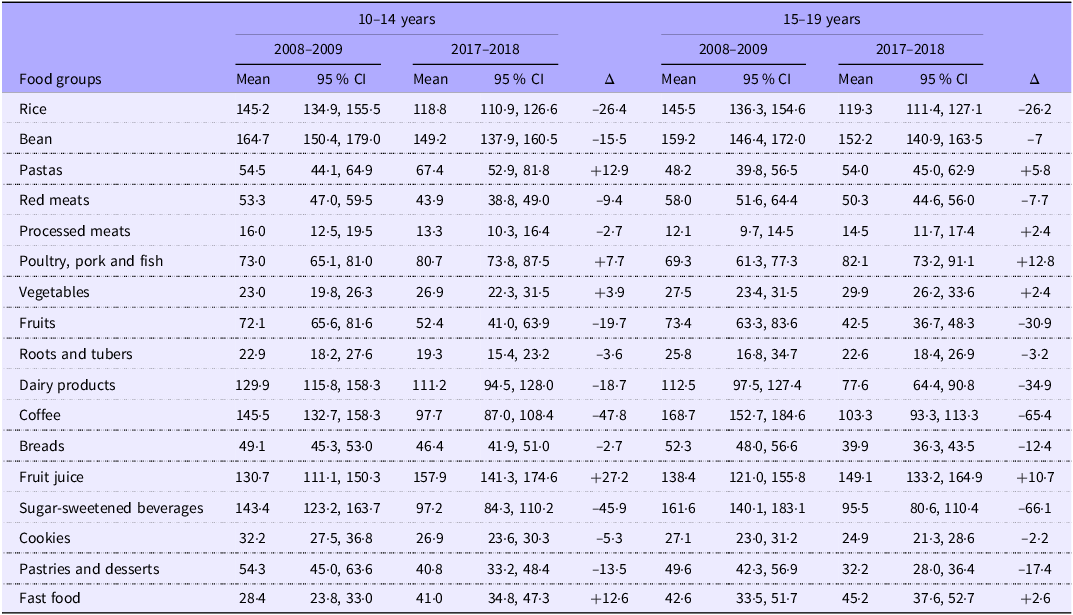
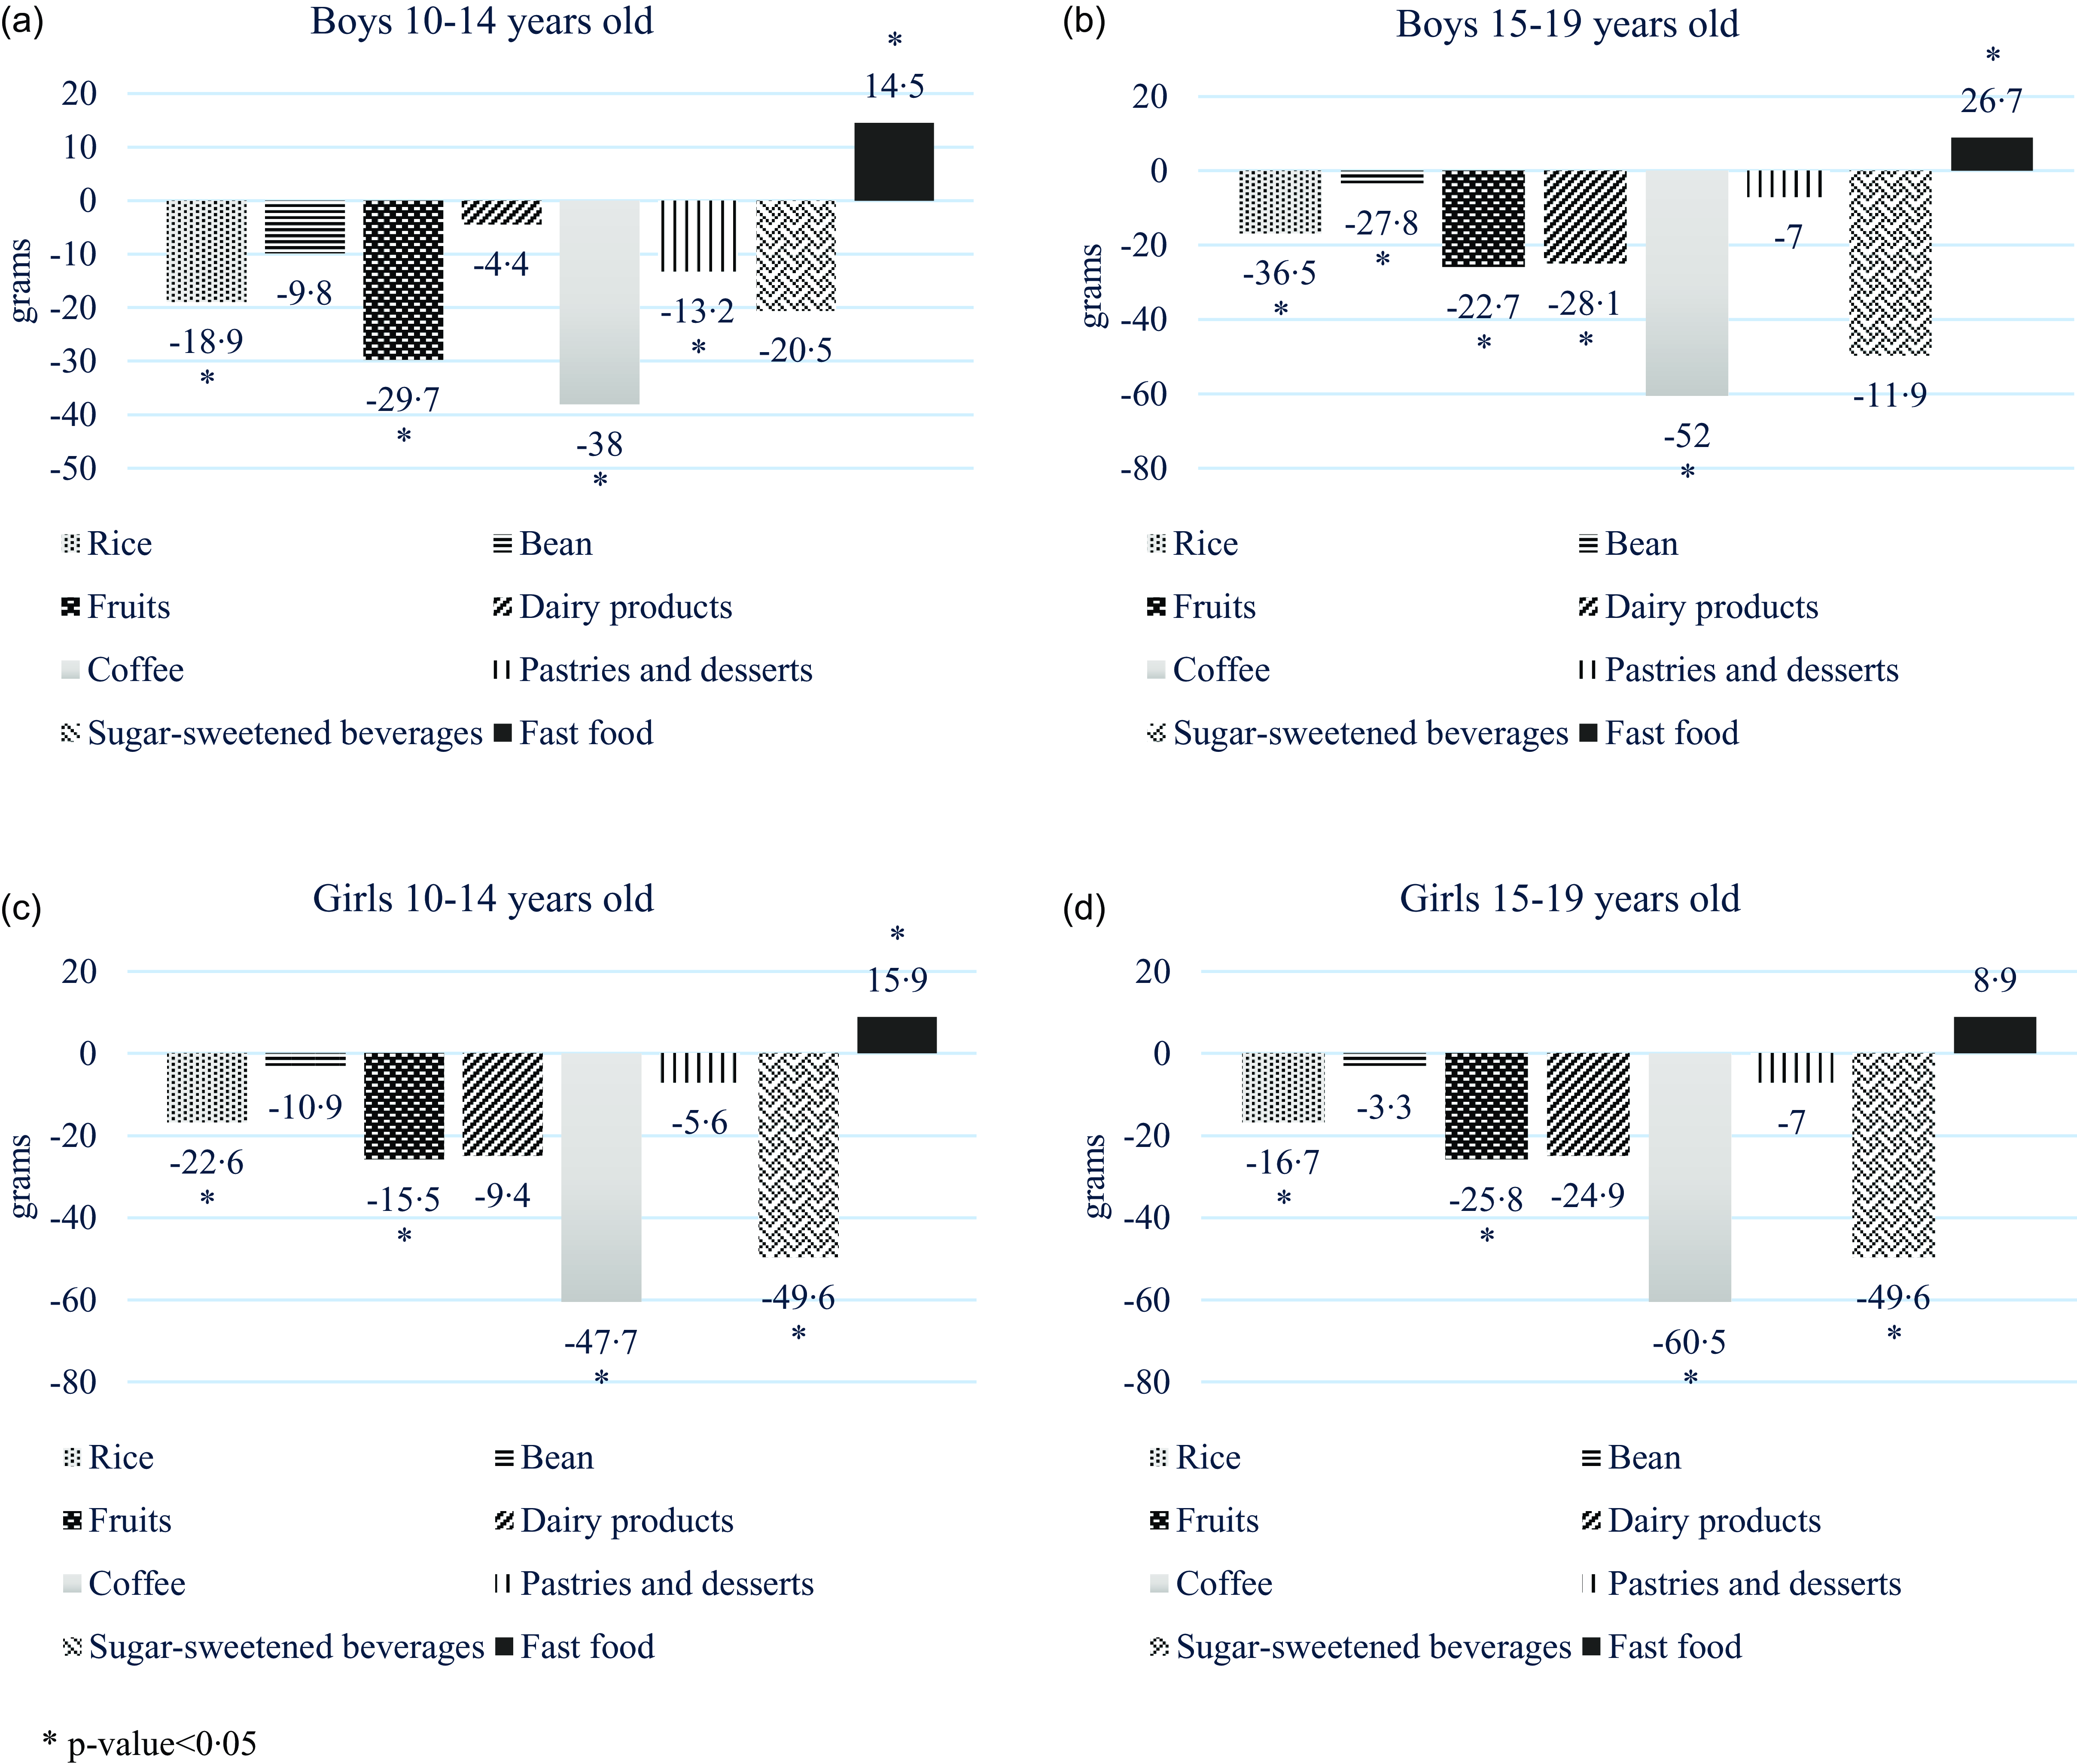
The average daily consumption between surveys changed differently according to food groups, age and sex. For both boys and girls, the mean consumption of rice decreased. Among younger boys (10–14 years old), a decrease in the consumed amount was observed for fruits, coffee and sweets and desserts. Among older boys (15–19 years old), the mean consumed amount was also observed for beans and dairy products, but with an increase in the amount of fast foods (Table 2), while in girls, the increase in the consumption of fast food was observed only among the youngers. Among older girls (15–19 years old), a decrease in the mean consumed amount was observed for fruits, dairy products, coffee, breads and pastries and desserts. For both age groups (10–14 and 15–19 years old), the consumption of sugar-sweetened beverages decreased among girls (Table 3). The results remained consistent even after adjusting for total energy intake (Fig. 1).
Mean daily consumption in grams and 95 % CI among boys, according to age group: National Dietary Surveys 2008–2018

Mean daily consumption in grams and 95 % CI among girls, according to age group: National Dietary Surveys 2008–2018

Main dietary changes for age-by-sex groups, National Dietary Surveys 2008–2018.

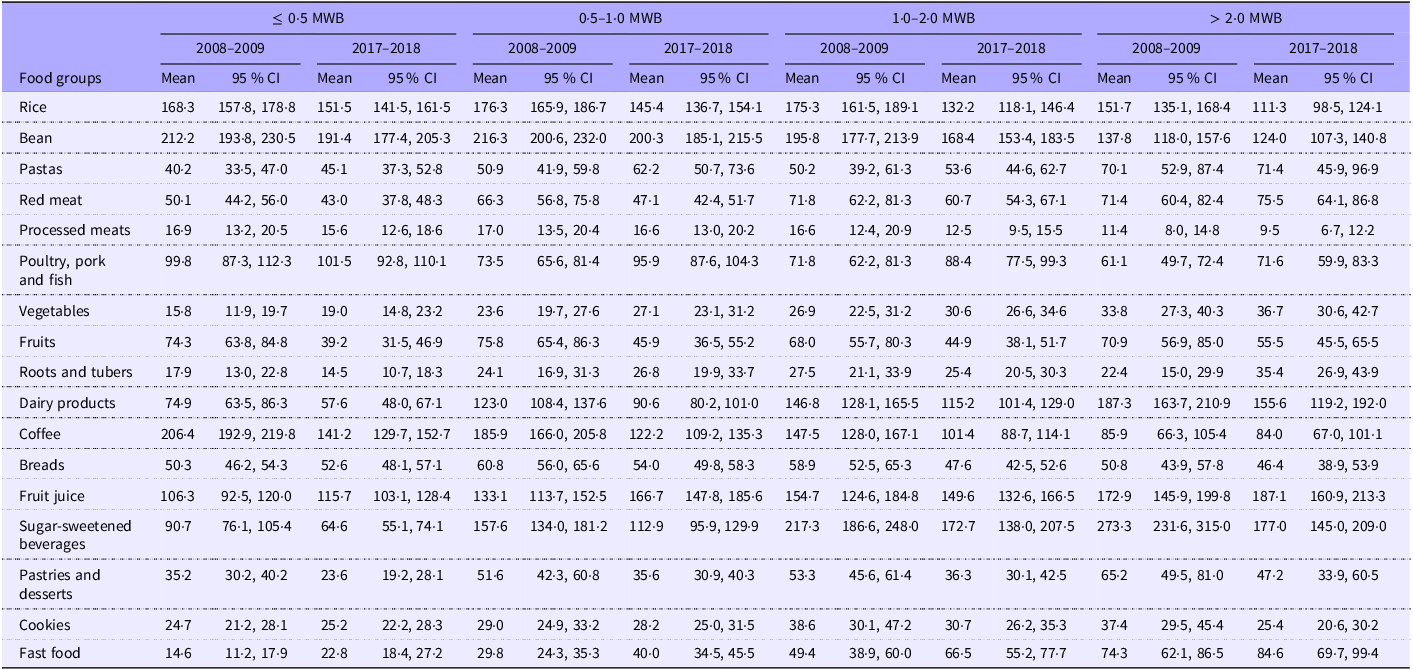
Comparing the mean daily consumption of food groups between survey editions within each income level, there was no statistically significant difference in the mean consumption of beans, pasta, processed meats, vegetables, roots and tubers, bread, fruit juices and cookies over time. The consumption of fruits, coffee and pastries and desserts decreased significantly across all income, except among adolescents with family income higher than two minimum wages. Red meat and dairy product consumption decreased in the income range from half to one minimum wage, while poultry, pork and fish consumption increased in the same income range. Among adolescents with family income higher than half a minimum wage, rice consumption decreased, while the consumption of sugar-sweetened beverages did not decrease significantly, only among those with income between one and two minimum wages. The fast food group showed an increase only in the lowest income stratum (Table 4).
Mean daily consumption in grams and 95 % CI by socio-economic level: National Dietary Surveys 2008–2018

MWB, minimum wage in Brazil.
Discussion
Our results showed changes in the weight status and dietary intake of Brazilian adolescents with a reduction in foods considered traditional in the Brazilian population, such as rice, dairy products and coffee, and an increase in the consumption of poultry, pork, fish and fast food.
Among boys, there was an increase in the prevalence of both extremes of weight: underweight, overweight and obesity, while among girls, the prevalence increased only for overweight. Our findings are in line with those found in a study based on the Food and Nutritional Surveillance System (SISVAN), with a high prevalence of thinness and obesity found in boys and an increase in the prevalence of normal weight and overweight among girls(Reference Monteiro, Varela and Lira10). Similarly, ERICA identified a higher prevalence of obesity among boys(Reference Rodrigues, Beserra and Sousa11).
Changes in energy and food consumption partly explain the changes in weight status. Shifts towards a dietary pattern with lower participation of typical Brazilian foods have been associated with obesity(Reference Bloch, Klein and Szklo12–Reference Cunha, Bezerra and Pereira14). On the other hand, energy intake remained the same over the period, suggesting that other aspects of diet may be implicated in the increase in overweight and obesity, such as the quality and degree of food processing consumed, which can interfere with gut microbiota and metabolic expenditure, potentially contributing to the rise in obesity(Reference Sichieri15).
Overall, the change in dietary intake is similar to results from other studies with the Brazilian population in recent decades. A cross-sectional study using data from the 2015 and 2019 editions of PeNSE identified a decrease in the consumption of fruits, vegetables, legumes, soft drinks and sweets, while there was an increase in the consumption of ultra-processed foods(Reference Ferreira, Silva and Gomide Nogueira de Sá16). Data from other countries indicate that adolescents’ diets are increasingly composed of high-calorie foods that are rich in sugars, fats and sodium but have low nutritional value, such as sweets, sugary drinks and fast food. In Mexico and Chile, Western dietary patterns high in processed foods and snacks were linked to greater energy intake and higher rates of overweight and obesity(Reference Rodríguez-Ramírez, García-Chávez and Flores-Aldana17,Reference Olivares, Pacheco and Lera18) . A longitudinal study also showed that continued adherence to obesogenic diets during adolescence led to poorer diet quality and increased adiposity over time(Reference Shrewsbury, Wood and Moxham19).
Data on household food acquisition from five editions of the HBS (1987–1988, 1995–1996, 2002–2003, 2008–2009 and 2017–2018) also showed a decrease in the availability of in natura and minimally processed foods, such as rice, beans and milk(Reference Levy, Andrade and da Cruz20). Data from the Surveillance of Risk and Protective Factors for Chronic Diseases by Telephone Survey (Vigitel) in recent years showed a decrease in regular bean consumption from 66·8 % in 2007 to 60·4 % in 2021 and stable low consumption of fruits and vegetables, with even lower consumption among younger adult boys. The prevalence of regular soda consumption five or more days a week decreased from 30·9 % in 2007 to 14 % in 2021(21).
Our study presents data from the pre-pandemic period. However, adolescents are particularly vulnerable to changes in their food environment and lifestyle during crises such as the COVID-19 pandemic. The ConVid Adolescentes – Pesquisa de Comportamentos, a cross-sectional study with 9470 adolescents in Brazil, showed that during the period of social distancing, there were notable changes in lifestyle: increase in the consumption of vegetables (from 27·3 to 30·5 %), frozen foods (from 13·3 to 17·3 %) and sweets (from 48·6 to 52·5 %), along with a marked increase in screen time (from 44·6 to 70·2 %). Another multinational study that included adolescents from Brazil, Spain, Italy, Colombia and Chile also found that COVID-19 confinement influenced dietary habits. Changes were observed in the consumption of fried foods, sweets, legumes, vegetables and fruits(Reference Ruiz-Roso, de Carvalho Padilha and Mantilla-Escalante22,Reference Malta, Gomes and Barros23) .
Family income has been shown to be an important factor associated with dietary intake(Reference Rodrigues, Monteiro and Cunha24). The reduction in the consumption of traditional foods such as rice, beans and red meat, along with the increase in the consumption of poultry and pork, may be related to the economic crisis that occurred in 2015 and 2016, during which family income decreased by about 6·2 %, resulting in increased food insecurity in the country, leading to greater adherence to diets with lower-cost foods(Reference Sousa, Segall-Corrêa and Saint Ville25). From this perspective, lower socio-economic classes seem to suffer more from the impact of the economic crisis since individuals with lower incomes (up to one minimum wage) were the ones who most changed consumption patterns, while those with higher socio-economic levels did not show differences in the consumption of most food groups. It is worth noting that the consumption of fast food, which, although lower among those with lower income, increased between surveys from 14·6 g per capita per day to 22·8 g.
Despite differences in consumption according to income, the reduction in rice consumption, a marker of the traditional Brazilian diet, occurred across all socio-economic levels, simultaneously with an increase in fast food consumption, especially among adolescents from lower socio-economic household income. The acquisition of ultra-processed foods increased between 1987–1988 and 2017–2018 in metropolitan regions and throughout the national territory in 2017–2018(Reference Levy, Andrade and da Cruz20). The high consumption of fast food has been shown to be a common habit among adolescents, which favours a reduction in the consumption of traditional foods by replacing traditional meals with snacks(Reference Mescoloto, Pongiluppi and Domene26,Reference Silva, Lyra and Lima27) .
The increased consumption of fast food among adolescents is concerning, given the life stage they are in, characterised by high nutrient demands(Reference Wu, Han and Zhang28). Higher consumption of ultra-processed foods is positively associated with the presence of dyslipidaemia(Reference Lima, Nascimento and Gomes29), obesity(Reference Louzada, Steele and Rezende30) and high consumption of calories, saturated fat and sodium, while being negatively associated with protein, fibre and micronutrient consumption, contrary to a nutritionally balanced diet for a healthy adolescent development(Reference D’avila and Kirsten31,Reference De Lacerda, Do Carmo and De Sousa32) .
Changes in dietary intake also occurred differently between sexes, with the increase in fast food consumption occurring among older boys (15–19 years old) and younger girls (10–14 years old) and a reduction in the consumption of sugar-sweetened beverages occurring only among girls. A recent systematic review that assessed the frequency of meals consumed by Brazilian adolescents and associated habits concluded that there is an inadequate dietary pattern among adolescents, but boys seem to consume more soft drinks than girls(Reference Ferreira, Silva and Gomide Nogueira de Sá16,Reference de Sousa, Wolf and Martini33) . A study conducted using data from the Longitudinal Study on Sedentary Behavior, Physical Activity, Diet, and Health of Adolescents (LONCAAFS Study) showed that boys had higher adherence to the dietary pattern named ‘Snacks,’ characterised by processed meats, butter, margarine, bread and savoury cookies(Reference Neta, Steluti and de Lima34).
On the other hand, a positive aspect observed in both sexes (younger boys and older girls) was the reduction in the consumption of pastries and desserts, given that these foods are highly processed and nutritionally unbalanced(Reference Monteiro, Varela and Lira10).
One limitation of this study is that anthropometric data were obtained using different methods across the two surveys – measured in the first and self-reported in the second. Therefore, the observed increase in obesity prevalence among boys only may, in part, be explained by the common tendency to underestimate weight and overestimate height when self-reporting. Nevertheless, studies indicate that boys tend to report anthropometric data more accurately and precisely than girls, while weight underestimation is more frequent among girls, regardless of age(Reference Danubio, Miranda and Vinciguerra35,Reference Conde, Oliveira and Borges36) . Despite these known biases, previous research has shown high agreement between measured and self-reported anthropometric information among adults(Reference Moreira, Luz and Moreira37) and adolescents(Reference De Farias38)
Another limitation of this study is the use of different methods to collect dietary intake information: in 2008–2009, food records were used, and in 2017–2018, a 24-h dietary recall; however, both surveys used probing questions to identify frequently forgotten items based on multiple-pass methods.
The present study’s strength lies in the use of nationally representative data based on individual dietary intake data, allowing the presented results to reflect the actual food consumption and weight status of adolescents aged 10–19 years across the national territory at two different time points.
The changes of the last decade, marked by the decline in consumption of traditional Brazilian foods and the increase in fast food consumption, represent a reduction in the nutritional quality of the diet of Brazilian youth. Changes in consumption were more pronounced in individuals with low socio-economic status, and gender proved to be an important factor influencing food consumption. Economic and public health policies are necessary to enable and encourage the consumption of foods considered healthy and important markers of dietary quality and to discourage the consumption of ultra-processed foods, especially among individuals with lower income and boys.
Supplementary material
For supplementary material/s referred to in this article, please visit https://doi.org/10.1017/S0007114525104194.
Acknowledgements
Conselho Nacional de Desenvolvimento Científico e Tecnológico (CNPQ/Ministry of Health – (no. 443369/2016-0). BGLM received a Master’s fellowship from the Coordenação de Aperfeiçoamento de Pessoal de Nível Superior (CAPES).
Study design and planning: I. N. B. and R. S. Data collection, analysis and interpretation: B. G. L. B. and I. N. B. Elaboration or revision of the manuscript: B. G. L. B. and I. N. B. Approval of final version: all the authors. Public responsibility for the manuscript content: all the authors.
The authors declare no conflicts of interest.