Introduction
The search for government performance (or effectiveness) by scholars and practitioners in public administration, public management and public policy intensified with widely adopted reforms during the last quarter century (Ingraham and Moynihan, Reference Ingraham and Moynihan2000), and those reforms centred on improving government effectiveness as a way of enhancing the accountability of government organisations (Boschken, Reference Boschken1994, 308). In this vein, a wide variety of recent studies have centred on the performance (or effectiveness) of governance in the public sector. Some studies focus on predicting organisational effectiveness using sets of independent variables (e.g., Boyne, Reference Boyne2003; Brewer and Selden, Reference Brewer and Coleman Seldon2000; Chun and Rainey, Reference Chun and Rainey2005; Hicklin et al., Reference Hicklin, O'Toole and Meier2008; Ingraham et al., 2003; Kim, Reference Kim2004; Lee and Whitford, Reference Lee and Whitford2009; Lynn et al., Reference Lynn, Heinrich and Hill2000; Meier et al., Reference Meier, O'Toole, Boyne and Walker2007; Moynihan and Pandey, Reference Moynihan and Pandey2005; O'Toole and Meier, Reference O'Toole and Meier1999 and Reference O'Toole and Meier2003; Pitts, Reference Pitts2005; Provan and Milward, Reference Provan and Milward1995; Rainey and Steinbauer, Reference Rainey and Steinbauer1999; Walker and Boyne, Reference Walker and Boyne2006; Whitford et al., Reference Whitford, Lee, Yun and Jung2010; Wolf, Reference Wolf1993 and Reference Wolf1997), while others address questions of measuring government effectiveness (e.g., Provan and Milward, 2001; Boyne, 2002; Selden and Sowa, 2004; Brewer 2006).
Most studies on organisational effectiveness in the public sector have sought to model or explain organisational performance. They differ both in their locus of analysis (the place where the assessment of effectiveness happens) and their focus of analysis (the subject of effectiveness measurement). With regard to locus, only a few studies have addressed the question of the factors that influence effectiveness at the level of a country's entire government (Kirlin, Reference Kirlin2001; Yang and Holzer, Reference Yang and Holzer2006), especially using cross-country analysis (Brewer et al., Reference Brewer, Choi and Walker2007; Knack and Keefer, Reference Knack and Keefer1995). One classic is Putnam's work on the performance of the Italian government (Reference Putnam1993), and a more recent project is the Pew Center on the States’ Government Performance Project, but both focus on a single country's government effectiveness (e.g., Knack, Reference Knack2002). Of course, we have long recognised that comparative study helps public administration achieve scientific status (Dahl, Reference Dahl1947), and in organisation theory “the statement that an organization is effective necessarily implies a comparison with some other organization or set of organizations” (Pfeffer, Reference Pfeffer1977, 133).
The few cross-national studies of government effectiveness have focused on technical questions such as the impact of meritocratic recruitment, internal promotion and career stability on performance in less developed countries (Rauch and Evans, Reference Rauch and Evans2000), administrative reform in the Organization for Economic Co-operation and Development (OECD) countries (Brewer, 2004) or corruption in Asian countries (Brewer et al., Reference Brewer, Choi and Walker2007). One broad account of the performance question reviewed performance data from the World Bank, the European Central Bank's public sector efficiency study, the Global Competitiveness Report and the World Competitiveness Yearbook to develop rankings (Van de Walle, Reference Van de Walle2006). Most studies have a narrow focus, almost always in terms of both causal mechanisms and the type of countries sampled.
We develop a different line of inquiry by modelling government effectiveness at the level of a country's entire government to identify the impact of democratisation. Our focus is on perceived government effectiveness; we examine data drawn from the World Bank's Governance Indicators dataset, which was measured from 1996 to 2008 across 212 countries, and adjust those data to develop a new measure. Our new measure is an income-adjusted perception measure that describes the perceived quality of government given a country's position in time and its relative income (measured as gross domestic product, adjusted for purchasing power parity). This new measure accounts for how perceptions of quality vary with a country's income position.Footnote 1 Of course, we recognise that perceptions depend upon the perceiver; in this case, we argue that the World Bank measure has a specific embedded interpretation of “good government” that can be described partly in terms of “predictability”.
We examine the impact of democratisation on perceptions of the quality of government, once relative income position has been taken out of the equation. We argue that the impact of democratisation is likely to be non-linear: that the highest levels of perceived government effectiveness will be observed in both autocratic and democratic governments, and that countries that lie between these “poles” have lower levels of perceived government effectiveness. Montinola and Jackman (Reference Montinola and Jackman2002) observed this non-linear pattern in the case of corruption, although our reasoning is slightly different from theirs.
Specifically, we argue that the effect of democratisation depends on two mechanisms. Essentially, the tension is between the costs associated with “dictatorship” and those associated with “disorder” (Djankov et al., Reference Djankov, Glaeser, La Porta, Lopez-de-Silanes and Shleifer2003). For a country seeking to develop, the costs of disorder provide incentives for authoritarian governance; examples include certain countries in the former Soviet Union. Yet, once a country establishes mechanisms for controlling disorder, it pays to release the hold of the tyrant; over time, democratic societies tend to pursue efficient institutions that make governments work better (Wittman, Reference Wittman1989). As Djankov et al. (Reference Djankov, Glaeser, La Porta, Lopez-de-Silanes and Shleifer2003, 613) note, “The substantial rise in the world's prosperity in the 20th century may be the best evidence of the virtues of democratic politics.”
Together, these results show how two different cost-benefit calculations drive nations toward the poles of authoritarian and democratic control. Our model below shows that perceptions of government effectiveness, once the level of economic development has been controlled for, are higher at the extremes of the democratisation experience (at high and low levels) than they are for those countries in the mid-range of the democratisation experience. Indeed, the estimated impact of moving from the least democratic range to the mid-range is almost a standard deviation of the dependent variable; moving from the mid-range then to the most democratised countries has the same effect.
Our focus on the possible non-linear effect of democratisation sets this paper apart from other research on government effectiveness. For example, La Porta et al. (Reference La Porta, Lopez de Silanes, Shleifer and Vishny1999) examined the impact of political freedom on a variety of measures of the “quality of government”, but their data on interference with the private sector, public sector efficiency, public good provision and size of public sector are largely cross-sectional. Adserà et al. (Reference Adserà, Boix and Payne2003) examined different measures of the quality of government along with those for corruption and rule of law from the Political Risk Services Group. Recent papers include Bäck and Hadenius (Reference Bäck and Hadenius2008) and Charron and Lapuente (Reference Charron and Lapuente2010). Neither study accounts for the relationship between national income and quality of government through the dependent variable itself. Both potentially conflate the impact of OECD status with that of democratisation.
Bäck and Hadenius (Reference Bäck and Hadenius2008) argued that democratisation's effects should be seen as the difference between pressure from “below” and from “above”, and argued for a J-shaped relationship between democracy and state capacity. We theorise about the costs and benefits of dictatorship and disorder, and observe a U-shaped relationship between democratisation and income-adjusted perceptions of government effectiveness. Bäck and Hadenius (Reference Bäck and Hadenius2008) see administrative capacity as combining measures of quality and control of corruption. We measure our dependent variable as income-adjusted perceived government effectiveness. Neither La Porta et al. (Reference La Porta, Lopez de Silanes, Shleifer and Vishny1999) nor Adserà et al. (Reference Adserà, Boix and Payne2003) address income-adjustments; they also do not assess the non-linear impact of democratisation.
Finally, our data are more exhaustive, more specifically perception-based, and in some ways more politically salient. This is especially true given how the World Bank data is used in the Millenium Challenge Account process to rank countries when allocating foreign aid.
Our paper proceeds as follows. In the next section, we describe our measure of perceived government effectiveness as a key way of understanding government performance. We then provide more details on the non-linear effect of democratisation on perceptions of the quality of government. In the fourth section, we describe our variables and dataset used for this analysis, followed by our model estimation and results. Finally, we offer a discussion of the analysis of effectiveness and how this approach pushes the boundaries of the study of governance.
Perceiving government effectiveness
Our dependent variable that measures government effectiveness comes from the World Bank Governance Matters project. Since 1996, the World Bank has built worldwide governance indicators due to a belief that governance matters. Specifically, there are strong causal relationships between good governance and development outcomes such as higher per capita income, low infant mortality and higher literacy (Kaufmann et al., Reference Kaufmann, Kraay and Zoido-Lobatón1999). The Governance Indicators measure six dimensions of governance: voice and accountability, political stability and absence of violence, government effectiveness, regulatory quality, rule of law and control of corruption. Our data for the dependent variable cover 212 countries from 1996 until 2004. They were updated every two years between 1996 and 2002; they have been updated annually since 2002.
We centre on the dimension of government effectiveness. The idea behind the World Bank government effectiveness indicator is to capture the capacity of the state to implement sound policies by measuring the quality of public services, the quality of the civil service and the degree of its independence from political pressures, the quality of policy formulation and implementation, and the credibility of the government's commitment to such policies.
We want to be very clear that this indicator measures subjective perceptions regarding government effectiveness in different countries. These data come from two types of sources (Kaufmann et al., Reference Kaufmann, Kraay and Zoido-Lobatón1999). The first type of source is polls (surveys) of experts, which reflect country ratings produced by commercial risk rating agencies and other organisations. Surveys of experts capture the perceptions of country analysts at major multilateral development agencies (e.g., the European Bank for Reconstruction and Development, the African Development Bank, the Asian Development Bank and the World Bank), reflecting these individuals’ in-depth experience working on the countries they assess (Kaufmann et al., Reference Kaufmann, Kraay and Mastruzzi2007). The second type is cross-country surveys of residents carried out by international organisations and other non-governmental organisations. Surveys of residents are surveys of individuals or domestic firms (such as the World Bank's business environment surveys and the World Economic Forum's Global Competitiveness Report) with first-hand knowledge of the governance situation in the country.
The goal of subjective measurement is to find out an alternative for the difficulty of obtaining objective data for many issues. Likewise, perceptions may often be as important as objective differences in institutions across countries. Perhaps most importantly, research shows that subjective perceptions have significant explanatory power for future economic outcomes (e.g., through consumer and investor expectations) (see Kaufmann et al., Reference Kaufmann, Kraay and Zoido-Lobatón1999). We do recognise that these perceptions of government effectiveness are not a random draw from the total pool of perceptions that exist in and about a given country. Instead, it is likely that the perceptions reflect what Schattschneider said in reference to the debate over pluralist and elite theories of governance: “The flaw in the pluralist heaven is that the heavenly chorus sings with a strong upper-class accent” (Reference Schattschneider1960, 35). We argue that the items described below largely relate to the kinds of conceptualisations that observers like the World Bank and other actors involved in direct foreign investment will find most salient (such as predictability and stability).
The World Bank data rely on 47 individual items taken from 18 different sources that measure different dimensions of government effectiveness. The effectiveness indicator is a latent variable. It combines many different individual data sources. The aggregation procedure first rescales the individual indicators from each underlying variable's source in order to make them comparable across data sources (Kaufmann et al., Reference Kaufmann, Kraay and Mastruzzi2007). It then constructs a weighted average of each of these rescaled data sources to arrive at an aggregate indicator of government effectiveness. The weights assigned to each data source are in turn based on the estimates of the precision of each source that are produced by the unobserved components model. Essentially, this is an “item response theory” model of survey responses. Each measure on the latent scale of “effectiveness” that underlies these different individual items is associated with an estimate, standard error of the estimate and number of sources used to construct the estimate. The number of sources used to construct an estimate for any country in a given year varies; thus, accordingly, estimates of the country's position on the latent variable can be noisy.
Table 1 shows the wide variety of descriptions of the individual items, the range of countries covered, and the years for which specific sources are available. This table shows how difficult it can be to measure effectiveness at this level of analysis. The range of considerations shows that, in practical terms, different sources and survey houses conceptualise effectiveness differently. Some measures are only available for the most developed countries; others are widely available for an array of countries (although perhaps at the cost of offering fewer measurements per country). We use data for our dependent variable until 2004 due to missing covariate information.
Sources and measurements of perceived government effectiveness indicator

As noted, we have reasons to examine a perceptions-based measure of the quality of government. The problem is the biases inherent in perceptions-based measures. Using an aggregate measure based on the estimation of a latent variable of perceived effectiveness helps overcome those biases in the selection of specific survey instruments carried out in certain geographic regions. For our indicator, positive values of the index measure reflect positive assessments of an individual government's effectiveness by respondents across the multiple indicators and surveys. The variable is centred on zero, has a standard deviation of roughly one and ranges between −2.5 and +2.5.
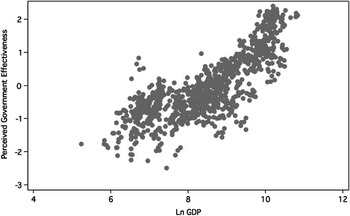
More importantly, measures such as the quality of government inherently depend on the level of economic development of a country. Part of the World Bank's argument for addressing governance failures is that poor governance contributes to lower economic growth and adverse economic circumstances. This may be so, but we are similarly concerned that countries with unstable economies or lower tax bases are unable to staff and maintain quality government infrastructures, processes and practices – and that those deficiencies become reasons for evaluators to grade some governments as having lower effectiveness. This possibility is overt in studies like La Porta et al. (Reference La Porta, Lopez de Silanes, Shleifer and Vishny1999); admittedly, this can be a form of endogeneity. Indeed, the measure of government effectiveness is correlated with the natural log of per capita gross domestic product (GDP), adjusted for purchasing power parity (PPP), at 0.81.Footnote 2Figure 1 shows the raw scatter plot of perceived government effectiveness and the natural log of per capita GDP. A positive relationship is clearly seen, although substantial variation remains in the perceived government effectiveness measure. The upshot is clear: not accounting for the impact of national income on the quality of government is problematic, given that a positive relationship between perceived government effectiveness and per capita GDP is observed, as seen in Figure 1. Including it as an exogenous variable is also problematic, if only because democratisation may cause both the quality of government and the level of national income (as we discuss in more detail below). For this reason, we turn to a new income-adjusted measure of perceived government effectiveness.
Perceived government effectiveness and per capita GDP

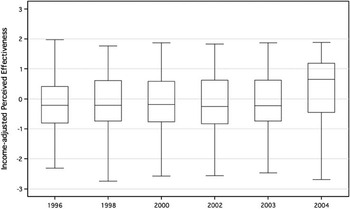
Our measure of income-adjusted perceived government effectiveness is obtained by rescaling the World Bank perceptions measure for quality of government by the measure of ln per capita GDP that accounts for PPP. At a minimum, this allows us to compare countries’ perceived quality of government while taking into account their income position. Figure 2 shows the distribution of this new measure as calculated for up to 212 countries through 2004. At the aggregate level, there appears to be remarkable stability in these measurements. The box plots show that the 2004 data have a tighter distribution, although there are a few high outside values in this time period, too. The medians move slightly upward in 1998 and then downward until reaching a low in 2003; there is an upward movement in 2004.Footnote 3
Income-adjusted perceived government effectiveness over time

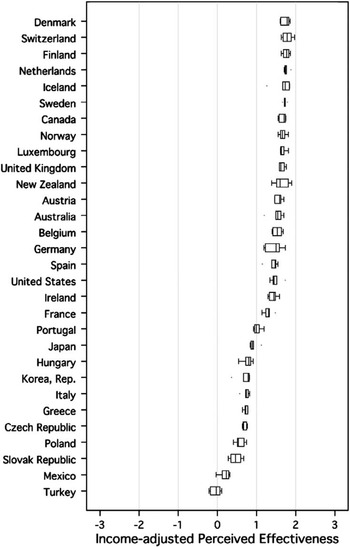
We recognise that not all countries are the same. For instance, as other papers have shown, the OECD countries are a particular group, to the extent that there may be two types of countries with high income (those that are members of the OECD and those that are not). Indeed, OECD status may produce additional benefits in terms of “good governance” strategies in terms of higher perceptions of government effectiveness, if only because they are probably the most studied countries in the history of policy studies. Figure 3 shows that for OECD countries, the highest median perceived effectiveness scores are located in northern Europe; recent admissions to the OECD are in the bottom half, although the USA and Japan also rank in the bottom half. The mean of the OECD countries is 1.249; the mean for non-OECD countries is −0.371 (t = 32.72, Satterthwaite's d.f. = 397.44). At a minimum, studies that centre on the OECD countries only concentrate on the extreme top percentile of the dependent variable.
Income-adjusted perceived government effectiveness, OECD

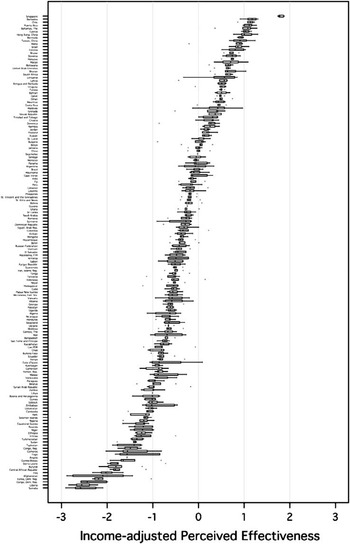
Figure 4 shows the other side of the data (all non-OECD countries). Recall that all but nine of the OECD countries have median measurements above 1.00. The vast majority of non-OECD countries have measurements below 1.00, and only Singapore has very high scores. These measurements are already adjusted for per capita GDP, so other explanations must describe this variance.
Income-adjusted perceived government effectiveness, non-OECD

Democratisation as a piece in the institutional puzzle
The issue in making government effective is one of designing institutions. Specifically, “the fundamental problem of institutional design is the conflict between the twin goals of controlling disorder and dictatorship” (Djankov et al., Reference Djankov, Glaeser, La Porta, Lopez-de-Silanes and Shleifer2003, 597). The “new comparative economics” has centred on the problem of institutional design as a route to solving the problems of different economic levels and different paths for countries. As they put the question: “is democracy the best system for economic reform or is dictatorship efficient when radical change is required?” (Djankov et al., Reference Djankov, Glaeser, La Porta, Lopez-de-Silanes and Shleifer2003, 597). The tension is between dictatorship and disorder. Controlling disorder puts a premium on dictatorship; controlling the state puts a premium on democratisation. The case for democracy as a mechanism is fairly common, so we first turn to the case for authoritarianism as a mechanism for making governments effective.
The simple reason autocrats might choose to make government effective is that they prefer unity of command and control over the apparatus of the state. That simple reason masks the deeper question: what do they do with that control? The answer is surprisingly complex; it involves the autocrat's motivation for “protecting” the citizens of the state, and that protection incentive itself depends on the autocrat's time horizon. McGuire and Olson (Reference McGuire and Olson1996) model the autocrat as a “roving bandit” and show that, under fairly general conditions, an autocrat with a “lasting hold on his domain” will prefer public goods for society over redistribution to himself. The key dividing line between good and bad autocrats is their individual time horizons since they must expect a lasting connection between themselves and the society they oversee. The unique situations of individual dictators are likely to be more complicated (e.g., Bueno de Mesquita et al., Reference Bueno de Mesquita, Smith, Siverson and Morrow2003; Shen, Reference Shen2007; Wintrobe, Reference Wintrobe1998), although in general the willingness of dictators to supply predictability and stability (at least for themselves) is much more supported than often assumed in the political science literature. We view this as an attractor in the relationship between effective government and democratisation: that at low levels of democratisation, the authoritarian government (the autocrat) is likely to provide stable and effective governance. This suggests a negative relationship between democratisation and perceived government effectiveness.
In contrast, the literature on democratisation suggests a positive relationship between democracy and government effectiveness. This is in large part due to the efforts of Barro (Reference Barro1997 and Reference Barro1999), Kurzman et al. (Reference Kurzman, Werun and Burkhart2002), and Persson and Tabellini (Reference Persson and Tabellini1994), among many others, to document the mechanisms relating to the institutions underpinning democracy. Studies noted above such as La Porta et al. (Reference La Porta, Lopez de Silanes, Shleifer and Vishny1999) and Adserà et al. (Reference Adserà, Boix and Payne2003) show direct effects of democratisation on different measures of “good governance”. Essentially, the key mechanism is considered “political accountability”, which flows from a principal-agent conceptualisation of the relationship between politicians and citizens. The public control of politicians reduces the likelihood that they will pursue their own political agenda or enrich themselves in office. The mechanism is fairly standard in political science theory although, when applied to the problem of explaining economic growth, the possibility of reverse causation is also relevant (the “Lipset/Aristotle hypothesis”) (Barro Reference Barro1999).
Interestingly, recent papers like Acemoglu et al. (Reference Acemoglu, Johnson, Robinson and Yared2008) argue specifically that the link between democracy and growth is tenuous, unless reconsidered as the link between growth and long-run institutional developments that may be related to democratisation. They argue that studies that demonstrate a strong cross-country correlation between income and democracy are flawed because they do not control for factors that affect both variables. Their instrumental-variables estimates reveal no causal effect of income on democracy, and the association between income and democracy is not robust to the inclusion of country fixed effects.
These two approaches combine to give contradictory predictions. The literature on autocracy suggests that it can produce stability and predictability in government. The literature on democracy suggests that it can reduce the bad incentives autocrats face. The simplest combination is to return to the tension between dictatorship and disorder. We argue that, as one slides up the democratisation axis from authoritarianism, one also moves down the effectiveness frontier; this happens because increasing disorder reduces the effectiveness of government. As one moves down the democratisation axis from democracy, one also moves down the effectiveness frontier; this happens because of the benefits democracy brings in terms of improved accountability. As one moves away from either of these poles – from either democracy or authoritarianism – the transition brings greater disorder and lower perceived government effectiveness. One may think that somewhere in the middle between autocratic control and complete freedom is seen as optimal, but we think the government effectiveness of this case can be lower than those of two poles because of the following reasons. When an authoritarian government is relaxed, former centralised and top-down management is not easily maintained because the control system becomes loose (Bäck and Hadenius, Reference Bäck and Hadenius2008) and, as a result, the effectiveness of government can get worse. In addition, when a nation or a government has begun to be democratised, its institutional requisites for democracy are still lacking and a lot of new actors are getting involved (Bäck and Hadenius, Reference Bäck and Hadenius2008). This can lead to lower government effectiveness. Bäck and Hadenius (Reference Bäck and Hadenius2008, 7) pointed out that the level of the capacity of the governments in the Middle East or North Africa has been relatively stable, given that they usually have authoritarian systems, while countries in Latin American where substantial democratisation has taken place report quite low levels of government capacity.
Alternative explanations for government effectiveness
We also account for a range of other possible causes for the perceptions of government effectiveness that are the focus of this study. The locus of our measurement is at the national level, so our other possible explanations must also map onto mechanisms that operate at the national level. For example, one possible cause would be geographic location, which is a convenient way to group countries. Geographic location does not provide a compelling explanation for the differences, though, and it does not delineate a mechanism that turns an attribute “input” into an effectiveness “output”. Instead, we centre our investigation on broad categories of causes that are drawn from the literature on comparative political economy and development. These categories are admittedly coarse and insufficient for describing the variety of ways that governments attain effectiveness and obtain positive effect on the part of outside evaluators. They are also largely structural attributes that are difficult to change in the short-run if designers are seeking ways to make governments more effective (as the World Bank clearly is). The advantage of this research strategy is that we can identify the variance across countries in this index that is due to these types of characteristics, which helps us understand how much other mechanisms help explain that variation.
The first explanation we assess is based on the idea that the legal origins of a country support the mechanisms of governance that underlie perceptions of effectiveness. The classic distinction here is between English origins and those based on other systems. English origins indicate a compendium of attributes about the relationship between citizen and the state, such as judicial versus legislative precedent and rights to private property. The literature identifies the impact these aspects of a legal system have on institutional performance (Acemoglu, Reference Acemoglu, Johnson and Robinson2000; La Porta et al., Reference La Porta, Lopez de Silanes, Shleifer and Vishny1997, Reference La Porta, Lopez de Silanes, Shleifer and Vishny2000). We recognise, too, that some countries with certain origins have a legacy of administrative systems (e.g., French prefectures or Weberian administrative systems). This is particularly relevant given the Acemoglu et al. (Reference Acemoglu, Johnson, Robinson and Yared2008) paper reviewed above.
We next move to structural factors that flow from the constitutional design literature, namely the effects of presidential versus parliamentary systems, the role of federalism, and having a proportional representation-based electoral system. First, in separation-of-powers systems, the president's “decree power” or the implementability of “law made by the executive and not subject to congressional review” (Shugart and Carey, Reference Shugart and Carey1992, 140) may reduce the perception that government is effective. Presidential systems seem to increase the costs of decision-making over parliamentary systems given the existence of redundant players (Haggard et al., Reference Haggard, McCubbins and Shugart2001). We argue that parliamentary and weak presidential systems have higher measures of government effectiveness than do strong presidential systems.
Federal systems may increase representation (increasing perceptions of effectiveness), but may also reduce accountability (reducing perceptions of effectiveness). Local elections may provide voice to ignored populations, but monopolisation of power at the local level may also decrease the degree of accountability. There is empirical evidence, however, that federal systems are generally more corrupt than unitary systems (Gerring and Thacker, Reference Gerring and Thacker2004; Treisman, Reference Treisman2000). As the political pie is divided among more geographic entities, opportunities to generate political rents increase, thus we can see reductions in perceptions of effectiveness. We recognise that there are different kinds of federal systems (weak and strong), with weaker systems having greater roles for the national government than strong systems.
Single member plurality (SMP) electoral systems make it more difficult to make policy decisions than do systems based on proportional representation (PR) (e.g., Cox and McCubbins, Reference Cox and McCubbins2005). The many political parties that compete within PR systems must be accommodated in policy formulation; a change in the governing coalition makes policy unstable if deals are renegotiated. PR systems are thought to be “feeble”. In contrast, SMP systems organise political competition between individual members of rival parties at the level of a geographic jurisdiction. We examine whether PR systems have lower perceived effectiveness. At the same time, however, PR systems are more “representative” in that they do represent minority interests and deliver power to more than two parties (due to Duverger's Law).
We also address a set of proposals about aspects of the government in power. Our first test is whether perceived effectiveness depends on the presence or absence of extra-constitutional electoral fraud in the last election that affected the outcome. Our variable identifies whether vote fraud or candidate intimidation was serious enough to affect the outcome of elections. We test whether governments led by military officers are perceived to be less effective. Our variable indicates whether the state's chief executive is a military officer. Interestingly, we note that, in some cases, military status of leaders is not related to poor governance practices. For example, although discoveries of corruption during the Pinochet years have surfaced recently, the extent to which Chilean officials participated in corrupt practices is generally thought to be low relative to other military governments in Latin America (Barros, Reference Barros2002).
Large, complex countries are often more difficult to govern. We assess the impact of size by including a measure of the land area of each country (rescaled by natural log). There is a long history of studying the impact of land area on administration and efficiency (e.g., Fesler, 1942), although these studies have not been in vogue in recent years.
Finally, for the reasons discussed above, we also account for the effect of OECD member status.
Data, model estimation and results
We first describe the measurement strategies we followed for our independent variables. We then describe our estimation strategy, and the results of our analyses.
Our measure of democratisation comes from Gurr et al. (Reference Gurr, Marshall and Jaggers2003). The Polity variable is assigned to each country based on the level of democracy versus autocracy within its political system. Scores range from −10 (most autocratic) to 10 (most democratic); we rescale this to range from 0 to 20, and include both the measure and its square.
Our data on legal origins come from La Porta et al. (Reference La Porta, Lopez de Silanes, Shleifer and Vishny1997). Countries with English origins (mostly former English colonies) appear to have scores in the middle range, and indeed the distribution for those countries is the most variable. A t-test seems to show that countries with English origins have relatively higher income-adjusted government effectiveness (t = 2.869, Satterthwaite's d.f. = 919).
Our data on the type of political system come from Beck et al. (Reference Beck, Clarke, Groff, Keefer and Walsh2001). We measure three types: a direct-elected (strong) presidential system, an assembly-elected (weak) presidential system and a parliamentary system. The data show that parliamentary systems exhibit higher perceived government effectiveness than either presidential or weak (assembly-appointed) presidential systems. A simple regression of the index on the system categories (with presidential systems omitted) appears to show that governments led by assembly-appointed presidents have lower perceived effectiveness than do strong presidential systems.
We divide federalism into three categories: those in which both the local executive and local legislature are directly elected (a strong federalist state), those in which one is directly elected (a weak federalist state) and those in which neither local executive nor local legislature is directly elected. The data on federalism is from Beck et al. (Reference Beck, Clarke, Groff, Keefer and Walsh2001). A simple regression of the index on the types (with unitary systems omitted) suggests that strong federal systems are perceived to be more effective than mixed or unitary systems.
We also indicate whether the electoral system is proportional representation (PR); these data are from Beck et al. (Reference Beck, Clarke, Groff, Keefer and Walsh2001). A t-test of the hypothesis shows that PR systems are perceived to be more effective (t = 6.374, Satterthwaite's d.f. = 777).
Our data on the presence or absence of extra-constitutional electoral fraud in the last election that affected the outcome is from Beck et al. (Reference Beck, Clarke, Groff, Keefer and Walsh2001). The record is a “1” for countries where opposition parties are officially and constitutionally prohibited or when opposition is officially legal but suppressed in any way; all others are scored as “0”. States can only remove a “1” by holding a fair election if the elected government has been toppled. The calculation of this score occurs independently of local or international complaints regarding electoral malfeasance. The t-test shows that systems with fraud have lower scores on the perceived effectiveness index (t = 12.240, Satterthwaite's d.f. = 818).
The data on military involvement are from Beck et al. (Reference Beck, Clarke, Groff, Keefer and Walsh2001). It codes whether certain sources (Europa, World Handbook) include a rank in the chief executive's title. Chief executives are listed as officers for the duration of their term if they had not formally retired prior to the assumption of office. If chief executives were formally retired military officers upon taking office, then this variable is scored as “0”. The data indicate that military governments were perceived to be less effective (t = 9.468, Satterthwaite's d.f. = 900).
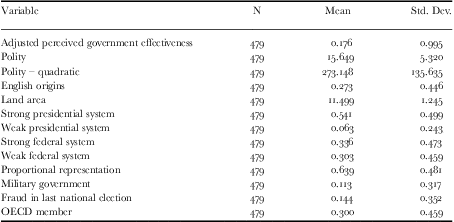
Of course, these effects are unconditional, and we understand that attributes of governments and countries are not randomly distributed. At a minimum, legal origins will not vary randomly with geography. Table 2 provides the descriptive statistics for the dependent variable and the array of independent variables that we address in this study. Missing data on these dimensions (especially our measure of federalism) make our sample sizes for the statistical analysis smaller than the samples for the dependent variable alone.
Descriptive statistics
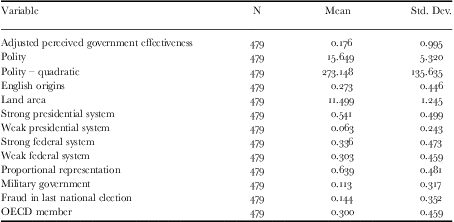
We now turn to our model to assess the impact of democratisation on perceptions of government effectiveness across a variety of countries. We model the causal relationship by using a version of generalised linear models, specifically generalised estimating equations (GEE) (Zeger and Liang, Reference Zeger and Liang1986; Zeger et al., Reference Zeger, Liang and Albert1988; Zorn, Reference Zorn2001). GEE is appropriate for panel data.Footnote 4 The main advantages of the GEE approach are the availability of flexible error correlation structures, robust standard errors and alternative distributional assumptions. This procedure is appropriate for both cross-sectionally or time-series dominant data. More importantly, this procedure yields parameter estimates that are uncontaminated by the effects of heteroskedastic and autocorrelated errors. We discuss this estimation approach in more detail in the Appendix.
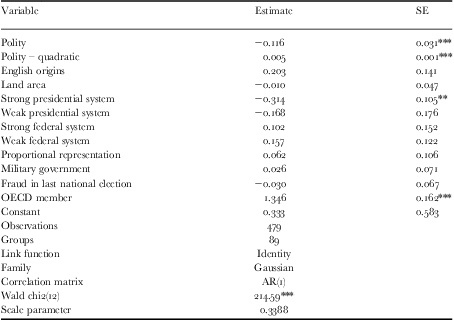
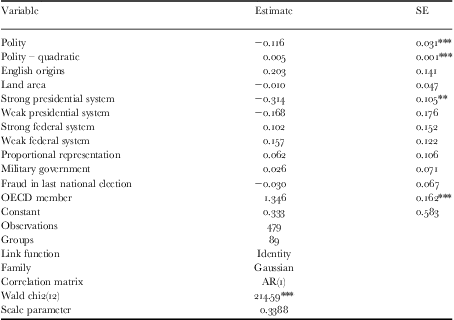
Table 3 shows the results of a GEE analysis using the effectiveness index as the dependent variable and including the variables described. The estimate for the autocorrelation parameter (ρ) is 0.92, which suggests that government effectiveness changes only very slowly. Recognise, though, that our estimates are uncontaminated by possible autocorrelation. The GEE model also accounts for the unobservable heterogeneity Acemoglu et al. (Reference Acemoglu, Johnson, Robinson and Yared2008) refer to in the debate about democratisation and growth. We find only three basic effects, although the model fit is sufficient to reject the null hypothesis that we can constrain all coefficients equal to zero. However, these three effects expressly address the hypotheses described above.
GEE population-averaged model results
*indicates significance at the 0.05 level (two-tailed test)
**indicates significance at the 0.01 level (two-tailed test)
***indicates significance at the 0.001 level (two-tailed test)
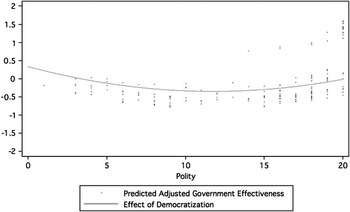
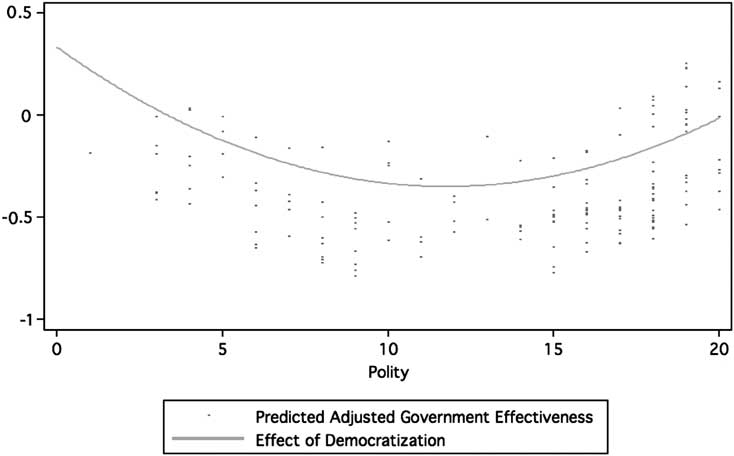
Firstly, and most importantly for this paper, the model reveals a non-linear effect for democratisation. The linear term is negative and the quadratic term is positive, which suggests a U-shaped relationship between democratisation and income-adjusted perceptions of government effectiveness. Figure 5 shows the estimated impact of democratisation for the range of data with the predictions for adjusted government effectiveness overlaid with the quadratic relationship. Essentially, the effect of democratisation first declines when it moves from its minimum to mid-range values, then rises again after it passes through its mid-range on the way to its maximum. The shift downward is close to a full standard deviation in the dependent variable, and the shift upward is nearly as large as democratisation reaches its maximum values. The estimation strategy removes concerns that the movement in the relationship is due to reaction of the income-adjusted dependent variable's denominator to the democratisation variable, and the Acemoglu et al. (Reference Acemoglu, Johnson, Robinson and Yared2008) paper indicates that that reaction is unlikely.
Estimated impact of democratisation

In sum, the impact of democratisation is a mixture of two mechanisms. The first reflects the tension between disorder and dictatorship, and, as disorder increases, the level of perceived government effectiveness falls. The second mechanism reflects the ability of democracy to reduce the power of autocrats, and, for higher levels of democratisation, the level of perceived government effectiveness rises. Note that the effect of the first mechanism appears stronger than that for the second, given that the second half of the U-shaped curve is flatter than the first half.Footnote 5
Secondly, the cloud of data tracks the curve closely – except for a cluster of predictions in the upper right-hand quadrant. These observations are the OECD countries, and, as Table 3 suggests, OECD countries have scores 1.346 points higher (on average) than others. This is almost two standard deviations higher than that for the average country, which is remarkable given that the dependent variable controls directly for each country's per capita GDP. OECD status has real impact on income-adjusted perceived government effectiveness. This impact probably has two sources, one due to an availability bias when respondents are asked to grade these countries, and another due to changes in governance mechanisms brought about due to OECD membership. In any case, it is important to recognise that papers like those reviewed above that examine the causation of government performance only in the case of OECD countries run the risk of drawing cases from a biased sample since OECD countries are well-regarded in ways that are structurally different from other non-OECD countries.
Finally, we find evidence that strong presidential systems have lower income-adjusted perceived government effectiveness measures. This is not surprising, given the theoretical expectations found in the literature on comparative political institutions. Presidential systems are unable to garner the same credibility of action that parliamentary systems garner. Yet, it is remarkable that the impact is seen in the case of strong and not weak presidential systems. This suggests that these are structurally different institutional choices that warrant additional study and assessment.
Where does this leave the study of government effectiveness if over 80 per cent of the variance in this subjective measure of effectiveness is associated with the country's placement in the world income distribution? The finding at the beginning of this paper noted that inferences about government effectiveness drawn from developed nations do not provide clear information about whether those innovations are transplantable to lesser-developed nations (e.g., Djankov et al., Reference Djankov, Glaeser, La Porta, Lopez-de-Silanes and Shleifer2003). The model here moves beyond this problem to show how much of an impact there is on perceived effectiveness as one moves across different combinations of political institutions after one has adjusted the effectiveness measure to control for each country's income.
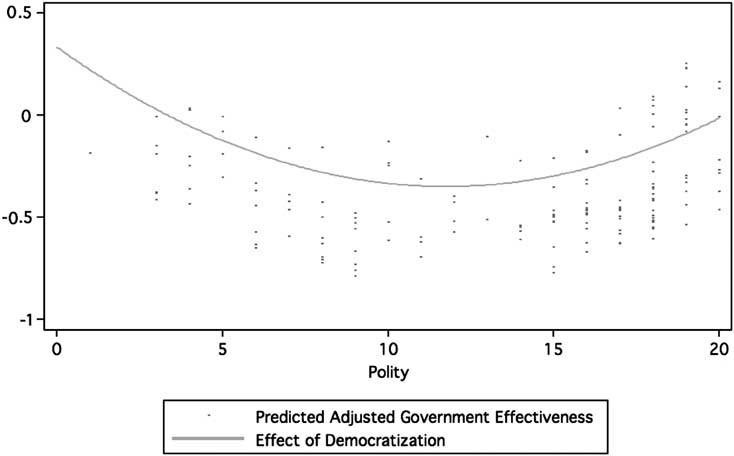
The relevant question is whether we can identify countries that across the board do better (or worse) than they should given the results shown from the model reported in Table 3. Figure 5 shows the plots of the distribution of the predictions for countries. The OECD countries are surely different, and, as we argued above, papers that focus solely on OECD countries run the risk of making judgements that cannot be transplanted to other, non-OECD, countries. So, too, are inferences drawn from Figure 5. Figure 6 plots the data from Figure 5 without including the OECD countries. In this case, the impact of democratisation on income-adjusted perceived government effectiveness is placed in clear relief by removing the focal point in Figure 5's upper right-hand quadrant. Now we see the true shape of the relationship and the mixing of the two mechanisms.
Estimated impact of democratisation, non-OECD countries
Discussion
The purpose of our paper is to examine the impact of democratisation on government effectiveness. Democracy can be an efficient solution in the search for institutions that support the kind of economic growth the World Bank focused on when it started the Governance Matters project. Yet, there are strong theoretical reasons to believe that democracy can be inefficient – that it is not a useful solution to the “dictator/disorder” dilemma some countries must navigate.
To that end, we investigate the variation in government effectiveness across not only countries but also time, and test the role of specific factors in explaining the variation in government effectiveness. This study uses data from the World Bank – data that are used by decision-makers around the world to form inferences about the performance of other governments and which are drawn from thousands of respondents polled by multiple survey houses about a number of key attributes of government effectiveness. We first show that the use of these data fills a significant gap in our understanding of effectiveness in a comparative perspective. Based on a number of data vignettes, we then show that a number of standard explanations for government effectiveness are unable to characterise much of what we observe in these data.
We recognise that much of the variance is explained by the relative position of countries in the worldwide income distribution, with wealthier countries experiencing greater perceptions of effectiveness and those in the lower parts of the distribution being perceived as less effective. We argue that not accounting for the impact of national income on the quality of government is problematic. Including national income as an exogenous variable is also problematic, in part because democratisation can cause both the quality of government and the level of national income. For this reason, we turn to a new income-adjusted measure of perceived government effectiveness.
Yet, we also show that, once this relationship is accounted for, we can identify the non-linear effect of democratisation on these perceptions. We show with data that two mechanisms operate: that both democracy and autocracy support the judgements about “effective government” we see in the data. These are judgements that World Bank has shown great interest in collecting. Perhaps the most compelling inference is that the comparative study of effectiveness reveals the limitations in what an already limited literature can say about governments, their effectiveness and the role of the public sector around the globe.
Acknowledgement
This research was supported by a grant from the Seoul National University Foundation in 2011.
Appendix
Estimation method
Our data analysis strategy is to model the causal relationships by using a version of generalised linear models, specifically generalised estimating equations (GEE) (Zeger and Liang, Reference Zeger and Liang1986). GEE is appropriate for situations such as this, when we have created a panel data set covering the countries over a series of years. The primary advantages of the GEE approach are the availability of flexible error correlation structures, robust standard errors and alternative distributional assumptions. This procedure is appropriate for the case of cross-sectionally or time-series dominant data sets. Most importantly, this procedure yields parameter estimates that are uncontaminated by the effects of heteroskedastic and autocorrelated errors. Since we have repeated measures on the units of analysis, underlying (immeasurable or unmeasured) panel-specific effects can complicate the estimation of the common coefficients. Heteroskedasticity is also likely because each panel's variance may differ and there may be variation of scale among the units. The model here includes the calculation of the robust estimate of the variance to address this and also relaxes the independence of observations assumption for common units of analysis. Specifically, because GEE is a population-averaged estimator, it is similar to a random-effects approach, but population-averaged estimators specify a marginal distribution, so estimates are an average of the cluster-specific estimates. We also calculate Huber-White standard errors to address the population-averaged estimate's robustness.
The dependent variable may shift slowly in time if adjoining observations may be serially-correlated. Specifically, in GEE estimation, ni is the number of observations for a group, R is the within-group working correlation matrix (a square max{ni} × max{ni} matrix) for modelling the within-group correlation; Rt ,s denotes the t,s element. For the GEE equivalent (population-averaged) of a random effects structure, Rt ,s = 1 if t = s; otherwise, Rt ,s = ρ. For an AR(1) structure, Rt ,s = 1 if t = s; otherwise, Rt ,s = ρ |t−s|. A third option is that each model assumes that the error correlation structure is “unstructured”, which simultaneously accounts for possible “stickiness” in the dependent variable and immeasurable effects by making no specific assumption about the form of the error correlation structure. The only constraint is that the matrix's diagonal elements are 1: Rt,s = 1 if t = s; otherwise, Rt,s = ρts (where ρts = ρst). In the model here, the GEE specification includes a Gaussian distribution for the dependent variable and an identity link function (the canonical link for the Gaussian distribution).