


Introduction
While leads make up only a small percentage of the arctic pack ice at any time, the influence of leads upon atmospheric heat flux and the physical oceanography of the upper ocean is large. The distribution, orientation relative to the wind, width, and areal coverage of leads needs to be incorporated in ice dynamics models and in surface exchange budgets. Leads are also of great importance operationally as they provide an easy path for ships and egress for submarines. Relatively little is known, however, about the regional, seasonal, and interannual dependences of lead statistics. Satellite imagery provides a means by which to address questions concerning the large-scale distribution of leads.
The Arctic Leads Accelerated Research Initiative (ARI) is an Office of Naval Research-sponsored program which has as its objective a better understanding of lead dynamics. Under the remote sensing component of the ARI, a five-year data set of Advanced Very High Resolution Radiometer (AVHRR) imagery is being compiled. Processing for 1989 has been completed, and data selection for the remaining years is underway. The final year of the data set, 1992, will encompass the Leadex field experiment in the Beaufort Sea. The wide swath and medium resolution of the AVHRR carried on board the NOAA polar orbiter series of satellites, along with its long history as an operational sensor and the ready availability of digital data, make AVHRR imagery a logical choice for the data set. Although the data set is a resource for many studies (e.g. ice surface temperature and ice velocity investigations), the primary reasons for creating the data set are to make imagery available which will serve as a basis for an arctic lead climatology, and to spur the development of algorithms for lead statistics with which to build a climatology. These purposes drove decisions concerning how to select and process imagery for the data base. Issues such as what spatial and temporal sampling to use and how to resample and map the imagery to a projection were weighed as to how their resolution might affect the performance of an algorithm or the accuracy of a climatology. Here we describe the data set, present some image examples, and discuss how the data set can be used to form a more complete understanding of lead patterns.
AVHRR Sensor and Data Characteristics
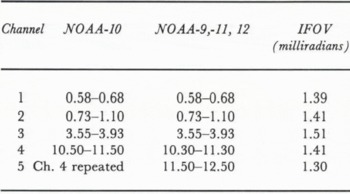
The AVHRR is a cross-track scanning instrument flown continuously on the NOAA polar orbiting series of satellites since October 1978. Two satellites are usually in orbit at any one time, with an orbital period of about 102 min, and an orbital inclination of about 99°. The sensor swath width is 2750 km, or 25° of latitude. The high temporal frequency of coverage is important because it increases the chances of obtaining cloud-free imagery of an area. The data are recorded with 10-bit precision in 2048 samples across each scan. The spectral bandwidth of each of the AVHRR channels is given in Table 1. The brightness temperature resolution of the instrument is about 0.12°. Information on channel performance and calibration parameters can be obtained in Reference Lauritson, Nelson and PortoLauritson and others (1979), Reference KidwellKidwell (1991) and Reference AbelAbel (1990).
With an altitude of about 840 km and an instantaneous field of view of 1.4 milliradians, the nominal AVHRR sensor resolution is 1.1 km at nadir degrading to about 4 km at the scan limbs (at a satellite scan angle of 55.4° from nadir). Although the size distribution of leads in the Arctic is not well known, there are relatively few leads that exceed 1 km in width (see for example Reference Hall and PritchardHall (1980)). One consequence of using AVHRR data, then, is that we are working at the limit of the sensor’s spatial resolution, and only large-scale lead patterns can be resolved. However, no other suitable wide-swath satellite data set spanning several years is available in digital form. Visible and infrared band imagery from the Defense Meteorological Satellite Program’s series of satellites, with a resolution of 0.6 km across the scan, is in some respects a better choice. Unfortunately, digital imagery is not readily available for the years of the desired data set and the selection of spectral channels is severely limited.
Bandwidths (in micrometers) for AVHRR channels
Selecting, Processing and Using Data Base Imagery
AVHRR data are archived on digital tape by the NOAA National Environmental Satellite, Data, and Information Service (NESDIS). Data are available in three forms: HRPT (High Resolution Picture Transmission), LAC (Local Area Coverage), and GAC (Global Area Coverage). GAC data are acquired during an entire orbit and stored for playback on command. Although GAC coverage is more complete than 1 km resolution HRPT or LAC coverage, the coarser 4 km resolution of GAC data is undesirable for lead studies. HRPT direct readout data are continuously broadcast from the satellite and cover areas within a ground station mask. Because the Gilmore Creek, Alaska ground station receives HRPT data covering the Beaufort, Bering, Chukchi, and east Siberian seas, these areas are well-sampled with four or five passes each day retained. LAC data are recorded onboard the satellite for playback when the satellite is within range of a command data acquisition station. Up to 10 min of LAC data can be recorded during each orbit. Most Arctic LAC coverage is at the request of the Navy/ NOAA Joint Ice Center, which uses AVHRR as the primary data source for a biweekly eastern and western arctic ice analysis. NOAA must balance the Joint Ice Center’s request for coverage of the entire Arctic with requests for LAC coverage from other users. As a result, LAC passes over seas outside the Gilmore Creek station mask are obtained on average two or three times per week.
Part of the AVHRR data base imagery spreadsheet for December, 1989. If a pass covers a large part of a sea, an entry is made in that sea’s column. All images are ranked on a scale of 1 to 5 for how cloud-free they are over an area, and how well the pass covers the area (see text). The number after the ranking gives the satellite which acquired the image. (From Reference Fetterer and HawkinsFetterer and Hawkins, 1991.)

In order to select images which give the best temporal and spatial sampling for the ARI data set, image hardcopies from the Joint Ice Center are evaluated on the basis of how much of each sea is covered by the pass, and how cloud-free the image is. A ranking of 1 to 5 is subjectively assigned for how cloud-free each sea appears in the image and for how well the image covers each sea. For instance, a rank of 5-2 for the Beaufort Sea means that the area of the Beaufort Sea imaged is 100% cloud-free, but that area covers only about 40% of the Beaufort Sea. The image evaluations are compiled in spreadsheets for each month. Figure 1 gives a portion of the spreadsheet for December 1989. Rankings are made quickly and subjectively without benefit of a grid over the hardcopy imagery. They are intended as a rough guide only. Approximately 25% of all hardcopies evaluated were of sufficient quality to enter in the spreadsheet. Only the highlighted entries were selected for the data base.
Our initial goal was to select three years of imagery with the aid of the spreadsheets so that the entire Arctic is covered every three days. Experience showed that the large but limited holdings of the NESDIS archive (only about 70% of image hardcopies had corresponding files in the archive) and, more importantly, the prevalence of cloud cover made the three day sampling requirement unrealistic. Although near-equal temporal spacing would make a climatology easier to compile, this strategy was abandoned for the remaining years of the data set in favor of selecting the sequences of cloud free imagery which often occur over an area for several days, followed by many more days of cloud cover. By selecting only exceptional series of imagery the data set could be expanded from three to five years without increasing the cost of data processing.
Imagery ordered from NESDIS arrives in Level 1B form (with earth location and calibration data appended to the sensor data). Image processing performed at the Naval Research Laboratory, Stennis Space Center (formerly the Naval Oceanographie and Atmospheric Research Laboratory) entails applying calibration data to sensor data and mapping data to a projection. Each image is mapped to one of two grids which together cover most of the Arctic except for part of the Laptev Sea ( Fig. 2). Each grid is 2250 by 2800 pixels with a pixel size of 1 km. Although the grids are large and somewhat cumbersome to manipulate, the alternative of a larger number of smaller grids would entail much higher processing costs. The large grids also ensure that an area of interest to an investigator is usually contained within one grid. The Pacific and European grids correspond roughly to the Joint Ice Center’s western and eastern Arctic designations. Since the Joint Ice Center requests satellite passes for the western and eastern Arctic analyses, passes from the archive are often nearly aligned with the grid. To facilitate comparisons between passive microwave Special Sensor Microwave/Imager (SSM/I) and AVHRR data, imagery is warped to the projection used by the National Snow and Ice Data Center (NSIDC) for arctic SSM/I data. Another factor encouraging the selection of this grid is the adoption of the projection at the Alaska SAR Facility for SAR imagery. Fetterer and Hawkins (1991) gives more information on processing as well as details on referencing the pixels in the AVHRR grid to SSM/I grid elements.
The Leads ARI data base Pacific (left) and European (right) grids. See text for further explanation.

The grid projection is polar stereographic with the map plane at 70°N. Distortion at the pole is 3%. Imagery is warped to the ground-plane projection using position tie points embedded in the scan lines of the Level 1B data received from NESDIS. The accuracy of the resulting image navigation depends on factors such as how accurately the satellite has been tracked, how long it has been since the orbital elements were updated, and the accuracy of the satellite clock. To achieve accuracy better than that given by tie points alone, each image is displayed with a graphics overlay of the coastline from the World Data Bank II (WDBII) data base (Reference Gorny and CarterGorny and Carter, 1987). If any coastline visible in the image does not match the graphics display, the image is shifted for the best possible match. Often a perfect match is not possible everywhere. This is particularly a problem along the north coast of Greenland, where experience has shown that WDBII is itself in error by several kilometers. We are unaware of documented errors in WDBII.
Calibration, or the conversion of raw data to albedo and brightness temperature, is performed using procedures similar to those described in Lauritson and others (1979). Raw count values in channels 3, 4 and 5 are converted to radiant energy which in turn is converted to brightness temperature based on the inverse of Plank–s function. A nonlinear correction to temperature is applied, and brightness temperature is then converted to output counts using the equation
N� = (10(K − 273.16)) + 500
where N is output count value and K is brightness temperature in degrees Kelvin. Output count values are stored in short integer (16 bit) form. The result is 0.1° per count, with a count of 500 equal to 0°C. Channels 1 and 2 are processed by converting raw counts to albedo using a straight line approximation based on prelaunch calibration. Albedo is expressed as a percentage of that for a perfectly reflecting Lambertian surface illuminated by an overhead sun. Each output count in the processed data is 0.1%, with a count of 500 equal to 50% albedo, 600 equal to 60% albedo, and so forth.
In selecting imagery for the data base, we are limited by the availability of cloud-free data. The proper choices concerning processing and assembling selected imagery are less obvious. A conservative strategy poses the fewest constraints upon future uses of the data. The following were considered:
(1) Data volume. Since each gridded image is very large (12.6Mb per band) there is a temptation to save space and processing time by eliminating Channel 3, which is rarely used for ice observations, and the visible band channels (1 and 2) during the Arctic winter. Since the data may be used in surface flux studies or for modeling studies of sensor response, the safest course is to include all bands. Future algorithms may use multichannel data in new ways. For instance, an algorithm for screening clouds in polar regions uses cloud shadows in addition to thermal channel information (Reference Gallegos, Hawkins and ChengGallegos and others, these proceedings). Another method of reducing data volume is to remove cloudy imagery by compositing. However, this would destroy the synoptic view of lead patterns in the data set.
(2) Auxiliary data. Path length and sun angle corrections are not made. A nadir track position file is included with each processed image file so that investigators can make their own corrections to the calibrated brightness temperature and albedo data.
(3) Mapping method. Swath pixels are resampled to 1 km grid pixels using the nearest neighbor technique. With nearest neighbor resampling, the position of pixels in the gridded image may be shifted from their true position in the swath, but the value of those pixels is unchanged. For instance, a 1.1 km swath pixel near nadir will be mapped to the nearest 1.0 km image pixel. A swath pixel from near the edge of the swath, because of its larger instantaneous field of view, will be mapped to the nearest four image pixels. Interpolation methods such as bilinear interpolation and cubic convolution were considered but rejected because they smooth lead features which are often only one pixel wide. While this results in leads appearing less jagged than is the case with nearest neighbor, the brightness of leads will be reduced and spread into adjoining pixels. This may make it more difficult to threshold an image to isolate lead pixels. The magnitude of these changes in pixel position or value will depend on the alignment of the resampling grid with the swath.
An AVHRR channel 4 image from a satellite pass on 14 December 1989. The image is mapped to the Pacific grid. A very large lead extends north from Banks Island in the lower center of the image.

Imagery is being distributed to members of the Remote Sensing Working Group in TAR format on 8 mm tape. Since each tape holds 2.6 Gb, only six tapes are required for the 15 Gb of image data processed for 1989. Although the 8 mm tapes cannot be considered permanent storage media, they are economical and well-suited for short term storage and distribution. In contrast, a 9-track tape will hold only two gridded 5-band images. At least 150 tapes would be required for a year of data. NSIDC will archive the data permanently and will make the data set available for broader distribution at a later date.
Image examples
By examining the image spreadsheets, it is possible to get a quick, rough estimate of the cloud cover and frequency of coverage for an area without having to browse through large image files. Figure 3 is an example of a channel 4 image from 14 December 1989 mapped to the Pacific grid. Its entry in the spreadsheet (refer to Fig. 1) is marked with an asterisk, which indicates that it is of exceptional quality in spite of a few dropped scan lines in the lower left corner around 130°W. Although not indicated by the spreadsheet, the image covers large parts of the central Arctic and east Siberian seas. This is an oversight due to a change in the method of evaluating imagery. For most months in 1989 and for the remaining years in the database, the spreadsheet will carry an entry for each sea at least partially covered by a pass. Only every 6th pixel is displayed in Figure 3. The bright, linear features which are leads are more apparent in Figure 4. Figure 4 is a full-resolution subsection taken from that part of the image in Figure 3 marked by the square. In addition to leads, gradients in brightness temperature are apparent. These may be due to thin clouds or to variations in the thickness of the ice.
A full-resolution subsection of the 14 December image located by the box in Figure 3. Many leads are visible.

Figures 5a and 5b are 512 km square subsections of images from 2 and 3 December 1989 which have been mapped to the European grid. The cloud cover and temporal spacing given by their entries in the spreadsheet suggest them as candidates for input to an ice motion algorithm. Figure 5c displays ice motion vectors derived from an automated autocorrelation algorithm (Reference Ninnis, Emery and CollinsNinnis and others, 1986). Results show that the velocity of the ice in this area north of Fram Strait is on the order of 20 km per day.
Using algorithms for lead statistics with AVHRR
data One purpose of the data set is to encourage the development of algorithms for automatically deriving lead statistics from imagery. All such algorithms face the same challenge: the algorithms must segment or extract leads from imagery based on the difference in albedo or brightness temperature between the lead and the surrounding ice. Because open water is warmer and less reflective than ice, this would seem to be a simple problem. But gradients due to differences in ice thickness, surface conditions, and sun angle prevent the use of a global temperature or albedo threshold to segment leads. Approaches include removing trends before applying a threshold (Reference Eppler and FullEppler and Full, 1992), or using an adaptive threshold which relies on local rather than global image statistics (Reference Key, Schweiger and MaslanikKey and others, 1990). An inescapable problem is that because of the coarse resolution of AVHRR, most pixels in the vicinity of a lead will be mixtures of lead and ice. The appropriate threshold is difficult to determine. While a temperature threshold too high will cause small leads to be missed, one too low will include pixels which are more ice than open water. Another consideration is that of how to account for the spread in the sensor’s instantaneous field of view at the scan limbs. One way to proceed is to abandon the classification of individual pixels as “lead” or “not lead” in favor of adopting the concept of the potential open water by percentage in a pixel (personal communication from R. Lindsay).
Once leads have been segmented, patterns can be characterized and statistics extracted. However, exactly what is meant by lead orientation, width and spacing is an issue when leads can be branching or intersecting, jagged or straight for long distances. One approach is to let the algorithm itself provide, by its output, the definition of lead parameters in the context of the imagery. A more flexible and satisfying approach is to provide the algorithm with rules for defining leads and extracting their statistics in an expert system (Key and others, 1990).
Conclusions
A major consideration in using the data set for lead statistics is the width distribution of leads. Studies have suggested that the frequency of occurrence of leads as a function of width follows a logarithmic distribution. Reference SteffenSteffen (1987) found that fractures between 0.6 and 1.2 km wide comprised only 10% of all fractures greater than 50 m wide in a study of the Baffin Bay area. If the relationship between the distribution of large leads and that of smaller leads can be explicitly stated for different regions and seasons, the utility of a climatology of lead statistics based on the large leads detectable in AVHRR imagery will be enhanced.
Further complications are the uncertainty in what is the minimum lead width detectable in AVHRR IR or visible band data, in distinguishing the signatures of a narrow open lead and a wider frozen lead, and in how the signature of a lead varies with the orientation of the lead relative to the swath. Certainly leads which are narrower than the sensor resolution can be detected if the contrast between lead and ice is sufficient. In addition, the pattern of linearity in sub-resolution features enhances their detectability. Imagery from airborne sensors and higher resolution satellite imagery from Landsat, SPOT, or ERS-1 must supplement the AVHRR data set to provide data for understanding lead patterns at all scales. Modeling studies being carried out under the ARI address these questions.
Whether leads are characterized automatically or manually, the data set is a rich source for the type of study done by Reference Barry, Miles, Cianflone, Scharfen and SchnellBarry and others (1989), which relates lead patterns to atmospheric processes, or the work of Reference Marko and ThomsonMarko and Thomson (1977) and Reference ErlingssonErlingsson (1988), which offers theories for the deformation of ice based on fracture patterns observed in imagery. The large number of images covering vast sections of the Arctic (296 images were processed for 1989, and roughly half this number will be processed for each of the remaining four years) assures that regional and synoptic variability in large-scale lead patterns is recorded.
(a) A cloud-free subsection of an image just north of the Fram Strait from 2 December 1989. Leads are visible in the left half of the image; large floes and the ice edge in the right, (b) The same area about 24 hours later, (c) Ice motion vectors derived using an autocorrelation algorithm with the two image subsections as input.

Acknowledgments
Decisions concerning the data set were made through discussions with these members of the Arctic Leads ARI Remote Sensing Working Group: D. Eppler, J. Key, R. Lindsay, J. Maslanik, D. Rothrock, A. Schweiger, B. Walter and R. Weaver. Imagery was processed by B. Grant of Sverdrup Technology. C. Bertoia and G. Wohl of the Navy/NOAA Joint Ice Center provided essential image hardcopies. This project is supported by ONR under Program Element 61153N, Dr. Thomas Curtin, Program Manager.



