

The exponential growth of financial markets over the past several decades has generated broad scholarly and public interest in the phenomenon called “financialization.” In this article, financialization refers to “the increasing importance of financial actors, activities, and motives in the economy as opposed to industrial counterparts.” Throughout the article, I make distinctions between finance and financiers and industry and industrialists. The former denotes the profit-making activities and actors through the management of financial assets; the latter denotes the profit-making activities and actors involving the production or trade of commodities.Footnote 1 Despite a growing interest in financialization, analysts have yet to examine the role industrial firms played in the process. This article explores financialization in the wider context of industrial and socioeconomic shifts in the United States.
Specifically, this article examines how the restrictive postwar financial regime yielded to a new liberal one in late twentieth-century America. After World War II, the U.S. government was committed to providing a favorable economic environment for stable industrial growth. To this end, it not only endorsed regulations on international capital flows but also implemented substantial monetary interventions domestically, embracing a Keynesian approach. However, things changed drastically in the 1970s. The U.S. government began to advocate free movement of cross-border capital and denounced capital controls. It also shifted its monetary policy directions, adopting extreme austerity measures in the late 1970s, known as the “Volcker Shock.” These two shifts—the rise of international finance and U.S. monetary policy change—hastened the financialization of the U.S. economy by producing economic conditions conducive to financial expansion. Why did such policy changes happen in the 1970s?
This article focuses on leading American industrialists, demonstrating how their reactions to the economic turbulence of the 1970s facilitated financial regime changes. In the early postwar years, industrialists aligned with labor, offering support for restrictive financial policies to promote stable economic expansion. Conversely, financiers opposed the government’s heavy hand for fear of reduced business opportunities in the international markets and domestic inflationary pressures. However, industrialists changed their positions in the late 1960s and 1970s as they adopted new business strategies; namely, internationalization and flexible labor relations. Faced with declining profitability, large industrial corporations first accelerated foreign direct investment (FDI) in the late 1960s. As cross-border capital regulations impeded FDI, industrialists joined financiers in the fight for international capital mobility, adding pressure on the government to remove capital controls. In the early 1970s, the U.S. government abolished its capital controls and weakened international consensus on controls. Despite the successful efforts to promote overseas investment, U.S. firms continued to struggle in the 1970s, mainly due to powerful foreign competitors and increased economic volatility. The firms started to rethink the postwar capital–labor pact, concluding that the rigid industrial relations based on long-term, massive investment plans became a liability under the new environment of high competition and volatility. Finally, as American industrial leaders increased FDI and abandoned the capital–labor compromise in the 1970s, they withdrew their support of the Keynesian policies, advocating a classical austerity model by the late 1970s. Skyrocketing inflation threatened the dollar’s international reserve currency status, from which U.S.-based multinational corporations derived substantial competitive advantage. The firms hoped that austerity measures would save the dollar amid the currency crisis and undermine organized labor. Over the late 1970s and into the early 1980s, the entire U.S. business community—both industrialists and financiers—became strong backers of the Federal Reserve’s extreme contractionary policies.
The rise of global finance and domestic economic austerity catalyzed American financialization by directly benefiting U.S. financiers and creating propitious conditions for financial expansion in the economy. First, the liberalization of international finance augmented the centrality of Wall Street in the global markets, enriching and empowering American bankers. Also, austerity boosted financial profits by halting inflation. Second, given the increased mobility and volume of international finance, the austerity measures attracted a large amount of foreign capital into U.S. financial markets. The influx of capital was a great boon to the U.S. financial sector; it also made the U.S. economy prone to asset price bubbles.Footnote 2
This research complements existing studies by clarifying the distinctive role of industrial leaders in U.S. financialization and by offering detailed historical evidence. Ultimately, this study highlights the historical intersections of financialization and the disintegration of the New Deal regime in the United States. Recent studies of U.S. neoliberal revolution have emphasized the central role U.S. business played in the process. Kim Phillips-Fein documents how some business leaders who were outraged by Roosevelt’s New Deal struggled to fight back over several decades, culminating in Reagan’s victory.Footnote 3 Benjamin Waterhouse focuses on successful business mobilization of the 1970s, which catalyzed and shaped the “right turn” of the country.Footnote 4 Both studies effectively show how the perceived and real threats to business prerogatives during the 1930s and 1940s (Phillips-Fein) and the late 1960s and 1970s (Waterhouse) incited prominent business leaders and associations to build and expand a crusade to save America’s free enterprise system. My research similarly emphasizes business’s engagement in the transition of the postwar economic order, with a special focus on the financial pillars of the system. However, this article takes a slightly different approach, demonstrating how U.S. industrialists’ new business practices to tackle economic trouble of the late 1960s and 1970s led to changes in industrialists’ policy preferences. That is, in this article, the emphasis is on new business strategies, not on business’s crisis of confidence in the system. In addition, it shows how the unraveling of the postwar class-compromise and the industrialists’ disenchantment with interventionist financial policies created a new coalition between industrialists and financiers for financial reforms, laying the ground for financial expansion.
This article is organized as follows. I first survey the current financialization studies and discuss the contributions of this study to the literature. The following sections explore two key events in the 1970s that paved the way for the rise of finance in the United States: the resurgence of global finance, and the changes in domestic monetary policies. The final section discusses further implications and limitations of this study.
Financialization and Industrial Firms
Financialization studies have suggested industrial firms’ involvement in the rise of finance, yet they failed to specify the role firms played in the transition. Marxist theorists emphasized the deliberate actions of the capitalist class in financialization.Footnote 5 Giovanni Arrighi analyzes the recurrent cycles of accumulation in the capitalist world economy, which consists of two phases: material expansion and financial expansion. The material-expansion phase gives way to financial expansion when the returns from commodity production stagnate, prompting capitalists to shift their profit-making activities toward financial channels. Moreover, this change accelerates as the “blocs of governmental and business agencies” attempt to bring about system renewal in the face of a profitability crisis. For instance, Arrighi argues that U.S. capitalists successfully persuaded the government to create unprecedented economic austerity in the late 1970s, which catalyzed the financialization of the United States.Footnote 6 Gérard Duménil and Dominique Lévy also maintain that recent American financialization reflects capitalists’ victory in the class struggle. Marxist studies have overlooked the distinctive role of industrialists in financialization by analyzing the process at a high level of abstraction. Moreover, they do not provide empirical research on capitalist actions, instead simply “black-boxing” the process.Footnote 7 How was the collective action of the capitalist class possible? What did capitalists aim to achieve? My study seeks to fill this gap by carefully tracing U.S. business actors’ preferences toward particular financial policies over time. In line with the Marxist approach, I argue that business interests and their political actions mattered in the financial shift; yet, I focus on the internal cleavages within the business community in the early postwar years and subsequent convergence by the 1970s. Furthermore, this research stresses a fortuitous alliance between industrialists and financiers aimed at financial reforms. This was possible because the industrialists’ initiatives to rejuvenate industrial profits necessitated such changes.
Next, the literature on shareholderism places nonfinancial corporations in the center of the financialization analysis, examining how shareholder value has become a new paradigm for corporate behavior; “shareholder value” is the idea that maximizing the return to shareholders should be the primary goal of the firm.Footnote 8 The takeover boom, shareholder activism, and the reconceptualization of the firm from social institution to a nexus of contracts all affected the ascendance of shareholderism in the United States. In particular, shareholders in the 1980s and 1990s used sticks and carrots, from the threats of takeovers to the rewards of stock options, to induce managers to continually monitor a firm’s stock market performance. Corporate leaders first resisted but soon adjusted to the trend, starting to serve financial interests by boosting share prices and increasing dividend payments. This perspective effectively shows how financiers shaped the identity of the corporation, which, in turn, helped to fuel the financialization of the economy. However, it cannot (in fact, does not aim to) explain a few shifts critical to the rise of finance that occurred prior to the 1980s, such as the resurgence of global capital and U.S. monetary policy changes. Moreover, shareholderism studies characterize industrial leaders as passive reactors to financial shifts. Alternatively, my research demonstrates that industrialists actively engaged with financial changes in the 1970s, vigorously promoting global capital mobility and monetary changes. Furthermore, American industrialists contributed to the rise of finance without such “identity change”; that is, they promoted financial shifts not to maximize shareholder value but to help new business plans.
Greta Krippner enhances the understanding of U.S. financialization by providing a detailed historical account and elucidating the role of the state in it.Footnote 9 She claims that the U.S. government adopted “free market” policies to redress the domestic crisis of the 1970s, unintentionally generating macroeconomic environment favorable to financial growth. This article shares her enthusiasm for careful historical research; the difference is that it sheds light on the actors she largely omitted: business interests. By examining business activities, this article captures the transnational dimension of American financialization. Krippner recognizes the significance of the international financial development in explaining U.S. financialization, yet she treats the development as an exogenous shock. In contrast, I examine how leading U.S. firms and banks were heavily involved with the resurgence of global finance after WWII, which subsequently stimulated U.S. financial expansion. Also, I stress how special interests affected policy decisions. For instance, as to the 1979 Volcker Shock, I emphasize that the business community provided strong support for the Federal Reserve’s (Fed’s) extreme austerity measures during a severe recession, whereas Krippner focuses on why state actors chose the “monetarist” tactic to bring austerity to the economy.
The Resurgence of Global Finance
The Great Depression and World War II brought an end to a liberal international financial order that had flourished in the late nineteenth and early twentieth centuries. International capital flows virtually disappeared after the Great Depression. Moreover, during the postwar Bretton Woods negotiations, Harry Dexter White and John Maynard Keynes, the delegates from the United States and Britain, respectively, argued strongly that controls on cross-border capital movement were necessary to preserve a state’s policy autonomy.Footnote 10
The issue of capital controls elicited varying responses across the U.S. business community. Financiers, especially large New York City bankers, strongly opposed cross-border capital controls because they would impede lucrative international business opportunities. The bankers also claimed that free capital movement imposes discipline on governments to correct unsound domestic policies. Prominent Wall Street figures like Winthrop Aldrich tried to influence the administration’s policy position by publicizing their argument and using personal ties to the Fed and the State Department.Footnote 11 In particular, the American Bankers Association (ABA) was on the frontline of the fight, drafting an alternative plan for international monetary cooperation. The ABA, founded in 1875, is the largest financial trade organization in the United States, representing the commercial banking sector. Although its members formally included both small and large banks, managers of the big banks dominated its leadership, such as, during the mid-1940s, Randolph Burgess of National City Bank of New York. The ABA’s plan championed free capital movement along with other suggestions for the new international financial system, which drew wide attention from policy makers as well as the business community. Indeed, 1945 congressional hearings regarding the Bretton Woods agreements were centered on the question of whether or not the current government proposal should be revised reflecting the ABA plan.Footnote 12
Conversely, the U.S. industrial sector was generally positive toward the government initiative for the international monetary system, including the state’s right to impose capital controls. First, U.S. industrial leaders were eager to promote foreign trade and worried that free cross-border capital flows could easily destabilize currencies, undermining the revival of foreign trade, as happened during the interwar years.Footnote 13 Moreover, given other countries’ strong demand for capital controls, a blind pursuit of free capital movement could undermine the collective efforts to establish a stable international economic order. Furthermore, some industrial leaders were sympathetic to Keynesian ideas, acknowledging the need to prevent international capital flows from inhibiting a state’s policy choices to achieve certain domestic goals. The different views of financiers and industrialists regarding capital controls are effectively demonstrated in the internal conflicts of the National Foreign Trade Council (NFTC), an organization representing international business interests concerned with trade, FDI, and banking. In the mid-1940s, the NFTC was divided on whether the Bretton Woods agreements should be ratified as drafted or modified as proposed by the ABA. The proponents of the ABA plan insisted on the “removal of exchange controls as rapidly as practicable,” whereas others wanted a more “flexible” approach toward the controls. The latter maintained that the proposed changes were “unnecessary” and would “destroy the progress already made in international cooperation.” They also argued, “No nation can be expected to limit its freedom of action with respect to its domestic social or political policies.”Footnote 14 In the end, the bankers were defeated, and the NFTC decided to support the adoption of the Bretton Woods Agreements Act as drafted, defending it at 1945 congressional hearings.Footnote 15
Within the American business community, the Committee for Economic Development (CED) was at the forefront of defending the Bretton Woods proposals. The CED, since its inception in 1942, represented the “liberal wing of Big Business,” fostering moderate, flexible Keynesian perspectives. It came to prominence during the war because it helped economic planning to prevent a postwar recession. The CED boasted a long list of business and industrial celebrities on its board, which worked with renowned scholars in a joint effort of economic research and policy making.Footnote 16 As to the capital controls under the Bretton Woods system, the CED stated, “We do not wish to interfere with the just right of peoples to deal as may seem to them proper with their own internal problems.” It also said, “We must accept for some time as a condition of orderly currency relationships within the framework of long-term self-interest to ourselves and others, the continuance of methods of exchange control.”Footnote 17 Other major business associations such as the U.S. Chamber of Commerce were not enthusiastic about the government plan, yet endorsed it so as not to delay postwar international cooperation. The Chamber is an umbrella association representing businesses of all sizes and a variety of industries and sectors, including manufacturing, mining, transportation, retail, and services. Founded in 1912, it became “the most successful national association” during the Progressive Era, having more than 1,500 state and local organizations from across the country by 1929.Footnote 18 Compared with the CED, the Chamber spoke for the more traditional, conservative side of the business community, especially with regard to fiscal, welfare, and labor policies, although it moderated its positions to some extent after World War II. During the Bretton Woods negotiations, the Chamber focused on stability in currencies, especially because it believed such stability was decisive to the revival of world trade. Accordingly, the Chamber took an ambivalent attitude toward capital controls, recommending the “ultimate” removal of exchange controls, yet admitting to the need to regulate “abnormal” movement of capital that could destabilize currencies.Footnote 19 At congressional hearings, it sided with the government rather than the ABA, supporting the government proposal as it was without substantial revisions.
The final version of the U.S. proposal partially accommodated the financial sector’s demand by removing mandatory cooperative controls, but the basic faith in capital control did not waver. The 1945 Articles of Agreement explicitly legitimized the right of states to control international capital movement. With a commitment to rebuild stable domestic and international economies, virtually all countries, including the United States, occasionally adopted capital controls in postwar years.
The Development of Euromarkets
Discouraged by war and controls, international capital movement remained very limited, apart from intergovernmental capital flows such as those created by the Marshall Plan in the early postwar years.Footnote 20 However, by the late 1950s, international private financial markets appeared, primarily in London, in the form of the Euromarket.Footnote 21 Euromarkets are where foreign currency is held and traded. For example, an exporter can deposit dollar earnings from trading with the United States at a bank outside the United States (Eurodollar); a U.S. company can issue and trade dollar-denominated bonds outside the United States (Eurobonds). Initially, Eurodollar markets emerged as the central banks of Europe, South-East Asia, and oil-producing countries in the Near East provided their excess dollars to other central banks. The Euromarket steadily grew throughout the late 1950s and early 1960s as the return to convertibility and the relaxation of exchange controls in Europe accelerated foreign trade and investment. In particular, large U.S. corporations aggressively expanded their operations in Western Europe to take advantage of the postwar boom.Footnote 22 Their foreign subsidiaries used Euromarkets as a place to keep retained earnings and to finance overseas operations.Footnote 23 Subsequently, U.S. banks followed their most important industrial customers, establishing physical facilities overseas in order to keep their business competitive with the host-country banks.Footnote 24 Accordingly, by the early 1960s, private firms and banks replaced central banks as the major players in the Euromarket. In its 1964 Quarterly Bulletin, the Bank of England reported that the primary source of funds in the Euromarket changed from the Deutsche Bundesbank, the Banca d’Italia, and the Swiss National Bank to commercial banks and companies, concluding, “It is safe to say that business concerns have been becoming more important.” It also emphasized that U.S. companies, both resident and subsidiaries abroad, were increasingly placing funds in the Euromarket.Footnote 25 Moreover, internationally oriented corporations grew into the dominant demanders of the fund in Euromarkets, along with various government entities that used Euromarkets for deficit financing.Footnote 26
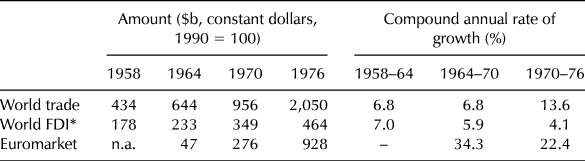
Further transformations of the Euromarket occurred during the mid-1960s and early 1970s. Euromarkets grew very rapidly, between 20 and 50 percent every year, which well exceeded the growth of world trade and investment (Table 1). This discrepancy between the growth rates of the Euromarkets and those of trade and investment implies that the development of Euromarkets cannot be solely attributed to the expansion of the world economy. Also, with the explosive expansion of medium- and long-term Euromarkets—Eurobond and Eurocredit—the Euromarket turned from a short-term money market into a capital market. These dramatic changes were largely affected by the particular characteristics of U.S. capital controls and the subsequent changes in the financing practices of U.S. firms and banks.Footnote 27
Trade, FDI, and Euromarkets, 1958–1976

Note: * World FDI represents the sum of the outward FDI stock of four countries: United States, Britain, Germany, and Japan. Figures are from 1960, 1964, 1971, and 1978, respectively.
Sources: United Nations Conference on Trade and Development, “Values and Shares”; United Nations, Multinational Corporations; United Nations Centre on Transnational Corporations, Salient Features; Bank for International Settlement, Annual Report, 1969, 1974; Johnston, Economics, 38–39; Mendelsohn, Money on the Move, 67, 211.
The “dollar shortage” of the immediate postwar years turned into a “dollar glut” by the late 1950s as the United States accumulated external deficits. In the 1960s, the U.S. government undertook initiatives to curtail dollar outflows in order to ameliorate the balance-of-payments problem. In 1961 the Kennedy administration tried but failed to increase taxation on FDI because of the strong opposition from U.S.-based multinational corporations.Footnote 28 Deterred by resistance from leading industrialists, the administration switched the target. In 1963 the Interest Equalization Tax (IET), the first peacetime capital control program, was imposed on foreign securities sold in U.S. markets, damaging the securities industry. The tax also applied to dollar transactions abroad (Eurodollar) by U.S. banks’ foreign subsidiaries. Nevertheless, the international payment situation deteriorated, particularly due to Vietnam War-related expenditures, inducing the Johnson administration to take drastic actions. In 1965 the administration issued “voluntary” capital control guidelines for commercial banks and industrial firms to limit foreign loans and new FDI. The Fed reluctantly assumed the supervising job over the banks; the Commerce secretary established a Balance of Payments Advisory Committee, consisting of business leaders from the largest multinational corporations, to oversee FDI regulation.Footnote 29 To lessen business opposition, the government made a crucial concession in the controls—it allowed firms and banks to fund international business in overseas financial markets, including the Eurodollar market.Footnote 30 That is, U.S. firms could continue expanding FDI by getting loans or issuing bonds in international markets; banks could also simply shift their lending activities to foreign branches, thus bypassing the controls. The concession was a significant change considering that the IET of 1963 applied to Eurodollars. The Eurodollars were finally exempted from the tax program in 1967 only after banks persuaded the government that such exemption was necessary to meet the increasing financial needs of U.S. firms abroad since the imposition of 1965 voluntary controls.
In 1968 the Johnson administration tightened the controls further. On New Year’s Day 1968, Johnson issued an executive order that replaced voluntary controls on FDI with mandatory controls. The Fed also instituted new restrictions and strengthened old ones. Nevertheless, the administration preserved the exemption of Eurodollar transactions from U.S. capital controls.
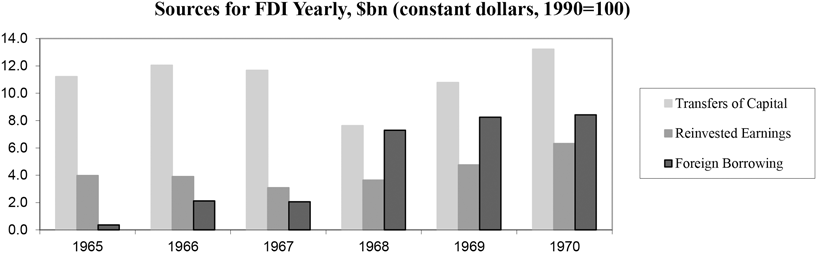
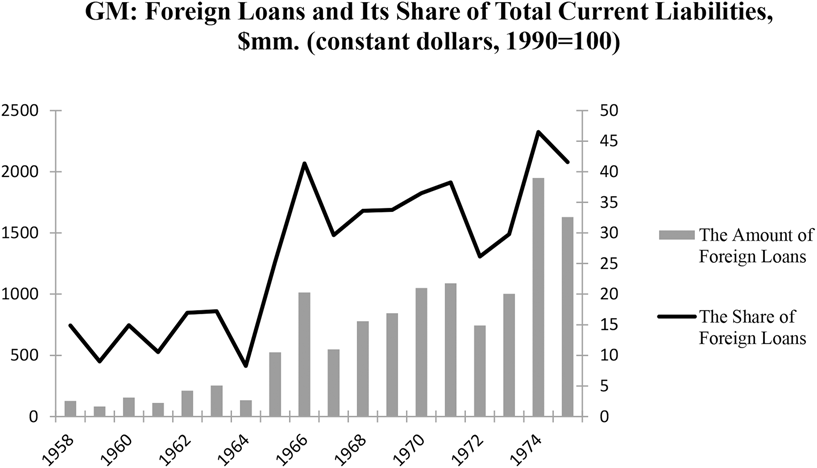
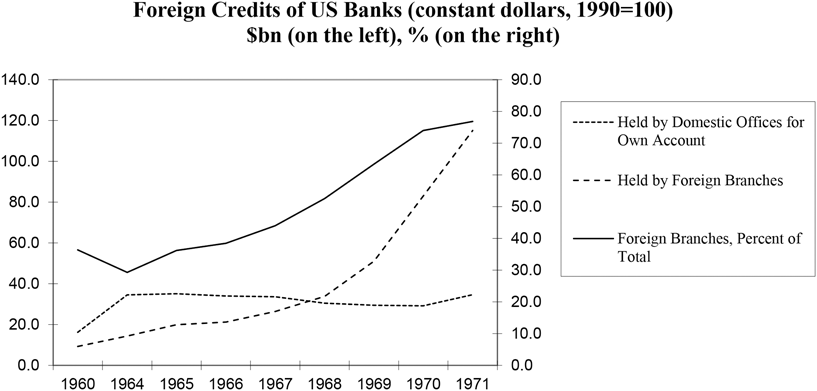
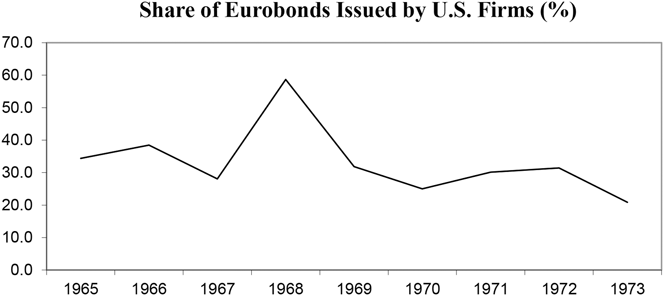
The imposition of capital controls with a special exemption beginning in 1965 induced U.S. firms and banks to dramatically increase the use of the Euromarket as an alternative source of funds. On the National Industrial Conference Board’s (NICB) quarterly surveys on international business in 1968 and 1969, a large number of corporate executives reported that capital controls on FDI pushed their firms to borrow heavily abroad.Footnote 31 Indeed, the Commerce Department’s study on FDI showed that the share of foreign borrowing jumped from 2 percent in 1965 to more than 30 percent of the total sources of FDI in the late 1960s and into 1970 (Figure 1). For instance, foreign subsidiaries of General Motors (GM) increased the share of foreign loans up to 40 percent in the late 1960s (Figure 2). Similarly, U.S. banks began to depend substantially on offshore subsidiaries for foreign lending activities (Figure 3). They also opened new branches abroad to serve their customers, multinational corporations in particular.Footnote 32 For example, Chase Manhattan Bank, Provident National bank of Philadelphia, and Pittsburgh National Bank each opened branches abroad in 1968 to specialize in Euromarket loans to corporate borrowers.Footnote 33 As a result, U.S. firms and banks accelerated the expansion of Euromarkets in the late 1960s and early 1970s. Large U.S. firms became the largest issuers of the Eurobonds in 1968 (Figure 4). U.S. bank subsidiaries also dominated 45 percent of the foreign bank deposits in Britain in 1969, a striking increase from 15 percent in 1962.Footnote 34 With the massive influx of U.S. firms and banks into the market, the Euromarket experienced explosive growth (see Table 1).
Sources for FDI yearly, $bn (constant dollars, 1990=100).
Source: U.S. Department of Commerce, Foreign Direct Investment Program, 1972 and 1974.

GM foreign loans and shares of total current liabilities, $mm (constant dollars, 1990=100).
Source: General Motors, Annual Report, various years.

Foreign credits of US Banks (constant dollars, 1990=100).
Note: $bn on the left; % on the right.
Source: Brimmer, “Commercial Bank.”

Share of Eurobonds issued by U.S. companies. (%)
Source: World Financial Markets, various years (journal of the Morgan Guaranty Trust Company of New York).

Helleiner argues that the U.S. government exempted Euromarkets from the controls because of the administrators’ plans to improve the balance-of-payments situation by encouraging foreigners to hold onto dollars. He points to the fact that Treasury Secretary Dillon espoused this idea in the early 1960s. Dillon’s idea, however, was not converted into policy. Although the IET was created during his incumbency, it did not exempt Eurodollars. In fact, in the 1960s, U.S. government officials were divided on whether Euromarkets exacerbated the payments problem by attracting the dollar flows out of the United States or improved the situation by providing investors with incentives to invest in the dollars. Also, a closer look at the Foreign Relations of the United States, a comprehensive government document on international monetary and trade policy, reveals that the U.S. government did not consider the expansion of Euromarkets to be a direct means to redress the payments problem, while they carefully examined other initiatives such as capital controls, export subsidies, tourist taxes, and so on. The Euromarket was discussed only as a concession to the business community with respect to capital controls.Footnote 35
The development of Euromarkets signified the resurgence of global private finance, which had been devastated by the Great Depression and World War II. The rapid expansion of international finance destabilized the Bretton Woods system in the late 1960s. At the same time, another threat to the restrictive postwar financial system was looming due to discontent with capital controls.
Large U.S. Industrial Corporations and New International Financial Order
Although the Euromarkets offered breathing space, U.S. industrial leaders became increasingly agitated about capital controls because the controls impeded their efforts to expand overseas operations. Throughout the 1960s, large U.S. industrial corporations vigorously increased FDI, especially in the manufacturing sector and petroleum industry. The ratio of foreign to domestic manufacturing investment by U.S. corporations exceeded 0.2 by the mid-1960s and reached 0.3 by the early 1970s.Footnote 36 By 1970 the sales revenues of U.S. firms’ foreign subsidiaries and affiliates reached around $200 billion a year, equivalent to 20 percent of U.S. domestic production and more than five times the amount of U.S. exports.Footnote 37 In particular, large corporations were the obvious leaders in FDI; 3,400 firms were making direct investments of more than $100,000 per year, and 700 of the largest companies accounted for about 90 percent of all FDI outflows between 1965 and 1967.Footnote 38 Consequently, the imposition of capital controls provoked sharp criticism from the business community. As early as 1965, the International Economic Policy Association (IEPA), the advocate of the largest U.S.-based transnational firms, publicly opposed the controls at congressional hearings. Footnote 39 The NFTC followed suit in 1966.Footnote 40
The tightening of controls in 1968 incited wider opposition. The U.S. Chamber of Commerce and the National Association of Manufacturers (NAM), which were relatively quiet on the issue in the mid-1960s, now joined the attempts to thwart capital controls.Footnote 41 Although the two organizations drew the bulk of their membership from small firms and showed concern for firms of all sizes, their board members often came from large companies, often advocating the demands of big business.Footnote 42 In particular, the nation’s largest corporations dominated internal committees on international issues. For instance, the Chamber’s Special Advisory Panel on Balance of Payments consisted of corporations such as General Electric and Standard Oil. Moreover, the leadership of the Chamber and NAM made efforts to mobilize their members to support international enterprises in the late 1960s and early 1970s.Footnote 43 By the late 1960s, all major business associations such as the CED, Chamber, and NAM and individual corporations flooded congressional hearings to oppose capital controls.Footnote 44 At congressional hearings on the topic of foreign economic policy, John J. Powers, president of Chas. Pfizer & Co., who introduced himself as representing the views of the international manufacturing business, strongly denounced capital controls as damaging to the competitiveness of American firms.Footnote 45 In 1969 the House Committee on Foreign Affairs even announced resolutions calling for the president to terminate capital controls.Footnote 46 The industrialists finally joined the financial community, frequently represented by the ABA and the Investment Bankers Association, which had consistently fought against controls since the imposition of IET.Footnote 47
The U.S. business community then took matters one step further. By the late 1960s, it started to question the efficacy of the postwar international financial regime. Although it did not have a concrete idea about international regime change, industrial leaders emphasized the importance of international capital mobility. In 1968 the NAM stated that the international financial system should “facilitate the flow of investment, goods and people, not to impede it.”Footnote 48 Furthermore, a small number of astute firms actively engaged in the early efforts to shape a new monetary system. When prestigious international scholars and business representatives gathered for a 1969 conference to discuss the pros and cons of fixed versus floating exchange-rate systems, David Grove, chief economist at IBM, and John Watts, a top executive at Brown Brothers Harriman and Co., argued for greater flexibility on the premise that a more flexible regime would provide a better adjustment process, thereby obviating the need for capital controls.Footnote 49
In 1971 the Bretton Woods system finally collapsed.Footnote 50 Despite its efforts to redress the balance of payments situation, the United States continued to accumulate enormous debt from international and domestic commitments, such as the Vietnam War and welfare programs. Between the late 1960s and early 1970s, a large scale of short-term financial flows speculated against overvalued currencies, exacerbating the systemic crisis. Facing a potential run on gold, the United States closed the gold window in August 1971. In July 1972, the governors of the International Monetary Fund (IMF) set up the Committee on Reform of the IMF and Related Issues (The Committee of Twenty) to draft proposals for international monetary reform. One of the Committee of Twenty’s main agendas was the issue of international capital movement because speculative capital flows hastened the fall of the Bretton Woods system. After investigating the causes of the short-term capital flows of the late 1960s and early 1970s, the Committee of Twenty concluded that multinational firms and banks were responsible. In particular, the multinational firms were the main culprits. Their practices of “leads and lags,” the deviations from the usual timing of commercial payments and receipts, generated a substantial amount of destabilizing short-term flows.Footnote 51 The volume of international trade and payments was so large that the slightest change in the timing of payments resulted in enormous movements of capital. To handle the short-term capital flows, Europe and Japan suggested that the provisions on capital controls be strengthened. As speculative capital flows rapidly expanded and technological development made it easier to evade controls, conventional techniques such as unilateral capital controls and offsetting financing proved obsolete. Instead, European officials argued, countries should coordinate their capital control policies regarding foreign currency banking so that they could limit the amount of capital flows those foreign markets could finance.Footnote 52
The problem of international capital flows was also widely examined in the United States. Major news media outlets extensively discussed whether U.S.-based multinational firms and banks were responsible for the currency crises in the late 1960s and early 1970s.Footnote 53 The U.S. business community ardently defended itself against the charges of currency speculation, claiming that its management of foreign currencies was not speculative so much as “defensive” to protect the value of international investments.Footnote 54 In addition, facing efforts to toughen international provisions on capital controls, the U.S. business community hurriedly organized task forces to scrutinize reform of the international monetary regime. The CED placed the “reform of the international monetary system” high on its agenda for 1972 and published the outcome of that work as a statement entitled “Strengthening the World Monetary System” in 1973.Footnote 55 In it, the CED recommended that under the new international system, “every effort should be made to reduce or eliminate” restrictions on trade and capital transactions.Footnote 56 Considering that the CED was sympathetic to the capital controls instituted under Bretton Woods, this statement demonstrated a substantial change in its position. Similarly, the NAM formed a high-level Monetary Reform Task Force in 1972, and contended that the new monetary regime should discourage any governmental action to control cross-border capital flows.Footnote 57
The position of the U.S. government toward international capital movements was similar to that of the business community. In early 1972, the Wall Street Journal reported that the multinationals found “potent new friends in the White House,” which was finishing a comprehensive study on MNCs.Footnote 58 As the Journal expected, the study defended the firms, declaring that “destructive, predatory motivations do not characterize the sophisticated international financial activities of most MNCs, even though much of the funds which flow internationally during the crisis doubtlessly is of MNC origin.”Footnote 59 On the question of capital controls, the United States disagreed with other countries’ suggestions to impose “comprehensive restrictions” on international capital movement. Instead, through Treasury Secretary George Shultz’s speech at IMF’s 1972 annual meeting and Nixon’s Economic Report in early 1973, the U.S. government proclaimed that controls on capital transactions “should not be encouraged and certainly should not be required.”Footnote 60 This statement represented a significant shift in the American attitude toward capital controls, considering that the U.S. government had recommended mandatory cooperation with controls during the Bretton Woods negotiations. Subsequently, the United States abolished its own control programs in 1974. Regarding the United States’ enthusiasm for free capital movement, scholars have emphasized the government’s new international monetary strategy, the Republican administration, and the influx of neoliberal economists into the government.Footnote 61 These factors were no doubt important, yet business mobilization also played a crucial role. Indeed, Paul Volcker, Under Secretary of the Treasury for International Monetary Affairs, from 1969 to 1974, recalls that one “pressing” reason for the removal of controls was business demands.Footnote 62
The United States’ strong support for free capital movement in the early 1970s signified a turning point in the globalization of finance. First, the United States shaped the basic tone of post-Bretton Woods framework regarding international capital mobility by successfully blocking European and Japanese initiatives to strengthen cross-border capital controls by weakening provisions on controls. The Committee of Twenty’s Final Report of 1974 allowed for, but did not oblige, cooperative controls among the countries. Furthermore, it called for strict discipline; for instance, capital controls to sustain inappropriate exchange rates, which had been widely used under the Bretton Woods system, were forbidden.Footnote 63 The basic tenet of the new regime differed greatly from that of the old, when capital controls were considered both “inevitable and indeed desirable.”Footnote 64 Second, given the fast-growing international capital markets, innovative techniques to avoid controls, and the United States’ support of cross-border capital mobility, other countries soon realized that unilateral capital controls were largely ineffective; moreover, the economic and political costs related to capital controls grew enormously in the increasingly open economy. Europeans and Japanese abolished their controls throughout the 1980s and 1990s.Footnote 65
The resurgence of global finance, in turn, catalyzed U.S. financialization. First, as the world’s leading bankers, U.S. financiers benefitted tremendously from the business opportunities that liberalized international financial markets provided. International investors were attracted to the U.S. financial market due to its unrivaled size and liquidity, as well as the dollar’s special role in the world economy.Footnote 66 Second, with increased mobility, international finance gained the ability to potentially inundate or dry national financial markets. As discussed in the following section, the austerity measures of the 1970s attracted large amount of foreign capital into the United State, expanding its financial markets. Finally, increased capital movement, combined with floating exchange rates, raised economic uncertainty and promoted financial speculation.Footnote 67
The Change in U.S. Monetary Policy
The Great Depression and World War II brought changes to the domestic economic order, too. The “laissez-faire” doctrine yielded to the idea of an interventionist state. The U.S. government increasingly committed itself to the goals of economic growth and full employment, which were to be achieved by active fiscal and monetary policies. As early as 1937, President Roosevelt endorsed deficit spending to stabilize the economy.Footnote 68 The postwar administrations also undertook substantial monetary interventions, maintaining interest rates at an artificially low level in order to support the growth agenda.Footnote 69
The establishment of a Keynesian regime was initially challenged, but was generally accepted by the U.S. business community by the late 1940s, particularly among the large industrial firms.Footnote 70 The CED rejected the doctrine of annually balanced budgets, espousing active counter-cyclical measures to moderate economic fluctuations.Footnote 71 Even the conservative U.S. Chamber of Commerce agreed: “We do not question that compensatory fiscal policy may provide at times a useful, and even necessary measure of contracyclical action. The day has passed when [the] government can deal with depression simply by whistling or wringing its hands, and this device should be included in the armory of weapons it can deploy.”Footnote 72 In turn, the country’s new orientation toward economic growth helped big business and organized labor to develop collaborative industrial relations. An exemplary case of this exists between GM and the United Auto Workers (UAW). GM undertook massive expansion programs to exploit the booming car market after the war. To ensure stability in the investment, GM forged the first multiyear union contract with the UAW in 1948, providing workers with higher pay and better benefits.Footnote 73
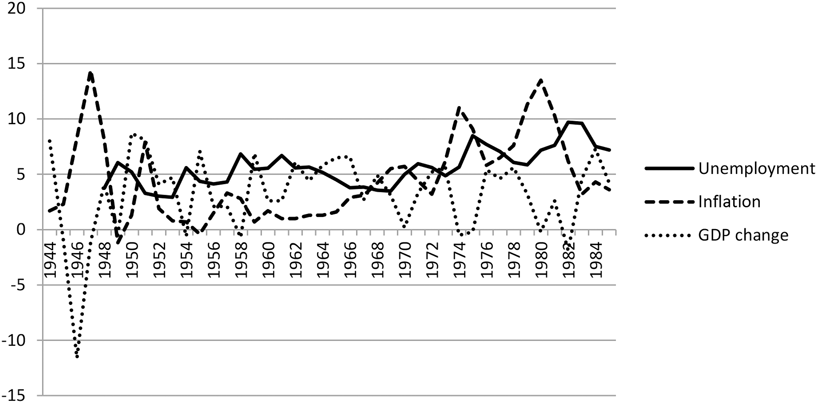
However, not everyone in the business community was happy with the growth agenda. The financial sector constantly cautioned that overly stimulative measures could lead to inflation, the Number 1 enemy of financial asset holders.Footnote 74 The debate surrounding volatile economic situations in the late 1940s effectively demonstrates the different views between industry and finance toward macroeconomic policy (Figure 5). Experiencing severe recession and inflation, U.S. business was divided on the causes of and solutions for inflation. At 1946 congressional hearings, Henry Ford II, of Ford Motors, identified “scarcity” as the cause of inflation, claiming: “The way to prevent inflation is to produce goods for people.”Footnote 75 Ralph Flanders, of the CED, also bolstered the collaborative efforts of “management, labor and government to increase productivity.”Footnote 76 The NAM, despite having been a virulent critic of an interventionist government throughout the Progressive Era and New Deal years, put more emphasis on production than on a tight budget.Footnote 77 The banking community took a different approach. Representing the Committee on Public Debt Policy, Randolph Burgess, vice chairman of the National City Bank of New York, urged taking control of the government budget and debt to curb inflation. The committee comprised eight bankers, three academics, and one industrial leader; the eight bankers came from diverse backgrounds, ranging from large commercial banks, to savings banks, and to insurance companies.Footnote 78
U.S. macroeconomic changes, 1944–1985.
Source: U.S. Department of Commerce, Bureau of Economic Analysis, Gross Domestic Product; U.S. Department of Labor, Bureau of Labor Statistics, Consumer Price Index; U.S. Department of Labor, Bureau of Labor Statistics, Unemployment Rate.

The Beginning of Stagflation: Late 1960s–Early 1970s
The postwar Golden Age of capitalism started to falter by the late 1960s. The U.S. government’s heavy domestic and international spending brought inflationary pressures to the economy and destabilized the international monetary system. Facing the overheating of the economy and the balance of payments crisis, the business community demanded an economic cooling. However, as the economy began a downturn in the early 1970s, industry and finance took distinct paths.
The U.S. financial community attributed disturbing economic conditions in the late 1960s to Keynesian policies. The ABA bolstered the “classical remedies” of the state-initiated recession to solve the international imbalances. Under the traditional gold standard system, countries with substantial deficits were pressured to deflate the economy, dampening the demand for imports while improving export competitiveness. The ABA contended that the increase in unemployment, the “obvious costs” of the austerity measures, should not prevent the use of such measures.Footnote 79 The industrial sector also demanded tight budgets and a decrease in the money supply, although it also cautioned against economic stagnation. The U.S. Chamber of Commerce asked the administration “to fight inflation persistently, but not so drastically as to raise the overall unemployment.”Footnote 80 Moreover, industrialists recommended curtailing external debt primarily by reducing international engagements such as foreign aid and NATO commitments rather than contracting the domestic economy.Footnote 81
With the economic slowdown of 1970–1971, the attitudes of financiers and industrialists diverged. Despite economic stagnation, financiers continued to uphold strong contractionary policies against the administration’s plan to ease fiscal and monetary restraints. For instance, Donald Regan, president of Merrill Lynch, Pierce, Fenner, & Smith, testified before Congress that eighteen months of restraint “has brought with it no small degree of hardship. … I am afraid, however, that we shall have to sustain that hardship for a while longer.”Footnote 82 Similar testimonies were made by numerous representatives of various financial institutions and associations, encompassing investment banking, commercial banking, and the insurance industry, such as Salomon Bros & Hutzler, the Bank of America, the ABA, the National Association of Mutual Savings Banks, and the Life Insurance Association of America.Footnote 83 Conversely, industrialists called for the resumption of economic growth. Frank Murphy, of General Electric (GE), strongly criticized that “overly restrictive credit and fiscal policies have remained in place too long.”Footnote 84 The CED, Chamber, and NAM also called for a substantial easing of the austerity measures of 1968–1969.Footnote 85 Organized labor urged the government to adopt expansionary policies to trigger economic growth.Footnote 86 The Nixon administration promptly responded to signs of an economic downturn and the demands of industry and labor by adopting expansionary fiscal and monetary policies in 1971 and 1972.
American Industrialists’ New Business Strategies and New Policy Positions
By the mid-1970s, large U.S. industrial corporations started to withdraw their support of the postwar growth regime and push for austerity. The firms’ changed positions toward macroeconomic policies reflected their new strategies to restore industrial profits.
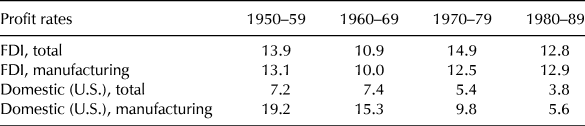
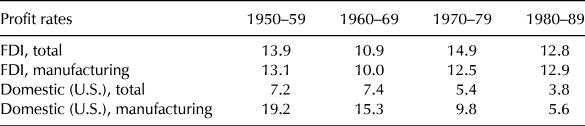
As U.S. private sector profitability, particularly in manufacturing, fell sharply in the 1970s, firms tried to overcome the difficulties by accelerating overseas production and abandoning the postwar capital–labor pact. First, large U.S. firms increased their reliance on FDI. For instance, IBM derived 30 percent of its income from FDI in 1965, and 49 percent in 1974; Ford derived 12 percent from FDI in 1965, and 49 percent in 1974.Footnote 87 In fact, the profitability of manufacturing FDI finally surpassed that of domestic manufacturing production in the 1970s (Table 2). Even the companies that had served foreign customers primarily through exports showed greater interest in FDI by the late 1970s. For example, GE substituted FDI for exports because of foreign trade barriers and high domestic labor costs.Footnote 88
Domestic and overseas profit rates, percent
Source: Ceyhun, “Multinational Corporations,” 57.
Industrial firms’ increasing involvement in international business, especially in FDI, made them sensitive to the dollar crisis. These firms had benefitted from the dollar’s special role in international business because they had easy access to the international reserve currency; moreover, strong dollars allowed them to purchase foreign materials and labor cheaply.Footnote 89 As the dollar received massive speculative attacks in the late 1970s, these firms began to demand that the government keep the dollar stable and strong.Footnote 90 For instance, GE reacted differently to the dollar crisis of the late 1970s than that of the late 1960s, as it had shifted its international strategies from exports in the 1960s to FDI in the 1970s. At NAM’s 1968 meeting, GE opposed urgent actions to support the dollar, instead defending the government’s expansionary policies.Footnote 91 However, by the late 1970s, Reginald Jones, chairman and CEO of GE, urged President Carter to adopt a series of policies “aimed at shoring up the sagging value of the dollar in international markets.”Footnote 92 Similarly, Ford Motor valued the dollar’s stability more than export competitiveness by the late 1970s. At 1978 congressional hearings, Senator Javits observed, “You would rather have a stable dollar with a lessening of inflation … even though this particular fall in the dollar has helped your competitive situation.” John Deaver, representing Ford, answered, “That is correct.”Footnote 93 Ford executives supported Carter’s programs to “bolster the value of the dollar.”Footnote 94
Second, industrialists deserted the postwar capital–labor pact. The internationalization strategy helped U.S. firms to restore profits to some extent; yet, it did not entirely solve the problem of intensifying foreign competition. Moreover, growing cross-border capital movement created an unforeseen problem: increased economic volatility. These problems induced U.S. industrialists to reassess labor relations. In the early postwar years, the firms needed multiyear contracts with unions to ensure stability in long-term, massive investments; they could also afford generous pay and benefits, simply passing higher labor costs to customers. However, the situation had changed. The U.S. industrialists now had to compete with fast-growing foreign manufacturers from Germany and Japan, where labor costs were only 60 percent and 25 percent, respectively, of that in the United States by 1970.Footnote 95 Also, the increased economic volatility of the 1970s led firms to pursue flexibility in the production process and labor markets.Footnote 96 As a result, the postwar class compromise was abandoned. Employers increasingly denied workers’ petitions for union representation and illegally fired workers for union activities in the 1970s.Footnote 97 Even large industrial corporations, the exemplars of collaborative industrial relations, joined the movement. GM expanded its factories into regions where both organized labor support and wages were low.Footnote 98 In 1976, UAW Vice President Irving Bluestone criticized GM’s new national contract as “the harshest” proposal he had seen in more than a quarter-century.Footnote 99 U.S. industrialists also defeated a labor reform bill in 1977, which would have facilitated unionization. The Business Roundtable, which consisted of the CEOs of the largest corporations, had previously taken a relatively conciliatory stance toward organized labor. Now, it joined more conservative groups such as the Chamber and NAM, effectively killing the labor reform bill.Footnote 100
The souring relationship between big business and organized labor prevented their cooperation in anti-inflation efforts. As the Ford and Carter administrations struggled to avoid the two extreme choices of economic austerity and mandatory price controls, the former being the first choice of financiers and the latter the first choice of organized labor, they tried to persuade capital and labor to voluntarily cooperate in limiting price increases. However, the “voluntary” solution was doomed to fail. Not only did U.S. business organizations lack the ability to convince their members to resist price increases but also business and organized labor were antagonistic toward each other. For example, even though the Business Roundtable promised to support Carter’s voluntary control programs in 1978, Irving Shapiro, the CEO of DuPont and a leading member of the Roundtable, said that his company would raise prices if necessary.101Also, ongoing capital–labor relations during the 1970s did not allow for voluntary cooperation. After the bitter defeat in labor law reform fights, UAW President Douglas Fraser resigned from a labor–management committee Carter had created to encourage cooperation in inflation and major economic issues, in a show of “disappointment with the Carter Administration and anger at the business community.”Footnote 102 Waterhouse compares the United States with Germany, noting that “institutionalized corporatism” promoted cooperation between capital and labor in Germany in anti-inflation efforts, while the absence of corporatism prevented coordination in the United States.Footnote 103
Finally, by the mid-1970s, some U.S. industrial firms started to embrace the “classical remedy” for the inflation problem: austerity. Keynesian macroeconomic policies became less effective in the increasingly globalized world economy. Moreover, expansionary measures would empower labor by lowering unemployment, which was exactly what industrialists wanted to avoid in the 1970s. In a period of heightened international competition and volatility, rigid labor relations became a liability; also, the firms could no longer afford the high price of labor. Conversely, austerity would generate a sharp recession in the economy, weakening organized labor as well as bringing down labor costs.
Continuing Stagflation and the Beginning of a New Coalition: Mid-1970s
During the severe recession of 1974–1975, some industrial leaders started to break away from the postwar growth alliance with organized labor, while others remained loyal. On the one hand, influential industrialists such as Henry Ford II, Reginald Jones, and David Grove advocated expansionary fiscal and monetary policies, welcoming Carter’s stimulus package. Henry Ford II pleaded in front of Congress in 1975: “We must not be so frightened by the perils of inflation that we do too little too late to restore economic growth.”Footnote 104 The CED also demanded “clearly stimulative” monetary and fiscal policies.Footnote 105 In a similar vein, the Business Roundtable and leading manufacturers, including U.S. Steel and Westinghouse, emphasized productivity to control inflation.Footnote 106
On the other hand, the Chamber and NAM were more cautious. For example, in 1975, the Chamber claimed that both “recession and inflation” were centural problems, and vacillated between stimulative and contractionary measures.Footnote 107 Heath Larry, chairman of the Board of Directors of NAM, stated to the press in 1977: “The NAM pledges its support to the new Administration in any reasonable efforts to deal with the twin problems of a sluggish economy and unemployment. But we would, however, express strong reservations about any significant reliance upon either forced stimulation of aggregate demand.”Footnote 108 At the other end of the spectrum were financiers and internationally oriented industrialists who vociferously argued that the nation would have to bear the costs of the recession to fight inflation effectively. The ABA, along with leading investment banks such as Merrill Lynch and Salomon Bros., opposed Carter’s stimulus programs.Footnote 109 The NFTC recommended that the United States avoid high inflation because the government had a “special responsibility” to uphold a strong dollar in the current international monetary system.Footnote 110
U.S. Business Community and the Volcker Shock: Late 1970s–Early 1980s
The economy quickly recovered from the 1974–1975 recession, but inflation rose from 5.8 percent in 1976, to 6.5 percent in 1977, and to 7.6 percent in 1978, while the unemployment rate dropped below 6 percent by 1978. U.S. businesses then started to call for macroeconomic policy restraint. In the late 1970s, both financiers and industrialists openly insisted that the nation should endure the pain of economic recession in order to bring prices down.
By 1978 the U.S. business community turned away from expansionary policies and toward intense and radial austerity. At 1978 congressional hearings on the topic of the world economy, Walter Wriston, chairman of Citicorp, argued that the international economic instability stemmed from the U.S. government’s stimulative monetary policies. He further insisted, “We must stop pretending that it is possible to fine tune our economy.” Instead, he advocated for a “fundamental turn” in national policy away from pursuing higher growth.Footnote 111 The industrialists agreed with the financiers. In April 1978 Thomas Murphy, chairman of GM, maintained that the inflation problem could “only be resolved” by fiscal and monetary restraints.Footnote 112 NAM’s Board of Directors unanimously adopted the “statement on inflation” in October 1978, which requested the government’s “unqualified commitment” to tighten budgets and money supply.Footnote 113 Compared to this radical position, the Chamber’s response was moderate. While it also demanded an “all-out effort” from the administration to curb inflation, it also cautioned about the likelihood of a recession.Footnote 114 Conversely, organized labor asked Carter to use mandatory price controls instead of unemployment to end inflation.Footnote 115 By late 1978, the Carter administration deserted its failed approach to inflation, a simple persuasion to moderate prices and wages, announcing in its place a series of anti-inflation programs. The administration proposed tougher fiscal and monetary restraints; it also introduced formal wage and price guidelines with specific quantitative constraints. Nevertheless, these policies did not stabilize the economy.
Stagflation reached its climax in 1979. The inflation rate rose above 10 percent while the economy grew by less than 1 percent in the first half of 1979. Moreover, economic forecasts pointed toward an oncoming recession and an even higher inflation rate. During congressional hearings in 1979, prominent economists clashed over the direction of national economic policy. For instance, in February 1979, Martin Feldstein, of Harvard University, demanded more economic slack to reduce inflation. Lester Thurow, of MIT, conversely, worried that recent monetary and fiscal measures were “completely inappropriate” and would only deepen the recession.Footnote 116 Major media outlets also had different views. While the Wall Street Journal castigated Fed Chair Miller for being soft on inflation, the New York Times saw the nation as facing a recession as well as inflation.Footnote 117 Similarly, the public was split on how to tackle stagflation. Although Americans demanded strong anti-inflation measures, they did not want to curb inflation by causing severe recession. About half of the public was still open to wage and price controls, particularly Democratic voters.Footnote 118
Unlike the academics, media, and general public, U.S. industry and finance leaders agreed that ending inflation was best served by engineering a recession. This time, industrialists stuck to their demands for austerity despite the onset of a recession. In March 1979, the NAM said, “The war against inflation will truly be a test of the nation’s moral fiber. Are we fully prepared to meet that test—or are we proceeding on the assumption that a war against inflation can be a war without casualties?” It repeated the same argument in its multiple publications.Footnote 119 U.S. Chamber of Commerce chairman Shearon Harris also emphasized that the “acid test” for the nation’s anti-inflation policy would be “what actions are taken if the U.S. slips into a recession.”Footnote 120 The NYC Chamber of Commerce claimed that the Fed should be the “supplier of restraint of last resort” because of the short-term inflexibility of the budget.Footnote 121 The NFTC continued its appeal for monetary and fiscal discipline to stabilize the dollar through its annual policy declarations.Footnote 122 More moderate business organizations such as the CED and Business Roundtable joined the crusade, calling for budgetary and monetary restraints at congressional hearings.Footnote 123 Meanwhile, the financial community upheld its credo. The ABA insisted that the government adopt more restrictive monetary and fiscal policies and maintain them even when the economy enters into recession; the American Council of Life Insurance agreed.Footnote 124 Representatives from various financial intermediaries—ranging from Morgan Stanley and Co., to Prudential Insurance Co., and to North Carolina National Bank—swarmed congressional hearings to demand austerity.Footnote 125
Finally, in 1979, the Carter administration showed its strong determination to end inflation. In early 1979, Michael Blumenthal, secretary of the Treasury, and Charles Schultze, chair of the Council of Economic Advisers, pressed the Fed to tighten further the money supply. However, Fed Chair Miller was reluctant to do so due to widespread anticipation of an imminent recession.Footnote 126 In an effort to reboot his economic measures, Carter reshuffled his cabinet in summer 1979, replacing Miller with Paul Volcker. Volcker was one of the few members of the Federal Open Market Committee, the locus of monetary policy-making, who opposed Miller’s views and advocated more restrictive direction.Footnote 127 The Wall Street Journal welcomed the appointment, calling it a “balm for business,” whereas the New York Times expressed reservations.Footnote 128 When Volcker adopted extremely contractionary measures, known as the “Volcker Shock,” in October 1979, the business community strongly endorsed the approach.Footnote 129 The NAM appealed that “this is strong medicine and, as we have already seen, it has distressing side effects. Furthermore, one dose won’t cure us of inflation and we will have to be taking this medicine for a long time into the future.”Footnote 130 Also, individual business leaders of GE, du Pont, Sears, and others showed positive responses.Footnote 131 However, there were also voices of concern. Lane Kirkland, of the AFL-CIO, called it “the wrong move at the wrong time.”Footnote 132
Volcker staunchly upheld his tight monetary policies during the early 1980s, causing interest rates to rise to almost 20 percent in 1981. Consequently, the U.S. economy slipped into the most severe contraction since the 1930s, with unemployment exceeding 10 percent in summer 1981. Despite the deep recession, Volcker recalls, “There was substantial support in the country for a tough stand against inflation, for all the real pain and personal dislocation that seemed to imply.”Footnote 133 In particular, the U.S. business community stood firmly behind the Fed’s extreme monetary policies.Footnote 134 In 1980 the CED claimed in front of Congress that “policy makers must not yield to the temptation to abandon monetary restraint or government spending limits,” even as the recession continued.Footnote 135 William Niskanen, of Ford Motors, while recognizing that the U.S. auto industry was experiencing a recession, emphasized that “fiscal, monetary, and regulatory policies should be directed to longer term objectives, rather than to specific relief during a recession.”Footnote 136 In May 1980 George Hagedorn, of NAM, was delighted that “our political leaders finally appear willing to accept the recession which seems inescapable as a step toward curbing inflation.”Footnote 137 In 1981 James Binns, chairman of NAM’s Board of Directors, proudly reported to its members that the newly elected U.S. president promised to shun stopgap measures, but instead would continue fiscal and monetary restraints.Footnote 138 Similarly, at 1981 congressional hearings, Richard Rahn, vice present and chief economist of the Chamber, encouraged Congress to support the Fed’s actions.Footnote 139 In 1982 NAM relentlessly upheld its support for a balanced budget and an “independent Fed.”Footnote 140 Of course, bankers stood with the industrialists. For instance, the ABA stated in front of Congress in 1980 that the monetary authority should enjoy “freedom from political pressures.”Footnote 141 In 1981 the American Council of Life Insurance stressed the importance of anti-inflation policies, regardless of the strong resistance against such fight.Footnote 142 In his recent study on the independence of the Federal Reserve, Conti-Brown notes that Paul Volcker built his own “independent political base” during his first term: U.S. business. Even after the severe recession, Reagan had to reappoint Volcker as Fed Chair in fear of the reactions from the market.Footnote 143
At last, inflation was halved to 6.2 percent in 1982 from its peak of 13.5 percent in 1980. However, the deep recession following the Volcker Shock transformed the U.S. economy in many ways. Small firms, exporters, and interest-rate-sensitive industries such as construction and automobile were hit hard. In addition, the unprecedented level of unemployment substantially weakened the bargaining position of labor unions.Footnote 144 Most important to this article’s argument, the extreme austerity facilitated the rise of finance in the United States. As the austerity measures reduced inflation, financial profits rebounded. High interest rates also attracted a large amount of foreign capital into the U.S. financial markets, enriching U.S. financiers as well as creating an economic environment conducive to financial bubbles by expanding available credit in the economy. Scholars have indicated that the Volcker Shock signified a paradigm shift in U.S. monetary policy.Footnote 145 Since the late 1970s, the Fed has prioritized price stability over full employment. From 1961 to 1965, the average real interest rates were 2.7 percent and 1.8 percent, long-term and short-term, respectively; however, the rates rose to 7 percent and 4.8 percent between 1981 and 1985, and 4.2 percent and 3.3 percent between 1996 and 2000.Footnote 146 As Keynes once noted, the “contractionary bias” has served financial interests well.
Coda
This article analyzed how industrial leaders engaged in American financialization, and focused on new business practices and business politics. It also demonstrated how the financial transition was interwoven with the unraveling of the postwar class-compromise between big business and organized labor and the concurrent emergence of industrialist–financier alliance. Prominent industrialists, once strong supporters of the New Deal order, changed their attitude toward labor relations and Keynesian economics as they applied new business strategies to deal with economic turmoil during the 1960s and 1970s.
In addition, this research contributes to the business history literature by offering new perspectives on important historical events such as the collapse of the Bretton Woods system and the Volcker Shock. First, historians have extensively examined the role of industrial firms in globalization, but have underestimated their role in the key incidents leading to financial globalization, such as the international monetary changes during the early 1970s.Footnote 147 This research demonstrated that multinational firms’ practice of “leads and lags” critically destabilized the postwar Bretton Woods system. Also, while studies have emphasized U.S. firms’ reactions to U.S. capital controls, this research goes further, showing that major business associations organized task forces to investigate and influence international monetary reforms. This study calls for further research on the role of business actors in the transformation of international monetary systems. Also, this article characterizes American business’s support of the Volcker Shock differently from studies that emphasize the class-based divisions of unemployment versus inflation trade-off.Footnote 148 Specifically, my research delves into the internal rift within the business community, revealing that industrialists were much more patient with expansionary policies than were financiers, at least until the 1970s.Footnote 149 That is, “class” alone cannot explain U.S. industrial leaders’ changing policy preferences over time; instead, the industrialists’ new business agendas in the 1970s influenced their policy positions. Surely, as current studies correctly indicate, U.S. business’s distaste for price controls and concern about hyperinflation affected their attitude toward austerity policies. My research complements these studies by demonstrating that changes in business strategies also mattered.
Finally, this article’s limitations and caveats should be discussed. In focusing on explaining the role of leading industrialists in American financialization, this article inevitably omits attention to many actors and issues considered critical in the literature. For instance, researchers have indicated that major state and government entities were central to the development of Euromarkets. The American and British governments allowed market participants a great degree of freedom in Euromarkets, even though they had tools to regulate the markets; also, central banks, state agencies, and local governments were main suppliers and demanders of the funds in the markets.Footnote 150 What this research intends to show is that U.S. industrial firms grew into major players, along with governments and bankers, in the Euromarkets during the 1960s and early 1970s, which had significant implications for the fate of the Bretton Woods system. In a similar vein, my research does not claim that the business backing of monetary restraint was the sole or most important factor behind the Volcker Shock. The extraordinary level of inflation, international dollar crisis, and the rise of “monetarist” approach were all responsible for the event.Footnote 151 Additionally, my emphasis on the political power of business does not imply that business unity guarantees policy changes to their benefit.Footnote 152 For example, although both industrial and financial leaders opposed consumer credit controls in the early 1980s, the Carter administration implemented them to appease certain groups such as labor unions.Footnote 153 A more modest claim of this article is that the U.S. business community showed its firm commitment to austerity during a severe recession, significantly helping the Fed to maintain drastic monetary policies.