The economic impact of industrializing Europe (what we call the core) on the poor periphery (Asia, Africa, and Latin America) between 1750 and 1913 had its source in three forces. The first was the shift in European policy away from antiglobal mercantilism and towards proglobal free trade.Footnote 1 The second was a worldwide transport revolution that served to further integrate world commodity markets.Footnote 2 Both helped provoke a boom in trade between core and periphery and contributed to commodity price convergence for tradable goods in all world markets. The transport revolution also contributed to a rise in every country's external terms of trade (the price of their exports relative to the price of their imports), especially in the poor periphery. The third force was the derived demand for raw material intermediate goods used in manufacturing, such as cotton, rubber and metals, which soared as manufacturing production led the way in the core. Thus, as industrial economies raised their manufacturing output shares, manufacturing output growth raced ahead of GDP growth. These forces were reinforced by accelerating income per capita growth in Europe and a high income elasticity of demand there for luxury consumption goods, such as meat, tea, and coffee. Because European industrialization was driven by unbalanced productivity advances favoring manufacturing relative to agriculture and other natural-resource-based activities, the relative price of manufactures fell everywhere. All three forces produced a powerful secular terms-of-trade boom in the poor periphery, raising the relative price of their primary product exports during an epoch that stretched over a century. Mass migration within the poor periphery (especially from China and India) and capital flows from Europe (especially from Britain) helped the poor periphery exploit the export price boom, expanding their export sectors and reinforcing their comparative advantage in primary products. De-industrialization was the other side of this globalization coin. We have come to call these Dutch disease effects, and never were they more powerful before or since.
Eventually these three forces abated. A globalization backlash hit most of the world (except Britain, the Netherlands, their colonies, and dependent Asia), causing a partial shift backwards to protection.Footnote 3 The rate of decline in real transport costs along sea lanes slowed down before 1913, approaching a steady state constant over the rest of the twentieth century.Footnote 4 The rate of growth of manufacturing in Europe and its offshoots slowed down as the transition to industrial maturity was completed. As these three forces abated, the resulting slow down in primary product demand growth was reinforced by resource-saving innovations in industrial centers, induced, in large part, by expensive primary products whose prices had soared during the nineteenth-century terms-of-trade upswing. Thus, the secular boom faded, eventually turning into a secular bust. Exactly when the boom turned to bust depended on the export commodity in which each periphery region specialized, but all of them reached a terms-of-trade peak somewhere between the 1860s and World War I.
This secular boom in the periphery terms of trade is illustrated well by Latin America. The region's terms of trade underwent a steady increase from the 1810s to the early 1890s, and the improvement was especially dramatic during the first five decades. Furthermore, the increase is understated to the extent that it fails to take account of the likely quality improvement in manufactures relative to primary products: the quality-adjusted terms of trade in Latin America probably grew at a little more than 2.2 percent per annum between 1815 and 1819 and 1855 and 1859, and at a little more than 1.4 percent per annum between 1815 and 1819 and 1890 and 1894.Footnote 5 This was a very big terms-of-trade boom, but Latin American experience was hardly unique as the increase was even bigger for Egypt, the Ottoman Empire, Indonesia, and elsewhere in the poor periphery.Footnote 6
Unfortunately, a terms-of-trade boom does not guarantee fast growth. Indeed, during the terms-of-trade boom, rates of technological advance and human capital accumulation were so modest in the poor periphery that the living-standard gap between it and the industrial countries rose to levels that were much wider at the end of the boom than at the beginning. Whether the modest rates of technological advance and human capital accumulation in the poor periphery were caused by de-industrialization has, of course, been a central issue in historical debate since the core-periphery income per capita gap opened up so dramatically. All scholars agree, however, that the terms-of-trade boom caused de-industrialization in the poor periphery through Dutch disease and other effects.Footnote 7
This article establishes that Mexico obeyed the same laws of motion as the rest of the poor periphery between 1750 and 1877 (before the economic changes of the Porfiriato began). However, we think the differences between Mexico and the rest of the poor periphery were sufficiently pronounced to allow us to speak of Mexican exceptionalism. As we shall see, the rate of de-industrialization was far less than elsewhere in the periphery, suggesting that Dutch disease forces were weaker and that there were offsetting local forces at work, and that both served to distinguish Mexican experience from the rest.
MEXICAN DE-INDUSTRIALIZATION IN THE TRANSITION BEFORE THE PORFIRIATO
It is very important to distinguish between economy-wide productivity levels and rates of growth, on the one hand, and industrial output and employment performance, on the other. This section starts with the former before dealing with the latter.
Mexican Economic Growth: Bourbon Reform, Insurgencia, and Lost Decades
Debates about colonial growth have been lively, mostly because the evidence is so scarce. Still, an optimistic view is on the rise.Footnote 8 Mexico produced two-thirds of total world silver output by 1800 and most of it was exported to an expanding international economy. In addition, while Mexican GDP per capita may have been lower than that of the western European core, it was higher than many in the European periphery (such as Greece and Russia), and similar to others.Footnote 9 Furthermore, Mexico was well ahead of Asia and Africa. There is, however, a more pessimistic view, such as that of John Coatsworth. Coatsworth's pessimism emerges from his documented stagnation between 1700 and 1800, followed by the economic disruption caused by the Insurgencia.Footnote 10 Angus Maddison's optimism emerges from his substantially lower GDP per capita estimate for 1700 and, surprisingly, the apparent belief that economic disruption during the Insurgencia had no lasting impact. Note, however, that both authors document a significant increase in Mexico's GDP during the eighteenth century: Maddison estimates a doubling between 1700 and 1820, whereas Coatsworth estimates an increase by 2.3 times between 1700 and 1800. Thus, the difference in their per capita GDP growth estimates lies with very different views about population change.Footnote 11 In any case, Maddison estimates that Mexican per capita GDP was about 77 percent of the continental European periphery in 1820.Footnote 12
Debate over GDP per capita growth before 1820 will, no doubt, continue, as will debate over relative GDP per capita levels at the start of the nineteenth century. But there is other evidence supporting significant economic achievement of the eighteenth-century pre-industrial Mexican economy. For example, the urban share of the population was at least 9.1 percent around 1800.Footnote 13 This 1800 urbanization rate was higher than that of Scandinavia, Ireland, Germany, France, Switzerland, Portugal, Austria-Hungary, and Poland, and very close to the European 10 percent average.Footnote 14 Growing towns implied declining agricultural self-sufficiency, rising commercialization, developing internal markets, and an industrial base equivalent to the proto-industrial platform from which Germany, France, Switzerland, and so much of the rest of the European continent were to develop their industrial revolutions between 1800 and 1870.
Although the debate about Mexican growth before the Insurgencia may be intense, there is little disagreement with the view that Mexican GDP per capita did not grow at all between the Insurgencia and the start of the Porfiriato. During the five “lost decades” from 1820 to 1870, the per capita GDP growth rate estimates range between −0.2 percent and +0.3 percent, for an average of hardly any growth at all.Footnote 15 These Mexican lost decades took place when the European and North American economies were undergoing industrial revolutions and showing features of vigorous modern economic growth. Even when compared with slow-growing nineteenth-century Spain, Mexico underperformed.Footnote 16 Most analysts of the poor economic performance during the lost decades point to postindependence institutional weakness and political instability.Footnote 17 Others would, no doubt, emphasize the legacy of inefficient colonial institutions, inequality, and culture.Footnote 18 Still others believe that it was an interruption of colonial “mining led growth” that explains the underperformance of the Mexican economy after the Insurgencia.Footnote 19
The important point for this article is that the rising economic gap between Mexico and Western Europe between 1800 and 1870 was largely the result of the Insurgencia and the postindependence lost decades, not just colonial legacies.
Foreign Trade and Openness
Commerce between Spain and Spanish America was strictly regulated until 1765. Only one port in Spain—Cádiz—and four in America—Cartagena, Portobelo, La Habana, and Veracruz—were authorized to trade. The rationale for this system was to make it easier for the Crown to collect taxes on its colonial trade. Early in the eighteenth century, some observers claimed that the trade regulations actually hurt the Crown because they limited commerce and thus the tax potential. Lower taxes, more ports, fewer smugglers, and a proglobal policy would, it was argued, increase revenue for the Crown. Eventually, the Crown listened, and in 1765 it endorsed the Decree of Free Trade, by which restrictions regulating commerce between Spain and Spanish America were substantially reduced. By 1789 colonial Mexico had gone open.
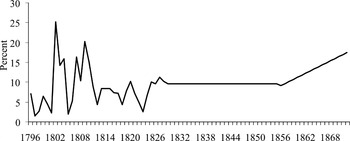
Figure 1 offers estimates of late colonial openness, and it also extends the measure to the late 1860s. As is common in the trade-development literature, the openness variable is simply the trade share, that is, exports plus imports as a share of GDP. The average trade share was 9.6 percent between 1796 and 1820, 12.5 percent between the mid 1820s and the mid 1850s, and 17 percent by 1872. The 1796–1820 trade share was higher than that of France in 1815 (8.4 percent) and comparable to that of the United States.Footnote 20 Thus, the late colonial and the early postcolonial Mexican economy was open, if only by the standards of that time.
MEXICAN FOREIGN TRADE SHARE (X + M) IN GDP, 1796–1872

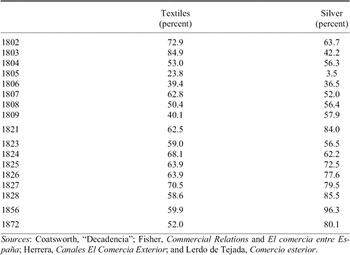
Furthermore, the structure of Mexican foreign trade with the Atlantic economy can be summarized without much exaggeration as an exchange of silver, augmented by cochineal, for textiles (see Table 1).Footnote 21 Pacific trade with Asia was similar, mainly consisting of textile (and handicraft) imports and silver exports through the Galeón de Manila. Independence did not bring about a substantial change in the structure of Mexican foreign trade, dictated as it was by fundamental resource endowments and geographical location. Indeed, export specialization was reinforced, and textiles kept their dominant position among imported items. The textile import share in total imports was 64.8 percent in the decade before the Insurgencia and 63.4 percent in the decade thereafter.Footnote 22 Machinery and tools were virtually zero in the 1820s, and these imported capital goods only became important as Mexico quickened its growth and accumulation at the beginning of the Porfiriato period.Footnote 23 Still, Mexico's nineteenth-century foreign trade mix was much like that of the colonial period—silver in exchange for textiles. Thus, Mexican import capacity depended on silver exports and silver production. Because silver production fell from late colonial levels and underwent only a slow and incomplete recovery after independence, import capacity rose only slowly as well. Thus, while textile imports rose as a share of total imports in the 1820s, they did not quickly recover their pre-Insurgencia absolute levels. In short, there was no export-led growth boom until the Porfiriato. But why? Was it because the relative price of silver was stable in world markets? Was it because the Spanish mercury subsidy (for silver extraction) evaporated? Was it because of other Mexican supply-side factors?
TEXTILE IMPORTS/TOTAL IMPORTS AND SILVER EXPORTS/TOTAL EXPORTS, 1802–1872

Sources:
Coatsworth, “Decadencia”; Fisher, Commercial Relations and El comercia entre España; Herrera, Canales El Comercia Exterior; and Lerdo de Tejada, Comercio esterior.
DE-INDUSTRIALIZATION AND INDUSTRIALIZATION IN MEXICO
Textiles are a very big share of manufacturing activity in all economies embarking on modern economic growth, whether the gauge is employment or output. For example, Manuel Miño Grijalva estimates that cotton textile production in New Spain was a little more than 5 million pesos by the end of the eighteenth century, or between 60 and 70 percent of total manufacturing production (7 to 8 million pesos).Footnote 24 Fortunately, textiles are also the best-documented manufacturing activity. Thus, our account of Mexican de-industriali-zation over the century or so before 1877 will focus on woolens and cottons.
Domestic Textiles and Industry Before 1820
The postconquest Mexican textile industry began as early as the 1530s with the establishment of the first obrajes, integrated woolen textile manufactories with from 20 to 100 workers. Richard Salvucci estimates that obraje production rose from about 1.5 million pesos in 1600 to between 1.5 and 2 million pesos in 1700.Footnote 25 Woolen textiles underwent a sharp secular decline late in the colonial era, so that by the end of the eighteenth century production had decreased to between 1 and 1.5 million pesos, and was negligible by 1812. The obrajes heyday had passed by the 1810s. While 40 obrajes were operating in New Spain in 1579, there were only 30 in 1770, and 19 in 1810.Footnote 26 Increasingly, woolen textile production was carried out in domestic workshops (trapiches) which “expanded in Querétaro from 30 to 340 between 1693 and 1803.”Footnote 27 The rise of trapiches was part of a cost-reducing response to the inflow of cheap foreign cloth, reflected by a steep decline in the price of textiles relative to corn.Footnote 28 After 1750 the Mexican woolen industry had to face increasingly fierce competition from imported British and Catalan cloth as well as from a growing domestic cotton textile industry.Footnote 29 Although foreign cotton goods certainly penetrated the Mexican market, domestic cotton textile firms fared much better than did obrajes in the competition. Indeed, cotton textiles expanded in New Spain between 1750 and 1800, and by the end of the century cotton production was far more important than woolens: there were about 11,000 Castilian treadle looms working in New Spain by 1800, of which 87 percent were weaving cotton.Footnote 30
Mexican cotton textile production was based on a putting-out system similar to that which flourished in proto-industrial Europe. Merchants distributed raw cotton to artisans who did the spinning and weaving, after which these merchants sold the finished product throughout the region. This expansion took place most prominently around the cities of Puebla, Tlaxcala, Mexico, and Guadalajara.Footnote 31
The cotton textile industry diversified in the second half of the eighteenth century, evolving from the production of only basic cotton drill (manta) to calico prints (indianas, pintadas, or zarazas).Footnote 32 Several indianilla factories were established in New Spain that specialized in printing and finishing cotton yarn and cloth produced by the domestic putting-out system or imported from China and India. These factories were similar to those that were being developed in Catalonia, and they represented the most elaborate manufacturing organization that had yet appeared in New Spain.Footnote 33 It is not clear how many of these factories existed, but there appear to have been several.Footnote 34 Records exist for an indianilla factory in Mexico City which document that by 1804 it employed close to 500 workers.Footnote 35
Although obrajes underwent a steep secular decline throughout the eighteenth century, cotton textiles underwent an even steeper rise, and total textile production expanded. The number of looms in New Spain increased from 1,323 in 1781, to 9,981 in 1793, and 11,692 in 1801, providing work for approximately 90,000 spinners and weavers in 1800.Footnote 36 Late-eighteenth-century cotton textile manufacturing in New Spain flourished given the relative absence of European imports cut off by wartime conflict. But the good times ended after 1802 when a change in Spanish policy allowed neutral powers to trade directly with Mexico, triggering an invasion of foreign cloth.Footnote 37 Between 1802 and the 1830s, Mexican textiles faced the most intense foreign competition they had ever experienced.
The War of Independence (1810–1821) raised de-industrialization forces to “apocalyptic” proportions, and it hit hardest those regions in which the textile industry was concentrated, Bajío and Puebla-Tlaxcala.Footnote 38 Raw materials became scarce, and the commercial routes to the north, traditionally an important market for domestic textile production, were cut. Mortgage registries from the city of Puebla show that from 1816 to 1820 private lending decreased considerably and clerical lending collapsed completely.Footnote 39 Many textile workers abandoned their looms to join the contending armies, and many died as a consequence of epidemics.Footnote 40 The Insurgencia delivered the death blow to the woolen obrajes. There were still 19 obrajes with 291 looms operating in Querétaro in 1810, but only four were still working in 1812. By 1831 the looms in Querétaro were producing only 1,200 pieces of woolen cloth yearly, compared with 7,000 pieces produced there at the end of the eighteenth century.
Cotton textile production was also greatly affected by the intense post-1802 foreign competition. The Consulate of Mexico reported that in 1818 foreign trade had left 12,000 textile workers unemployed. The city of Puebla, where an important part of the cotton cloth industry was located, experienced a population decrease of 19 percent from 1791 to 1821. Guadalajara's cotton textile production “was virtually eliminated by competition from imports through the newly opened Pacific ports.”Footnote 41 Although the cotton textiles sector was heavily damaged, it survived these three decades of foreign competition and Insurgencia, but it did not fully recover until the 1830s.Footnote 42
The literature offers several competing explanations for the demise of Mexico's woolen textile sector. Salvucci favors domestic demand.Footnote 43 His argument is that woolen textiles were an inferior good: as household incomes and living standards rose, consumption and thus production of obrajes fell. But, as we saw above, it is not clear that Mexican income per capita actually rose in the eighteenth century. Given the more recent evidence (unavailable to Salvucci) of slow population growth, modest increases in per capita income, and real wage decline, Salvucci's domestic-demand-led hypothesis loses its plausibility.Footnote 44 In any case, because the logic of Salvucci's domestic-demand-led hypothesis requires that New Spain be viewed as a closed economy, it must be rejected.Footnote 45 Colonial Mexico certainly was not a closed economy; indeed, we have already argued that New Spain was relatively open to trade (see Figure 1). If, instead, the reader thinks that the economy was closed, and that income or taste changes were causing domestic demand to shift away from woolens to cottons, then we ought to see a rise in the price of cotton relative to woolen cloth across the eighteenth century. We do not. Mexico mimics world relative cloth price trends, and they certainly do not confirm Salvucci's hypothesis. Instead, relatively rapid productivity events in cotton spinning and weaving abroad served to drive down the relative price of cotton goods. In a small open economy such as colonial Mexico, domestic demand could not have influenced the relative price of goods actively traded in world markets. Imported factory goods were competing with Mexican spinning and weaving, and such competition was also taking place in India, Egypt, the Ottoman Empire, and elsewhere in the poor periphery.Footnote 46 The evidence also suggests that, as in Mexico, there was no significant increase in Indian and Ottoman per capita income that might have had the local demand effects Salvucci hypothesizes.
Enrique Florescano thought that the agrarian crisis at the end of the eighteenth century must have had depressing effects on manufacturing.Footnote 47 According to Florescano, the sharp increase in corn prices that took place in 1771/72, 1785/86, and from 1809 to 1811 affected the obrajes and the cotton textile workshops in several ways. First, it raised the cost of raw materials (cotton and wool), energy, and transport, the latter due to the crisis-induced rise in livestock prices. Second, the crisis reduced available textile workers, as many either left for the countryside, given that they could no longer support themselves on prevailing urban wages, or were victims of famine and epidemics. Finally, and most importantly, Florescano thinks that the agrarian crisis resulted in a general collapse in purchasing power. For him, the upward pressure on food costs reduced the household surplus available for other goods such as textiles, causing a fall in textile demand and a decrease in obraje output. We agree with the first step in Florescano's argument: indeed, later in this article we document a large decline in real wages from the 1750s to the 1800s (around 60 percent).Footnote 48 However, we do not agree with his last step: we have already argued that domestic demand could not have played anything but a modest role between 1750 and 1820.
We think that the rise in food costs that Florescano stressed put upward pressure on the nominal wage and thus served to reduce competitiveness in domestic textiles: labor costs must have risen while textile prices fell.Footnote 49 We have shown that while wool production declined during the last decades of the eighteenth century, cotton production grew until 1802. Thus, the effects of the agrarian crisis were different for cotton and wool manufacturing, which indicates that cotton textiles were in a better position to adapt to rising input costs than were woolens. We shall return to these supply-side forces emanating from the “agrarian crisis” because we think they may be central to understanding Mexican de-industrialization.
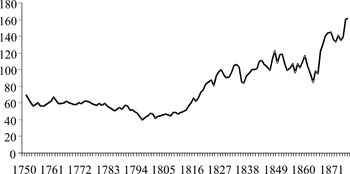
Although falling domestic demand did not cause the demise of woolen textiles after the 1790s, the invasion of foreign textiles clearly did. That invasion was carried in large part by rapid, factory-based productivity advances in Britain, which increased British competitiveness and lowered textile prices the world around, thereby crowding out cottage industry in Mexico and everywhere else in the world's periphery. Driven by those productivity gains, the cost of British cottons fell by as much as 70 percent between 1790 and 1812.Footnote 50 Compared with Mexico's key export product, silver, textile prices collapsed after around 1805 or so (Figure 2). This dramatic increase in the terms of trade (the price of silver exports relative to imported manufactures) provoked de-industrialization, although, as we shall see, its effects were cushioned by a persistent wage competitiveness and, probably to a lesser extent, by protectionist and other pro-industrial policies introduced by the first republican governments.Footnote 51
MEXICAN EXTERNAL TERMS OF TRADE (1828 = 100)

Domestic Textiles and Industry, 1820–1877
While Mexican (and other Latin American) textile manufactures struggled against foreign imports during the first third of the nineteenth century, some observers thought it was a losing battle. In 1827 the English diplomat Henry George Ward saw a dismal future for local textiles. He wrote:
… until the end of the last century the value of cotton manufactures was estimated in five million dollars. Currently, they are gradually disappearing, as a result of the more abundant supply of European manufactures, and probably they will cease to exist in the course of a few years.Footnote 52
There was clear evidence of Mexican de-industrialization when Ward was writing. Indeed, he must have been well aware of the fact that “in the capital of Oaxaca, where once 500 looms had clattered in the production of cotton cloth, a mere 50 were working in 1827.”Footnote 53 But Ward's gloomy prediction did not materialize: just a decade later, the industry was experiencing substantial growth and supplying a large domestic market. Mexico had 5.9 million inhabitants in 1820, the second largest population in the Western Hemisphere after the United States.Footnote 54 Thus, in spite of the low incomes received by a very large share of its population, Mexico had a large domestic market in which to foster industrialization through protectionist policies.Footnote 55 And textile artisans from Puebla and the merchants involved in the putting-out system were sufficiently powerful politically to obtain higher tariffs on textiles that would help defend them from the fierce foreign competition. Moreover, the deep economic downturn between 1821 and 1826 gave way to an era of moderate growth that gained speed in the 1840s and did not end until the outbreak of the Ayutla Revolution (1854) and the Reform war (1858—1861).Footnote 56
Although textile producers were united for protection during the 1820s, they were less united regarding the benefits of mechanization. With the pro-industrialist Lucas Alamán at the head of the Ministry of Interior and Foreign Affairs in the early 1830s, the government began to support the establishment of mechanized factories through credit provided by the Banco de Avío, a development bank that supported industrialization, of which more will be said.
From 1835 onwards, mechanized textile mills began to be established in Mexico, and the industry grew at impressive rates during the following decade:
These mills were established around the same time that the Lowell mills were built, and only twenty years after the first mechanized mill was established in the United States. Brazil, the other precocious industrializer in Latin America, established its first mills in the 1840s. Yet, by 1853 it only had 8 mills with 4500 spindles while ten years earlier Mexico's textile manufacture included 59 mills with more than 100,000 spindles.Footnote 57
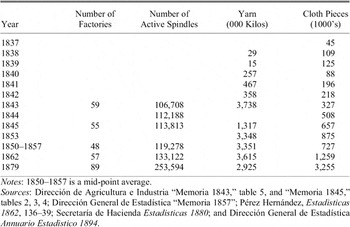
As in other places, mechanization of spinning preceded that of weaving, but, as time went by, weaving began gradually to be carried out in factories as well. Cotton textile factory production grew rapidly in the late 1830s and early 1840s rising from 29 thousand kilos of yarn produced in 1838 to more than 3.7 million kilos in 1843 (Table 2), while cloth production grew at an annual rate of 11 percent from 1838 to 1843. Growth in cotton textile production slowed down after that date for several reasons: a fall in the price of imported textiles compared with that of mineral exports after 1845; a high price for domestic raw cotton (protected by very high tariffs); much larger levels of political and economic instability in the second part of the 1840s due to foreign invasion and domestic civil war; and a reduction in government support for industry, exemplified by the closure of the Banco de Avío in 1842 and a decrease in tariffs.Footnote 58
GROWTH IN THE MEXICAN COTTON TEXTILE INDUSTRY, 1837–1879

Notes:
1850–1857 is a mid-point average.
Sources:
Dirección de Agricultura e Industria “Memoria 1843,” table 5, and “Memoria 1845,” tables 2, 3, 4; Dirección General de Estadística “Memoria 1857”; Pérez Hernández, Estadisticas 1862, 136–39; Secretaría de Hacienda Estadisticas 1880; and Dirección General de Estadística Annuario Estadistico 1894.
Nonetheless, the textile industry continued to grow between 1843 and 1877. The number of looms and spindles increased by 138 percent and 241 percent respectively during that period. Moreover, the average firm increased in size as measured by spindles (up 58 percent) and looms (up 126 percent).Footnote 59 The Mexican cotton textile industry also modernized between 1843 and 1879. Whereas 37 percent of the mills in 1843 used men or mules as their source of power and only 3 percent ran on steam, by 1879 no textile mill operated with animal or human power, and 64 percent employed steam power.Footnote 60
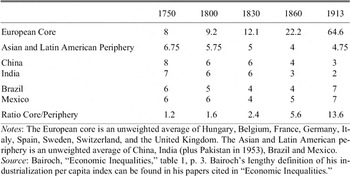
The growth of the Mexican textile industry between the mid 1830s and late 1870s contrasts sharply with the devastating de-industrialization that took place in most parts the poor periphery. Table 3 uses Paul Bairoch's data to show that whereas per capita industrialization in the European core was only about 1.2 times that of the Asian and Latin American periphery in 1750, the figure was 1.6 in 1800, 2.4 in 1830, and 5.6 in 1860. The table also shows that it was not simply a matter of faster European industrialization over the century, as per capita industrialization in the periphery fell by about 15 percent between 1750 and 1800, and by 30 percent between 1800 and 1860. There were powerful de-industrialization forces at work everywhere in the periphery after 1750.Footnote 61
PER CAPITA LEVELS OF INDUSTRIALIZATION, 1750–1913

Notes:
The European core is an unweighted average of Hungary, Belgium, France, Germany, Italy, Spain, Sweden, Switzerland, and the United Kingdom. The Asian and Latin American periphery is an unweighted average of China, India (plus Pakistan in 1953), Brazil and Mexico.
Source:
Bairoch, “Economic Inequalities,” table 1, p. 3. Bairoch's lengthy definition of his industrialization per capita index can be found in his papers cited in “Economic Inequalities.”
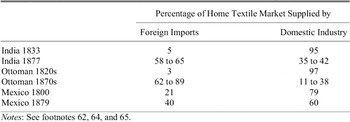
However, Mexico underwent less dramatic de-industrialization up to the 1870s and 1880s than did Asia and the rest of Latin America. Table 3 documents “only” a 17 percent fall in Mexico's per capita industrialization index between 1800 and 1860 (30 percent for the whole periphery), and the Mexican index actually rose between 1830 and 1860. Table 4 offers some additional comparative evidence where de-industrialization is measured by foreign import penetration and the share of domestic demand supplied by the home industry.Footnote 62 Early in the nineteenth century, the percentage of the home textile market supplied by foreign imports was higher in Mexico (21 percent) than in either India (5 percent) or the Ottoman Empire (3 percent). This is consistent with our view that Mexico was relatively open to trade at that time, in part due to its closeness to the industrial core and the booming Atlantic economy. In spite of the de-industrialization damage, by 1842 Mexico still ranked ninth in machine cotton spinning world-wide, its spindles per capita just below those of Germany and Austria-Hungary, and far above Russia's.Footnote 63 Most importantly, note the contrast by the 1870s and 1880s revealed in Table 4. By then, foreign textile imports claimed “only” 40 percent of the Mexican market, leaving 60 percent for domestic producers, a fairly big number for a country that had been attacked by cheap European textiles for almost a century. Indeed, the figure for de-industrializing India was only 35–42 percent in 1887, much lower than Mexico's 60 percent in 1879.Footnote 64 The de-industrialization evidence is even more dramatic for the Ottoman Empire where the share of domestic supply in total local consumption was only 11–38 percent in the early 1870s.Footnote 65 Thus, despite the importance of foreign imports, the Mexican textile industry was doing fairly well by 1879, at least compared with the rest of the periphery.
COMPARATIVE DE-INDUSTRIALIZATION: TEXTILE IMPORT PENETRATION, 1800s–1880s (MEXICO VS INDIA AND THE OTTOMAN EMPIRE)

Notes:
See footnotes 62, 64, and 65.
A NEO-RICARDIAN MODEL OF MEXICAN DE-INDUSTRIALIZATION
What were the domestic supply-side conditions that influenced Mexican competitiveness with foreign manufactures? During the century before the Porfiriato, when foodstuffs for peasants and urban workers (such as corn and beans) were not traded internationally and when foodstuff expenditures represented a very large share of family budgets, agricultural productivity must have influenced manufacturing competitiveness, as Alexander Gerschenkron, W. Arthur Lewis, and even Adam Smith argued long ago.Footnote 66 After all, in a pre-industrial economy with relatively stable subsistence wages, any decline in agricultural productivity must put upward pressure on food prices and thus also on nominal wages in every nonfood sector, eroding competitiveness in import-competing manufacturing.Footnote 67 This would have been manifested by rising food prices relative to other products, by falling profitability in manufacturing, and by a decline in its output (as Florescano believed). This story seems to work well in accounting for the spectacular demise of Indian, Egyptian, and Ottoman manufacturing in the face of British competition after 1750.Footnote 68 It has also been cited by Lewis as a cause of de-industrialization in the tropical periphery more generally.Footnote 69
In order to formalize our intuitions about the relationship between relative prices and de-industrialization, we use a simple neo-Ricardian model.Footnote 70 We must stress that it is only a very simple model, and, like all models, makes assumptions that held only approximately at best anywhere in the poor periphery or even in Europe during the eighteenth and most of nineteenth century. Still, like the models of Malthus, Ricardo, and W. Arthur Lewis, the neo-Ricardian model developed here helps greatly to organize our thinking about de-industrialization in the poor periphery in the face of world globalization and industrial revolutions by their trading partners. Consider a perfectly competitive economy in which there are three sectors: textiles, the importableFootnote 71 (T); silver, the exportable (S); and corn, the nontradableFootnote 72 (C). To be absolutely clear, the model takes the price of textiles (pT) to be the price of imports and the price of silver (pS) to be the price of exports. In addition, the model assumes that textiles and silver are traded in the world market and sell for the world prices pT and pS, respectively, while pC is determined endogenously by local supply and demand. Labor (L) is mobile between all three sectors, is the only factor of production, and costs nominal wage w per unit. We abstract from capital and land for simplicity, but in any case we do not need either of them to make our point. Finally, when we talk about a decrease in textile employment, LT, we refer to this contraction as strong de-industrialization, and when we talk about a decrease in the textile employment share, LT/ L, we refer to this contraction as weak de-industrialization. Table 3, for example, has already been used to describe weak de-industrialization around the poor periphery between 1750 and 1913.
To create a link between agricultural productivity and wages in the textile sector, we follow Lewis in assuming that the real wage in corn units was constant, at least in the short run and medium term.Footnote 73 This assumption is critical, and it may have been violated in the very long run. We only require that it was quite sticky in the short run and medium term, and the evidence (as we shall see) seems to confirm that.Footnote 74 The Lewis assumption implies the possibility of unemployment, so L represents employment rather than the population, which we denote by P.
Suppose output in each of the three sectors is produced according to a Cobb-Douglas production function


C, S, and T are technology parameters (or include the impact of fixed endowments, such as land) and the elasticities α, β, and γ are all less than one, insuring diminishing returns. The labor market is such that each individual will supply one unit of labor as long as the corn or maize wage w/pC is at or above the reservation price of one. We assume that there is no rationing of labor, so that L = LC + LS + LT < P. Profit maximization in each sector ensures that labor demand will be given by



If we assume that there is no technical change, the growth rates of labor demand are



Because the nominal wage is equal to the price of corn, employment in the corn sector is fixed. Growth in the own wage in either silver mining (w/pS) or textile production (w/pT) leads to a decline in the absolute number of workers employed there. Thus, strong de-industrialization results from an increase in the own wage in textiles. The own wage in either sector could increase due to a decline in the world price for its output. It could also increase if the price of corn rose, induced, for example, by some negative productivity shock to agricultural output.
The growth rate of the share of textile workers in total employment, our measure of weak de-industrialization, is
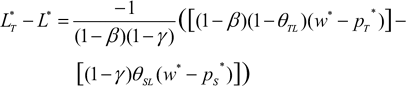
The shares of textile production and silver mining in total employment are given by θTL and θSL, respectively. Thus, weak de-industrialization will result whenever the own wage in textiles is growing sufficiently fast compared to the own wage in silver and other commodity exports. Moreover, holding employment shares constant, weak de-industrialization will be most severe when the difference in own wage growth rates is largest, and this can only result when the external terms of trade boom (pS* > pT*), because, by assumption, w* is everywhere the same in the domestic economy. How much the terms of trade have to rise depends on β, γ, θTL, and θSL. As it turns out, the condition that must be satisfied for weak de-industrialization is

To the extent that β and γ are similar, and that (1 − θTL) > θSL, the ratio on the right-hand side will certainly be less than one. This implies that own wage growth in silver and other commodity exports would have to be even higher to counteract the weak de-industrialization effect of own wage growth in textiles.Footnote 75 In short, we expect to see weak de-industrialization whenever own wage growth in textiles is positive, unless own wage growth in commodity exports is much greater (e.g., when the external terms of trade deteriorates dramatically). Own wage growth in silver mining dampens the weak de-industrialization effect because it reduces LS, which is in the denominator of our weak de-industrialization measure. As the share of the labor force employed in silver, cochineal, and other commodity exports increases, the greater the growth in the own wage in textiles needs to be to overcome growth of the own wage in silver and other commodity exports, and thus for de-industrialization to ensue. We can also rewrite condition (11) to relate nominal wage growth to the terms of trade between textiles and silver.

Weak de-industrialization results when nominal wage growth, which deters production in both noncorn sectors, is sufficiently greater than the growth of the terms-of-trade favoring textiles, which encourages production in textiles over silver and other commodity exports. Thus, weak de-industrialization should have been most severe when nominal wage growth was strongest and when the terms of trade were shifting most strongly in favor of silver and other commodity exports.
In summary, the predictions of this neo-Ricardian model are: industrial employment (LT) will decrease if the own wage in textiles increases (strong de-industrialization); and the industrial employment share (LT/L) will decrease if own wage growth in textiles increases sufficiently faster than the own wage growth in silver and other commodity exports (weak de-industrialization).Footnote 76
TRENDS IN MEXICAN TERMS OF TRADE, 1750–1877
A rise in the terms of trade for a primary product exporter implies a fall in the relative price of import-competing manufactures, the bigger the rise, the bigger the penalty to home manufacturers. The timing and magnitude of such secular terms-of-trade shocks should have a powerful influence on de-industrialization experience. Mexico's increasing reliance on imported manufactures meant that as the world price of textiles, specifically, and manufactures, more generally, fell, Mexico's terms of trade improved. Relative textile prices certainly fell dramatically the world around up to the 1850s “as the Industrial Revolution drove down the unit cost of production in the exporting countries” and “as technological innovations shifted supply curves downward.”Footnote 77 But was that relative price decline less dramatic for Mexico?
Terms-of-Trade Trends Before 1828
For the half century before 1800, we estimate Mexico's terms-of-trade trends by simply plotting the ratio of silver to textile prices, PS/PT.Footnote 78 This estimate may seem crude, but we doubt that terms-of-trade reality deviated much from what is plotted in Figure 2. After all, silver exports accounted for more than three-quarters of total exports and textiles accounted for almost two-thirds of total imports (Table 1). For the period 1800–1828, we estimate the terms of trade, PX/PM by using the British export price index to proxy PM, and, as before, by using silver prices to proxy PX (section 4.1.2 in the Appendix). The price of textiles, PT, and the British export price index, PM, were highly correlated for those years, 1800–1828.
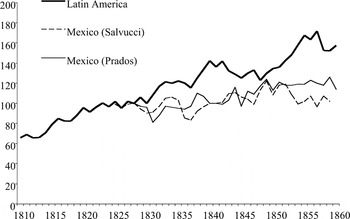
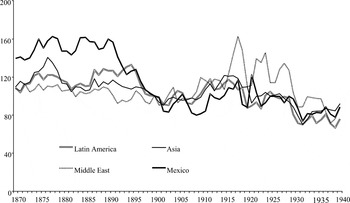
The Mexican external terms of trade estimates in Figure 2 suggest a surprising moral. De-industrialization or Dutch disease forces could not have been very strong during the half century before the change in Spanish policy around 1802, as the relative price of import-competing textiles did not fall. Rather, it rose. True, the terms of trade jumped up by 81 percent between 1802 and 1830, but, as we shall discuss in a moment, it was stable afterwards (Figure 2), and especially so when compared to the rest of Latin America (Figure 3). Mexican exceptionalism indeed! Of course, while the price of importable textiles fell relative to exportable silver after 1802, textile prices may have risen relative to nontradables. The Dutch disease literature reminds us that the terms of trade between tradables and nontradables can be at least as important as the external terms of trade, and we will explore this issue at length. For now, we simply note that Mexico failed to undergo the same kind of external terms of trade boom between 1750 and 1830 that the rest of the periphery did, and also that the boom was limited to the two or three decades after 1802.Footnote 79
TERMS-OF-TRADE TRENDS MEXICO VERSUS LATIN AMERICA, 1810–1860 (1828 = 100)

Terms-of-Trade Trends after 1828
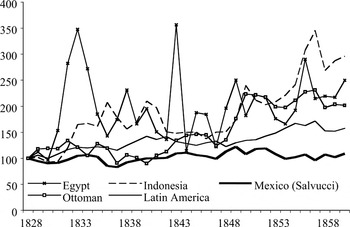
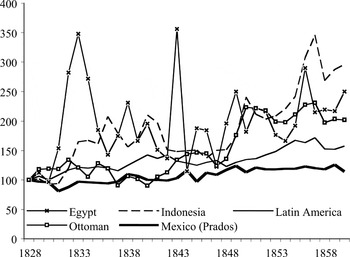
Although primary product export prices were on a steep rise almost everywhere in the periphery in the first half of the nineteenth century, it appears that Mexico missed much of the boom (Figures 3, 4A, 4B).Footnote 80 Over the full half century between 1828 and 1881, Leandro Prados estimates that Mexico's terms of trade did indeed rise, and at 1.4 percent per annum.Footnote 81 However, all of that increase appears to have taken place after mid-century, as there was no upward trend in Prados's terms-of-trade series between 1828 and the early 1840s (Figure 3).Footnote 82 The Salvucci index of Mexican terms of trade (with the United States, the United Kingdom, and France combined) starts in 1825, and it confirms the Prados series. Indeed, the Salvucci series drops in the 1850s back to the levels of the late 1820s (Figure 3). How did Mexican terms-of-trade movements up to mid-century compare with those of the rest of the periphery, including the rest of Latin America? Figures 4A and 4B document the secular boom in the terms of trade across the poor periphery.Footnote 83 Between 1820–1824 and 1850–1854, the terms of trade in Latin America rose at 1.4 percent per annum, implying that Dutch disease forces were much weaker in Mexico than elsewhere in Latin America, perhaps even absent. The story is repeated when comparisons are made with other parts of the poor periphery: Egypt's terms of trade rose at 2.7 percent per annum between 1820–1824 and 1855–1859; the terms of trade for the Ottoman Empire increased by 2.4 percent per annum between 1815–1819 and 1855–1859; and Indonesian terms of trade increased by 2.5 percent per annum between 1825–1829 and 1865–1869. The least dramatic rise in terms of trade was in India between 1800–1804 and 1855–1859, when they rose at about 0.5 percent per annum, but even this was more than in Mexico.Footnote 84 In addition, Mexico appears to have been exceptional relative to the poor European periphery, having undergone a less dramatic terms-of-trade boom up to the 1860s compared with Spain, Italy, and Russia.Footnote 85
TERMS-OF-TRADE TRENDS 1828–1860: MEXICO (BASED ON SALVUCCI) VERSUS OTHER PERIPHERY

TERMS-OF-TRADE TRENDS, 1828–1860: MEXICO (BASED ON PRADOS) VERSUS OTHER PERIPHERY

What accounts for the relatively weak terms-of-trade boom in Mexico? It cannot be explained by a less dramatic fall in import prices, as every member of the poor periphery imported pretty much the same products (dominated by factory-made manufactures from Europe). Rather, the explanation lies with export prices, namely, silver prices, which were stable during a period when other primary product prices soared.
In summary, globalization-induced de-industrialization forces were relatively weak in Mexico between independence and the Porfiriato. Thus, Mexican manufactures should have been in a stronger competitive position than those of the rest of a poor periphery where de-industrialization was more dramatic. Whether their competitive position was strong enough to repel or only retard the advance of invading foreign manufactures is, of course, another matter entirely.
WAGE COMPETITIVENESS AND OTHER FORCES
Food Productivity and Wage Competitiveness
It appears that de-industrialization forces were less pronounced in Mexico than in the rest of the poor periphery. Part of the explanation lies with the much weaker Mexican terms-of-trade boom, price trends that minimized the penalty which import-competing manufacturing had to absorb. But were there other underlying causes of this Mexican exceptionalism? One possibility might have been relatively stable agricultural productivity, an event that would have kept the price of nontradable foodstuffs from rising too fast. We are not denying that agricultural productivity and living standards were low in Mexico: indeed, as early as 1822 Alexander von Humboldt argued that Mexican agricultural productivity was low compared to that in Western Europe. But we are not talking about levels; rather, we are talking about trends. Nor do we assert that there were no agrarian crises over those 150 years, but only that they were less deep and frequent than elsewhere. Our hypothesis is that the absence of any secular deterioration in agricultural labor productivity would have implied no upward pressure on the nominal wage from this source, and that import-competing manufacturing would have had a better chance of maintaining its wage competitiveness with foreign producers. What are the facts?
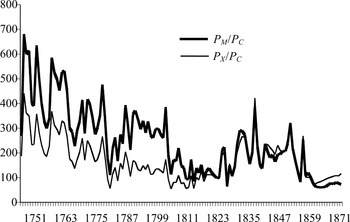
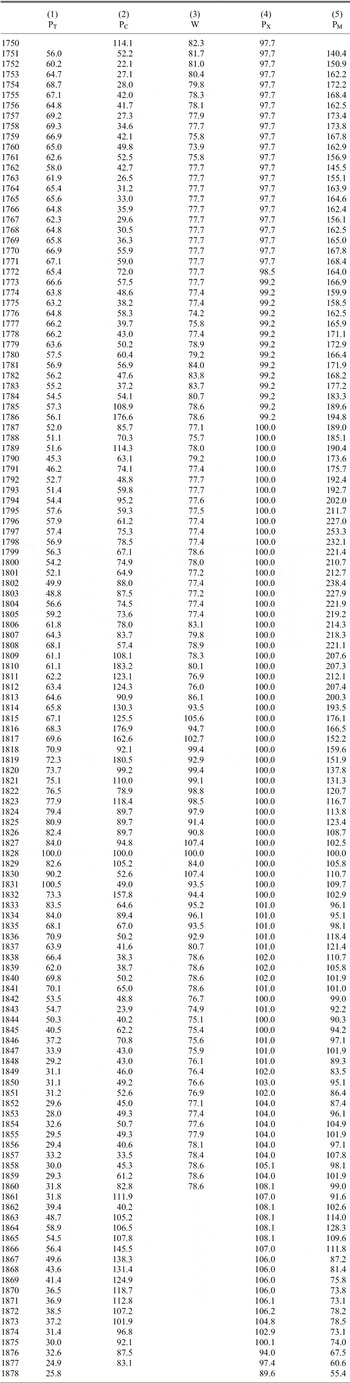
Let us start with the trend in relative commodity prices. Figure 5 plots PM/PC and PX/PC, that is, the price of exports and imports relative to the key nontradable (PC). These relative price trends trace out two distinct epochs. First, there was the dramatic decline in the relative price of tradables in the 60 or 70 years up to the Insurgencia and independence. This decline penalized both the mining export industry and the textile import-competing industry, helping to contribute to de-industrialization by pulling resources out of manufacturing (and mining) and into agriculture. Note that the external terms of trade did not rise over this period (Figure 3), so it was not a source of de-industrialization. But the rise in the price of corn relative to silver and textiles was a de-industrialization source, and it looks as though it was powerful. But how powerful depended critically on what was happening in textiles-exporting England and India, something we shall explore below. In any case, it is obvious that we need to know a lot more about the agrarian crises that pushed up corn prices during this epoch.Footnote 86 The second epoch begins when that secular decline flattened out in the 1810s and turned around in the 1820s. Over the half-century before the Porfiriato, there was one big cycle but no trend: there was a rise in PM/PC and PX/PC up to around 1850, an event that favored both mining and industry, and a fall thereafter. In fact, the historiography suggests that after independence more people had access to land, and that there was an increase in the cultivated land area. Between 1821 and 1870 there were no famine episodes like those that took place earlier between 1785/86 and 1809/10. Trends in land values in Michoacán and sugar production in Morelos suggest that there was a recovery in agricultural production from 1821 to 1851 that was followed by a period of stagnation from 1851 to 1875.Footnote 87Figures 2 and 3 show that the post-1810s were also years of rising external terms of trade (albeit, much more modest than elsewhere in the poor periphery), events that penalized Mexican manufacturing and contributed to de-industrialization (albeit, much more modestly than elsewhere in the poor periphery). But trends in the internal terms of trade with agriculture had the opposite influence, and it looks as though it may have dominated.
THE PRICE OF TRADABLES RELATIVE TO NONTRADABLE CORN IN MEXICO, 1751–1877 (1828 = 100)

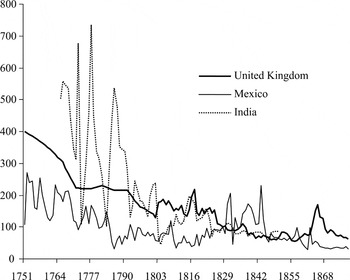
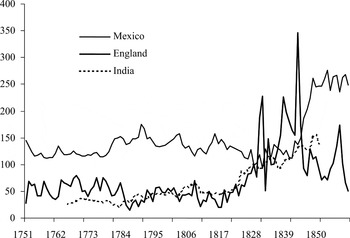
Next, what happened to the corn price of textiles (PT/PC) in Mexico relative to its main competitors, England and India? England was undergoing impressive improvements in agricultural productivity at this time, events that should have cushioned the fall in PT/PC there, kept the upward pressure on the nominal wage modest, and, therefore, maintained English wage competitiveness. Did they, at least compared to Mexico? Figure 6 plots PT/PC for England, India, and Mexico. The result is surprising: after about 1810, the relative price of textiles fell faster in England and India than it did in Mexico! Thus, while the rise in grain prices tended to lower the relative price of textiles in all three countries, the grain price rise was bigger in England and much bigger in India. Note that the explanation for this cannot be faster productivity growth in English factories (although it certainly was faster), because textiles were internationally traded and textile prices moved the same way the world around. Thus, the explanation must lie with local productivity events in agriculture, where the most important nontradable commodity was produced. The fact that the relative price of textiles fell (the relative price of grain rose) faster in England than it did in Mexico is especially notable when compared with India where a collapse in agricultural productivity after the mid-late eighteenth century produced a spectacular rise in the relative price of grains, generated immense upward pressure on the nominal wage, and contributed to diminished wage competitiveness in Indian textiles.Footnote 88 While a lagging agriculture pushed up the relative price of foodstuffs in England, India, and Mexico, it was far less dramatic in Mexico.Footnote 89 As all three countries were competing with the rest of the world for textile market shares at home and abroad, Mexico appears to have been relatively favored by a more modest rise in PC. Of course, the fact that Britain took the technological lead in textiles gave it a big edge in world markets. But the point of Figure 6 is that there were other (domestic) forces that partially offset the British de-industrialization impact on Mexico.
THE GRAIN PRICE OF TEXTILES, MEXICO VS ENGLAND AND INDIA, 1751–1877 (Pt/Pc 1828 = 100)

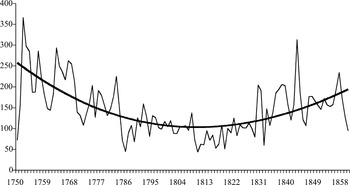
Figure 7 shows quite clearly that there were other forces at work eroding Mexican grain wages causing them to fall quite steeply from the mid-eighteenth century until the 1810s. The downward trend in real wages just before independence speaks badly for the impact of late colonial conditions on the working poor, and the upward trend after about 1820 speaks well for the impact of independence on them. That pre-1820 fall should have strengthened wage competitiveness in textiles, while the post-1820 rise should have eroded it, at least to the extent that productivity growth in Mexican textiles was modest compared with that of England. Indeed, Figure 8 shows that while the own wage in textiles (w/PT) was very stable in Mexico up to the late 1830s, it doubled from then to the 1850s. If we are looking for domestic de-industrialization sources, we have found them here in the three decades or so between the 1820s and 1850s.
MEXICAN GRAIN WAGES (W/PC), 1750–1860

OWN WAGE IN MEXICAN, ENGLISH, AND INDIAN TEXTILES, 1751–1860 (w/Pt 1828 = 100)

To summarize, from 1751 to about 1810, w/PT showed no trend in any of the three countries: Mexico maintained wage competitiveness with both England and India. Thus, while Mexican textiles may have increasingly lost its competitive edge in domestic markets by lagging behind in adapting modern technology, at least the industry did not make matters worse by undergoing a rise in its own wage (w/PT). Between about 1810 and 1840, Mexican wage competitiveness improved relative to that of England and India, helping domestic industry deal with de-industrialization forces coming from world markets. After about 1840 Mexico lost all the relative wage competitiveness it had gained. During the century 1750–1877 as a whole, the combination of strong wage competitiveness and weak terms of trade effects minimized de-industrialization in Mexico relative to the rest of the periphery.
WHY DID NOT MEXICAN MANUFACTURES COMPETE EVEN MORE EFFECTIVELY?
Was Mexico's inability to compete more effectively with foreign producers before the 1820s, and perhaps even before the 1850s, due to the fact that Mexican wages were too high (even though their growth rates were not)? Of course! After all, Mexico and the rest of Latin America had a comparative advantage in primary products because they were relatively abundant in land and natural resources compared to Europe, and they had a comparative disadvantage in manufactures because they were relative scarce in labor compared to Europe. Thus, import-competing textiles and other manufactures should have faced heavy competition from European imports, just as Europe should have faced heavy competition from American grains, fish, metals, dyes, and other resource-intensive products. But what this article confronts is the significant decline in the relative importance of industry in the Mexican economy (e.g., de-industrialization), not its low levels of industrial activity dictated by initial comparative advantage.
Another common explanation offered for Mexican industry's inability to compete more effectively is its low labor quality and the culture of its labor market: “In the largest republics (Brazil and Mexico) the primary-education system remained woefully inadequate, forcing employers to rely on a work force with virtually none of the attributes required for technical progress and innovation.”Footnote 90 This claim assumes that textile production required a lot of skilled labor, something other authors, such as Gregory Clark, have questioned at length.Footnote 91 Indeed, before the 1840s and the great mass migrations to the New World, New England firms hired unskilled (but literate) native-born girls, and afterwards they hired unskilled (and illiterate) European immigrants. Because the New England example can be easily multiplied by reference to early factory-based textile development in Catalonia, Japan, India, and even Britain, one is left wondering how the low-labor-quality hypothesis could help explain any lack of industrial competitiveness in Mexico or, indeed, its exceptionalism. It bears repeating that while skilled labor was certainly scarce in Mexico, things were no better anywhere else in the periphery, including the Ottoman Empire, Russia, India, and the rest of the poor periphery. And if Mexican labor was of such low quality, why did the textile industry survive foreign competition better than elsewhere in the poor periphery?
Alternatively, it has been suggested that “Mexican cotton manufacture suffered from technological [backwardness], which limited its capacity to supply the market and vitiated its ability to compete.”Footnote 92 This sounds very much like a culture-of-the-labor-market thesis whereby Mexico was unable to compete more effectively because Mexican labor resisted the introduction of the new hard-driving technologies. Although domestic producers certainly faced some severe competitive disadvantages due to poor labor quality and technological backwardness, the literature suggests that the main reason for its relative demise was the increasing productivity abroad, which induced a relative decline in manufacture's prices world-wide. To that extent, Mexican de-indus-trialization must have depended on when and how much the relative price of manufactures fell. The most dramatic de-industrialization should have occurred when the relative price of textiles and other manufactures was falling most dramatically in world markets (and thus in Mexico), and that was between 1810 and 1850.
Historians have always added politics and policy to the explanations for Mexican de-industrialization and for troubles in domestic textiles. Thus, even after accounting for the many reasons why Mexico was unable to compete with foreign producers between 1810 and 1850, Aurora Gómez-Galvarriato argues that domestic textiles were not necessarily inherently uncompetitive, they just needed support from the government and a stable political environment in which to develop. According to this view, the Mexican government failed to take the steps needed to protect domestic industry, so that textile producers were not able to compete successfully with imports. If, however, the government had moved to subsidize and protect the textile sector, it would have had a chance to develop the skills and efficiency necessary to compete successfully with foreign imports after the subsequent removal of the tariff wall. This infant industry argument certainly had become very popular with Alexander Hamilton's followers in the United States and with Frederick List's followers in Germany. After all, government support of industrial development in the form of financial assistance and protective tariffs has always been considered crucial for the American textile industry take-off.Footnote 93 Support for it in Mexico comes from the fact that when the government there finally did take an interest in protecting and developing textiles, the industry did show strong signs of resisting import competition. Only “when political instability was briefly surmounted during the 1830s and 1840s, [did] the mechanization of the industry finally take place” and it occurred with the “support of government policies that gave [the sector] both the necessary protection and the financial support required, through the creation of a development bank: the Banco de Avío.”Footnote 94
Many scholars share this infant industry view. After all, without active state intervention private interests would have had little incentive to invest in local industry given that foreign competition had already deeply penetrated the market. Guy Thomson feels that once foreign competition grew too intense, Mexican merchants were reluctant to invest in restructuring the cotton textile industry:
Demand for New Spain's cotton cloth became ever more volatile as a result of trade liberalization (comercio libre) within the Empire (increasing competition from Catalan cottons), increased contraband from without, Spain's involvement in the Napoleonic wars, and the licensing of neutral powers to trade directly with the Indies (chiefly, the United States).Footnote 95
In other words, only a deliberate government program could have forced Mexican textiles to modernize; economic agents were not going to do it alone given the costs, uncertainty, and risks. According to this view, protective tariffs starting in the 1820s and subsidies to mechanization starting in the 1830s were central to improving manufacturing competitiveness and offsetting the de-industrialization forces coming from abroad.
TARIFFS AND OTHER PRO-INDUSTRIAL POLICIES
We have argued that Mexican exceptionalism can be explained in part by modest terms-of-trade gains and weak Dutch disease effects. We have also argued that it can be explained in part by the maintenance of wage competitiveness. Does policy offer a third explanation? After all, independence gave Mexico the autonomy to choose tariff and industrial policies that most of the periphery did not have.
Early Anti-Industrial Policy
Coherent pro-industrial trade policy was not typical of any periphery country during the nineteenth century. One reason is that revenue needs dominated. So it was that tariff revenues were the most important source of income for the Mexican federal government. Import duties accounted for about half of federal revenue between 1825 and 1845.Footnote 96 Given that textiles represented between 60 and 70 percent of total imports from 1821 to 1830 (Table 1), tariffs on foreign textiles obviously generated critical fiscal resources.
Some time ago, Robert Potash noted that Mexican tariffs in the 1820s were designed primarily to increase government revenue instead of directly protecting domestic manufacturers, and this has been confirmed by many scholars since. For example, “the first law to regulate the foreign trade of the new Mexican Empire” passed 15 December 1821 imposed an ad valorem tax of 25 percent on all imports, regardless of their nature.Footnote 97 As the primary goal was to generate revenue, imported cotton textiles were not taxed at higher rates than other goods. Victor Bulmer-Thomas also stresses that the motivation behind early Mexican tariffs was the need to generate revenue, not some desire to protect infant industries.Footnote 98 This view has been confirmed more generally for all of Latin America before the 1860s.Footnote 99
What is harder to explain, however, is the Mexican government's decision to prohibit a small number of items from being imported altogether, especially since “of the nine categories of excluded items, three were related to the … manufacture of cotton [textiles]: cotton, cotton yarn up to weight number sixty, and cotton ribbon were barred from importation.”Footnote 100 These prohibited items were mostly inputs into textile production. Indeed, raw cotton accounted for two-thirds of the total cost of cotton cloth, while the share was even higher for cotton yarn.Footnote 101 Obviously, this policy could hardly have helped the domestic producer because it lowered the effective rate of protection on textiles, perhaps even erasing its protective impact entirely. Perhaps the only legislation that offered some net protection was the fact that domestic cotton and woolen textiles were exempted from the 4 percent increase in the sales tax (up from 8 to 12 percent) which was imposed on foreign textiles.Footnote 102
The Gradual Move to More Pro-Industrial Protection
Mexican tariff policies became more obviously protectionist when Guadalupe Victoria became president in 1824. Victoria eliminated the 12 percent duty on foreign goods and replaced it with the higher derecho de internación, a duty of “18 ¾ percent of the value of imported articles … levied when they left the port of entry for any interior destination.”Footnote 103 Moreover, state governments were allowed to impose an additional 3 percent tax:
(derecho de consumo) on foreign goods sold within their respective jurisdictions. Imported merchandise thus paid a series of duties, state and federal, which totaled 51 3/8 percent of their appraised value. Domestic textiles, in contrast, were subject only to the state alcabala of 8 percent.Footnote 104
Under the tariff act of 1827, a single ad valorem tax of 40 percent was placed on all imports, an effective strategy in terms of short-term revenue collection as well as offering high protection for domestic manufactures.
Puebla textile producers certainly had political clout, but their demand for a prohibition of ordinary cloth imports had to be counterbalanced by the loss of state revenue that the prohibition would have generated.Footnote 105 Thus, while the government did set relatively high tariff barriers, it did not comply with Puebla's demands for the prohibition on ordinary cloth imports. The protection they got was not enough to erase the difficulties facing Puebla's textile producers from sharply falling world prices, and social unrest increased. Two riots of unprecedented scale and duration erupted in Puebla during December 1828, events which finally precipitated a pro-industrial policy shift.Footnote 106 On 22 May 1829, Vicente Guerrero signed into law a bill prohibiting the importation of coarse cotton and wool textiles—a measure unambiguously designed to protect domestic industries as opposed to just generating revenues. Thus, “for the first time since independence, an outright ban was placed on the entry of inexpensive cotton textiles.”Footnote 107 Of course, there was a big gap between legislated prohibition and smuggled reality. Indeed, by the 1840s there was a widespread contraband trade, and smuggled European cottons were displacing Mexican textiles.Footnote 108 The size of this contraband trade was not trivial.
First Best Principles: Subsidies and the Move to Mechanization in the 1830s
The replacement of Guerrero by Anastasio Bustamente in 1830 marked a shift in the tactics but not in philosophy. Indeed, the new administration moved to more efficient methods for encouraging better industrial performance, that is, from tariffs to direct subsidy. This was done by dropping the prohibitions on cotton textile imports, imposing modest tariffs in their place, and using a portion of the revenue to subsidize the textile industry. This industrial strategy was illustrated most clearly with the creation of the Banco de Avío in October 1830, the state development bank funded by tariff revenues, which granted loans for the purchase of industrial machinery, particularly in textiles.Footnote 109 The goal of the bank was to replace rather than preserve the inefficient handicrafts industries: “The Banco de Avío was the first to stipulate that industrial companies should receive loans and machinery, the first, in short, that fixed the establishment of the factory system as its goal.”Footnote 110
Potash thinks that the Banco de Avio accomplished its objective: “the bank contributed directly to the establishment of some half-dozen spinning and weaving factories” and helped make possible the rapid development of a modernized cotton textile industry in the decade 1835–1845.Footnote 111 Still, it is noteworthy that most of the investment came from private sources: total investment in the textile industry during this period was 10 to 12 million pesos, of which only about $750,000 (less than a fifth) came the Banco de Avío.Footnote 112
Potash's optimistic assessment of the impact of the Banco de Avío and the stage of Mexico's textile industry in the 1840s is eroded still further by evidence that he himself cites. The government issued a decree in March 1837 banning the importation of foreign yarn and tejidos ordinarios de algodón (ordinary cotton textiles). Another tariff act was passed in 1843 that excluded all cotton cloth having fewer than 30 threads per 0.98 inch square and placed an ad valorem tariff of 30 percent on other imports, up from 25 percent. The list of prohibited goods was also extended by some 180 items. These protective measures introduced in the late 1830s and early 1840s do not suggest a healthy and flourishing industry, but rather one in trouble. Still, one should set this policy response in comparative perspective. Tariff policy in the rest of the autonomous periphery was equally, if not more, protectionist. For example, U.S. northern manufacturing interests had lobbied to raise tariffs to about 52 percent on dutiable imports in 1830, before an angry export-oriented South demanded a compromise at a lower, but still high, range of 30 to 40 percent on dutiable imports.Footnote 113 Things were much the same in Australia, New Zealand, and Canada,—as well as the United States in the 1840s, Catalonia between the 1830s and the 1860s, and late Meiji and early Taisho Japan.Footnote 114
What about the effective rate of protection? The prohibition on raw cotton imports—a sop for domestic cotton growing interests—remained unchanged through all these years, and it posed a serious constraint on industrial development.Footnote 115 From 1841 onwards, Estevan de Antuñano, Mexico's most important industrialist, wrote numerous newspaper articles, pamphlets, and letters to the President and the Congress, every time more desperate, explaining the terrible effects that the prohibition of raw cotton imports was having on the textile industry.Footnote 116 In 1843 Lucas Alamán, then chairman of the Dirección General de la Industria Nacional, pleaded that the national cotton crop was not sufficient to supply established factories. Domestic cotton prices rose up through the 1840s—partially because of the prohibitions, and partially because of crop failures, labor shortages and the unsuitable climate for growing the cotton needed for mechanical spinning.Footnote 117 To make matters worse, the increase in raw cotton prices induced the government to grant licenses for the import of raw cotton, which in turn led to a monopoly for raw cotton suppliers. The predictable result was an “inadequate, irregular and costly supply of raw cotton became a major obstacle preventing the cotton textile industry from … competing successfully with imports.”Footnote 118 It became clear that it had been a wrong policy, but one difficult to change. After all, the many short-lived governments that Mexico had during that period were too busy solving urgent fiscal, political, and military problems to think carefully about long-term development projects and policies.
Although imports were always a significant threat to domestic producers, the fact of the matter is that imports did not rise during the 1830s and early 1840s. Whatever the inadequacy of protectionist policy, foreign competition was not enough to shut domestic producers down.Footnote 119
Tariff Policy after 1850
Dawn Keremitsis continues the story of Mexican tariff policies where Potash leaves off by describing the rise of the liberals in the 1850s and the consequent end of the protectionist philosophy that characterized the second quarter of the century.Footnote 120 The political economy of conservative Lucas Alamán (the brain behind Banco de Avío) was replaced by a new view, proposed by Miguel Lerdo de Tejada, favoring the liberalization of trade by reducing tariffs and the promotion of Mexico's comparative advantage in mining, agriculture and other primary products.Footnote 121
There was a substantial reduction in the tariffs on cotton manufactures in 1856.Footnote 122 The ad valorem tariff on manta declined steeply from 76.9 percent in 1855 to 23.1 percent in 1856.Footnote 123 However, these new, liberal policies did not have the strong negative impact on the industry that the literature has generally assumed, because the prohibition on raw cotton was replaced by an ad valorem duty of around 9.5 percent.Footnote 124 Thus, the effective rate of protection for the industry did not necessarily decline steeply, or even at all. Because raw cotton accounted for between 48 and 72 percent of cotton textile costs, the liberal tariff structure (which allowed the import of much cheaper raw cotton) reduced input costs to domestic cotton textile producers by 23 to 35 percent. In the first case, costs would have fallen less than prices, implying that profits should have fallen by 7.1 percent, penalizing domestic textiles. In the second case, however, costs should have fallen more than prices, implying that profits should have increased by 4.8 percent, rewarding domestic textiles.Footnote 125 The average of these two figures implies a very small penalty. Furthermore, while tariffs fell in 1856, they rose thereafter. Also, the number of products paying duties rose from 293 in 1845 to 524 in 1856 and to 775 in 1872. In addition, Mexican states with textile industries raised their tax on all manta crossing each state's border, generally an 8 percent duty, and imposed an additional tax on foreign products (14 percent for the state of Puebla).Footnote 126
In short, despite the free trade rhetoric, “liberal” policies after 1856 were probably not any worse for industrial development than the “protectionist” policies had been before.Footnote 127 Thus, policy autonomy is a necessary but not a sufficient condition for effective pro-industrial and progrowth policy. Postindependence political instability, civil violence, and foreign invasion did not provide an environment for good industrial policy. Mexican governments were driven by the short-run needs of survival, thus making them easy prey for short-sighted and self-centered interest groups. So, while Mexican governments were able to give domestic industry some effective protection from foreign competition—something colonial regions elsewhere in the periphery could not offer, it was not enough to matter as much as did the external terms of trade and wage competitiveness.
MEXICO IN A COMPARATIVE MIRROR
Imports satisfied a significant part of the total Mexican textile demand in the 1870s. Mexico imported 40 million square meters of cloth in 1879, compared with 60 million square meters produced domestically. That is, foreign textile imports claimed 40 percent of the Mexican market (Table 4). Yet, these same data imply that domestic producers were able to claim 60 percent of the local market, a much bigger number than that for India in 1887 (35–42 percent) or the Ottoman Empire in the early 1870s (11–38 percent). Thus, by the 1870s, the Mexican textile industry was doing quite well compared with that of the rest of the poor periphery.
What accounts for this Mexican exceptionalism? This article uses a neo-Ricardian three-sector model to help decompose the sources Mexican industrial experience in the century before 1877 in to three forces: first, the terms of trade and Dutch disease effects were weak—compared with the rest of the periphery; second, based on a better relative agricultural productivity performance over time, Mexico maintained better wage competitiveness vis a vis the core—compared with the rest of the periphery; and third, Mexico had the autonomy to devise policies to foster industry—something the rest of the periphery did not have the autonomy to do. Regarding the third force, Mexican tariffs may have been high but they were not high by the standards of other autonomous nations: Mexican average tariffs in 1870 were 16 percent versus 25.6 percent for the rest of Latin America, and 40.9 percent for the United States.Footnote 128 In any case, over the century before the Porfiriato, we think that weak terms of trade shocks and strong wage competitiveness were much more important than were tariffs.
What about after 1877? Stephen Haber thinks the true liftoff of Mexico's textile industry came only in the late 1880s. A half century after Mexico's initial mechanization efforts, the 1888 industry was, according to Haber, still small and unproductive (although bigger and more productive than elsewhere in the poor periphery). But in the decade that followed:
the industry more than doubled in size. By 1911, the industry had grown an additional 50 percent. Estimates of total factor productivity (TFP) growth … indicate increases of between 1.5 percent (lower bound) and 3.3 percent (upper bound) per year. Labor productivity grew even faster …… between 3.0 and 4.7 percent per year.Footnote 129
Such growth rates meant that Mexican textile producers had displaced most imported cloth by 1914.Footnote 130 The only foreign textiles still being imported were high quality, fine-weave cloth.
What explains the timing and the pace of the lift off? Based on what we have learned about the century before the Porfiriato, it seems to us that there are three likely candidates: first, a secular decline in the terms of trade facing the Mexican economy, price trends that no longer penalized local manufacturing; second, the possibility of importing cheaper foodstuffs, making for improved wage competitiveness in manufacturing; and third, a more effective pro-manufacturing tariff policy. It seems to us that mainstream historiography greatly exaggerates the impact of policy while ignoring the terms of trade and wage competition. For example, Graciela Márquez has argued that the introduction of a modern pro-industrial policy and a coherent structure of protection mattered most.Footnote 131 Haber appears to agree: “In 1891 Mexico was using tariffs to protect the cotton textile industry,” which perhaps would have otherwise been uncompetitive. “This meant high tariffs on competing goods and low tariffs on inputs. The tariff on imported cloth tended to be twice that of the tariff on imported raw cotton. The result was an effective rate of protection that varied from 39 to 78 percent.”Footnote 132
We do not deny that policy mattered, and that Mexican policy led the way in Latin America. But should not world prices and the terms of trade have mattered as well? As we have seen, a good part of Mexican exceptionalism in the century before 1877 can be explained by a far weaker terms-of-trade shock (and weaker Dutch disease effects) compared to the rest of Latin America, Asia, and the Middle East. Could the same be true of the half century after 1877, but in reverse sign? Figure 9 suggests the answer might well be yes. There we see that the Mexican terms of trade fell after the 1880s much more sharply than they did elsewhere in the poor periphery. Indeed, the Mexican terms of trade were cut in half between 1890 and 1902, twice as much as the rest of Latin America. If that fall was driven by world market events outside Mexico, it implied a rise in the price of imported manufactures relative to mining exports, an event that should have favored industrialization. If, instead, the decline in Mexican export prices was driven by rapid productivity advances in Mexican mining, and if the price elasticity of demand for exports was greater than unity, then industrialization would have been driven by an export boom rather than by any diminution in the Dutch disease forces that characterized so much of the pre-Porfiriato period.Footnote 133 In addition, what about the “invasion” of world markets by cheap foodstuffs from the United States, Russia, and Canada? To the extent that Mexican policy allowed even a modest grain invasion, would not this have put downward pressure on nominal wages, thus making Mexican manufacturing more competitive? It seems to us that these relative price movements may have accounted for much of Mexican exceptional industrialization experience between the 1870s and the Revolution. We intend to pursue this hypothesis in future work, and, once again, we will do so by comparing Mexico with the rest of the periphery.
TERMS-OF-TRADE TRENDS, MEXICO VERSUS REST OF PERIPHERY, 1870–1940 (1900 = 100)

Appendix
This appendix describes the sources of the wage and price data used in the analysis underlying the general equilibrium price dual model. Every price and wage series was converted in to common currency (typically pesos, and 8 reales = 1 peso) and quantity units before linking them together for the 1750–1878 series. The following definitions and notation, taken from the model exposition in the text, are used in this Appendix: PX = export price, PM = import price, PC = price of nontradable grains (corn), PT = price of import-competing manufacturing textiles (usually cotton and usually cloth), and W = nominal wage rate (daily, urban unskilled peón).
1. MEXICAN TEXTILE PRICES 1751–1878 (PT: Appendix Table 1, col. 1)
1.1 1751–1777: We were unable to find any useable Mexican textile price quotes before 1778. Because Spain was the main foreign supplier of textiles to Mexico (e.g., Nueva España), and because transport costs on the westward leg of the Atlantic trade were quite stable during mid-eighteenth-century peacetime years, we take these prices series as proxies for Mexican PT 1751–1777. We use an average of two Spanish cloth price series: Palencia (now in Castila and Leon) textile prices, where PTP is the average of linen, and two woolen price series (Moreno, “El nivel de vida”: made available by the author); and Madrid textile prices, where PTM is the average of estameña, sayal and paño blanco prices (Hamilton, War and Prices: supplied by Joan Rosés. See also 4.1 below.)
1.2 1777–1878 Benchmarks: Here we use scattered wholesale price quotes for manta cloth per vara from Guadalajara, Mexico City, Puebla and Oaxaca to establish prices in benchmark years = series A. These benchmark years are: multi-observation averages for 1777 (3), 1831 (3), 1836 (4), 1843 (4), 1850 (3), and 1867 (4); and single observations for 1787, 1803, 1809, 1810, 1827, 1834, 1835, 1839, 1842, 1845, 1857, 1859 and 1867. Sources for prices: 1777, 1787, 1803, 1810, 1827, 1834, 1836, 1842, 1843, 1847, and 1867 (Thomson, Puebla de los Angeles, p. 373); for 1781, 1782 and 1804 (Miño, Obrajes y Tejedores, pp. 231 and 235); for 1800, 1835, 1836, 1839, 1843, 1845, 1847, 1853 (Walker, Parentesco); for 1809, 1836, 1839, 1842, 1843, 1845 (Potash, Mexican Government, p. 163); for 1843 (Dirección de Agricultura e Industria, “Memoria 1843”; Bazant, “Estudio sobre la productividad”); for 1850 (Banco Nacional de Comercio Exterior S.A., Los Industriales and El Comercio Exterior); for 1859 (Butterfield, United States and Mexico); for 1867 (Herrera, El Comercio Exterior, p. 38); for 1871 (The Two Republics, 9 December 1871: p. 2); for 1874–1877 (La Colonia Española, 1 February 1874, 1 March 1875, 15 February 1876, and 30 June 1877); for 1877 (Keremitsis, La industria texil, p. 71). Notes for prices: Prices are stated in pesos per vara. One piece of cloth may have measured between 30 and 36 varas, but we assumed the piece to be equal to 32 varas following Bazant (“Estudio sobre la productividad”): 1 vara = 36 inches = 0.8359 meters.
1.3 1777–1878 Interpolations and Projections: The next step was to interpolate between the benchmark years.
1.3.1 1777–1827: For the period 1777–1827, we used the PTP data for interpolations. Thus, for 1777–1787, 1787–1803, 1803–1809, and 1810–1827: (1) we computed a geometric (exponential) trend between the benchmark years in the A series (see above in 1.1); (2) we then computed percent deviations from geometric trend between same years in the PTP series; finally, we applied the percent deviations from (2) to the trend in (1). Thus, we preserve the Mexican benchmarks and the implied trends between them, but infer (unobserved) short-run movements between them from the volatility in the Spanish series. Prices for the following years were ignored because they were ones during which there was a war-induced shut down in trade: 1781, 1797/98, 1800/01, and 1805/06. Instead, we interpolated those war years. The year 1812 was retained because the shock was induced by the Insurgencia, not European conflict.
1.3.2 1827–1877: For the period 1827–1877, we interpolated using unit values of British cotton textile exports reported in the Parliamentary Papers = PGB. Thus, for 1827–1831, 1831–1834, 1836–1839, 1839–1842, 1843–1850, 1850–1857, 1859–1867, and 1867–1877: (1) we computed the geometric (exponential) trend between benchmark years in the A series; (2) we then computed percent deviations from the geometric trend between the same years in the PGB series; finally, we applied the percent deviations from (2) to the trend in (1). Thus, we preserve the trends between Mexican benchmarks, but infer (unobserved) short-run movements between them from the volatility in the British price series. For 1843–1845 and 1857–1859, we interpolate the middle year by using geometric trend between these years.
1.3.3 The 1878 observation is constructed by projection from the 1877 observation (see above in 1.1), using series PGB.
1.4 Linking the results of 1.1–1.3 yields the PT series 1750–1878 (1828 = 100).
2. MEXICAN GRAIN PRICES 1750–1877 (PC: Appendix Table 1, col. 2)
2.1 Corn prices 1750–1810: Reales per fanega, wholesale prices quoted in Mexico City markets (Garner, Economic Growth).
2.2 Maize prices 1810–1833: Reales per fanega (estimated from Thomson, “Traditional and Modern Manufacturing”).
2.3 Maize prices 1833–1863: Reales per fanega, wholesale prices quoted in Comanja and Leon, annual averages (Brading, Haciendas, p. 332).
2.4 Maize prices 1863–1877: We have prices for arroz, frijol and maize 1859–1877 (from Amilcar Challu's ongoing research on eighteenth and nineteenth century living standards in Mexico), but use only maize prices to be consistent with earlier corn and maize price series.
2.5 Linking the results of 2.1–2.4 yields the PC series 1750–1877 (1828 = 100).
3. MEXICAN UNSKILLED, URBAN WAGES 1750–1860 (W: Appendix Table 1, col. 3)
3.1 Peón obra wages 1750–1838: Reales per day, collected by Amilcar Challu for his ongoing research on eighteenth- and nineteenth-century living standards in Mexico. The data here refer to his “all Mexico—peons, sobrestante, and official” series.
3.2 Peón obra wages 1838–1860: Reales per day, multiple observations taken from the records of convents, hospitals and other institutions. Also collected by Amilcar Challu.
3.3 Linking the results of 3.1 and 3.2 yields the W series 1750–1860 (1828 = 100). Thus far, we have been unsuccessful in finding nominal wage rate data 1860–1878.
4. MEXICAN PRICES OF TRADABLES 1750–1940 (PX, PM and PX/PM: Appendix Table 1, cols. 4 and 5)
4.1 1750–1828:
4.1.1 PM 1750–1800: As a proxy for (unobserved) Mexican PM, we used the average of the two Spanish textile price series, quoted for Palencia and Madrid. For Palencia (PTP: 1750–1800), we took the average of linen, and two woolen, price series. We interpolate geometrically to fill in missing years. These three textile price series are highly correlated. For Madrid (PTM: 1751–1800), we took the average of estameña, sayal and paño blanco prices to construct a Madrid cloth price (Bona, Anuario 1868: supplied by Hector Garcia). It turned out that because PTM and PTP were so highly correlated, we simply used the Madrid PTM series as the proxy 1751–1800 (although 1750 was taken from the Palencia PTP series, because the Madrid series starts with 1751).
4.1.2 PM 1800–1828: As a proxy for (unobserved) Mexican PM, we used the British export price index to proxy trends in the Mexican import price index (Mitchell, Abstract, p. 331).
4.1.3 PX 1750–1828: Because silver was such a large share of export receipts, we used silver prices (pesos per gram of coined silver) to proxy Mexican export prices (Burzio, Diccionario).
4.2 PX, PM and PX/PM 1828–1940:
4.2.1 Mexico 1828–1870: We rely on Prados (“Economic Consequences”) and Salvucci (Textiles and Capitalism).
4.2.2 Mexico 1870–1940: Data underlying Catáo (“Export Growth”).
4.2.3 Latin America 1810–1870: Data underlying Williamson (“Globalization, De-Industrialization and Underdevelopment”).
4.2.4 Latin America, Asia, Ottoman 1870–1940: Data underlying Williamson (ibid.)
4.3 Linking yields series 1750–1940 for PX, PM and PX/PM (1828 = 100).
MEXICAN PRICES AND WAGES, 1750–1878