Introduction
Social cues, such as gestures and eye-gaze, are an integral part of social communication. Parents’ use of such cues not only promotes children's use of gestures, but also supports language development (Goodwyn & Acredolo, Reference Goodwyn and Acredolo1998; Iverson, Capirci, Longobardi, & Caselli, Reference Iverson, Capirci, Longobardi and Caselli1999), and guides sustained attention that is critical to early learning in general (Brigham, Yoder, Jarzynka, & Tapp, Reference Brigham, Yoder, Jarzynka and Tapp2010; Yu & Smith, Reference Yu and Smith2016). Previous research has made it clear that a child's ability to understand the social cues provided by their parents has a profound impact on language and social development (e.g., Carpenter, Nagell, Tomasello, Butterworth, & Moore, Reference Carpenter, Nagell, Tomasello, Butterworth and Moore1998; Goodwyn & Acredolo, Reference Goodwyn and Acredolo1998; Iverson et al., Reference Iverson, Capirci, Longobardi and Caselli1999; Namy & Nolan, Reference Namy and Nolan2004; Kyger, Reference Kyger2013).
While gesture comprehension occurs readily over the course of typical development (Capone & McGregor, Reference Capone and McGregor2004), attending to and understanding gestures is an area of weakness for children with some neurodevelopmental disorders (Pennington & McConachie, Reference Pennington and McConachie2001). Specifically, children with autism spectrum disorder (ASD) are a particularly important population to consider in this regard, as atypical social communication is inherent to the ASD diagnosis (APA, 2013). Social communication difficulties in ASD include problems gleaning information from others’ referential cues, such as eye-gaze and pointing (Loveland & Landry, Reference Loveland and Landry1986; Landa, Holman, & Garrett-Mayer, Reference Landa, Holman and Garrett-Mayer2007; Sullivan, Finelli, Marvin, Garrett-Mayer, Bauman, & Landa, Reference Sullivan, Finelli, Marvin, Garrett-Mayer, Bauman and Landa2007; Wetherby, Watt, Morgan, & Shumway, Reference Wetherby, Watt, Morgan and Shumway2007; Shumway & Wetherby, Reference Shumway and Wetherby2009). Children with ASD also have more difficulty recognizing social cues, including facial expression, social attention, and body language (e.g., Jellema et al., Reference Jellema, Lorteije, Van Rijn, Wout, de Haan, van Engeland and Kemner2009), compared to their typically developing (TD) peers. These challenges disrupt the process of language development in this population (e.g., Charman, Baron-Cohen, Swettenham, Baird, Drew, & Cox, Reference Charman, Baron-Cohen, Swettenham, Baird, Drew and Cox2003; Luyster, Kadlec, Carter, & Tager-Flusberg, Reference Luyster, Kadlec, Carter and Tager-Flusberg2008). Yet, how social interactions are perceived by the child and how they influence their learning are not fully understood. Therefore, the current study used a dyadic play session to evaluate the use of gestures by parents, how these gestures are perceived by their children, and how these may be relevant to sustained attention (SA) and joint attention (JA). These explorations were undertaken by focusing on the similarities and differences between dyads that included parents and their children with ASD and parents and their TD children. The goal of this study is to better characterize parental gesturing in relation to both SA and JA – essential foundations for language and cognitive development (Tomasello & Farrar, Reference Tomasello and Farrar1986; Brooks & Meltzoff, Reference Brooks and Meltzoff2005). Doing so may ultimately reveal opportunities for targeted parent-mediated intervention useful for increasing early language learning opportunities for young children with ASD.
Parents modify their gesturing
Parents adjust their referential cue use to their child's needs based on the child's age (Brand, Baldwin, & Ashburn, Reference Brand, Baldwin and Ashburn2002; O'Neill, Bard, Linnell, & Fluck, Reference O'Neill, Bard, Linnell and Fluck2005), but also on developmental achievements like object knowledge (Dimitrova & Moro, Reference Dimitrova and Moro2013) and communication and language development (Lemanek, Stone, & Fishel, Reference Lemanek, Stone and Fishel1993; Kasari & Sigman, Reference Kasari and Sigman1997; Iverson et al., Reference Iverson, Capirci, Longobardi and Caselli1999; Doussard-Roosevelt, Joe, Bazhenova, & Porges, Reference Doussard-Roosevelt, Joe, Bazhenova and Porges2003). One study that tracked gesture use of six parents of TD infants documented that parents used more frequent and more complex gestures as infants’ object knowledge increased (Dimitrova & Moro, Reference Dimitrova and Moro2013). Another study concerning parental gesture use indicated that parents of children with Down syndrome used more exaggerated gestures to accommodate their child's perceived developmental level (Iverson et al., Reference Iverson, Capirci, Longobardi and Caselli1999). Among children with ASD, studies have found that parents had more physical contact and used more verbal and non-verbal prompts during play than TD parents (Lemanek et al., Reference Lemanek, Stone and Fishel1993; El-Ghoroury & Romanczyk, Reference El-Ghoroury and Romanczyk1999; Kasari & Sigman, Reference Kasari and Sigman1997; Doussard-Roosevelt et al., Reference Doussard-Roosevelt, Joe, Bazhenova and Porges2003). Early exposure to gestures in social interactions increases positive outcomes such as understanding the meaning of spoken words (Zukow-Goldring, Reference Zukow-Goldring1996), as well as increasing the use of gestures by children (Goodwyn & Acredolo, Reference Goodwyn and Acredolo1998), and also aids in early language development (Goodwyn & Acredolo, Reference Goodwyn and Acredolo1998; Iverson et al., Reference Iverson, Capirci, Longobardi and Caselli1999; Baker, Messinger, Lyons, & Grantz, Reference Baker, Messinger, Lyons and Grantz2010; Medeiros & Winsler, Reference Medeiros and Winsler2014).
The above studies suggest that parents modify their speech and gestures in response to their perceived developmental level of their child, and that parents’ gesture scaffolding has a positive effect on children's language development (see also Goldin-Meadow, Goodrich, Sauer, & Iverson, Reference Goldin-Meadow, Goodrich, Sauer and Iverson2007). However, the mechanism around this effect remains unclear. That is, it is not yet understood how parental gesture is perceived by the child and how learning experiences may be influenced by the gesturing, and these gaps call for gaining insights into children's viewing experiences. Such information is critical for understanding potential mechanisms underlying the role of parental gestures in language development and how this ultimately may inform intervention development.
The role of parent's gesturing in attention
It is possible that parents’ gesture use influences children's visual experiences (Dent-Read, & Zukow-Goldring, Reference Dent-Read, Zukow-Goldring, Dent-Read and Zukow-Goldring1997; Iverson et al., Reference Iverson, Capirci, Longobardi and Caselli1999; Deàk, Flom, & Pick, Reference Deàk, Flom and Pick2000; Matatyaho & Gogate, Reference Matatyaho and Gogate2008; Yoshida & Burling, Reference Yoshida and Burling2013). One study demonstrated that, while mothers were talking to their young infants (5 months to 24 months old), they actively used gestures in ways that influenced their babies’ viewing experiences. Specifically, objects brought up close to the child were viewed by the child, thereby promoting SA (Yoshida & Burling, Reference Yoshida and Burling2013; Burling & Yoshida, Reference Burling and Yoshida2019). A number of studies on typical and atypical development also suggest the importance of parental responsiveness – gaze, pointing, touching, object handling, object showing, tapping – in children's SA (Mundy, Sigman, Ungerer, & Sherman, Reference Mundy, Sigman, Ungerer and Sherman1986; Landry & Chapieski, Reference Landry and Chapieski1989; Leekam, Hunnisett, & Moore, Reference Leekam, Hunnisett and Moore1998; Carpenter, Pennington, & Rogers, Reference Carpenter, Pennington and Rogers2002; Brigham et al., Reference Brigham, Yoder, Jarzynka and Tapp2010; Yu & Smith, Reference Yu and Smith2016).
Parental responsiveness to a child's looking behavior is important not only in SA but also in JA, or the shared focus of two people on one object. JA is achieved when one individual directs the attention of another to an object by verbal or non-verbal cues. Specifically, parents’ monitoring of their child's focus of attention (face monitoring) guides the child's effective distribution of attention between a social partner and an object (or event), promoting JA, and this, in turn, supports social and language development (Bruner, Reference Bruner1983; Bakeman & Adamson, Reference Bakeman and Adamson1984; Mundy, Sigman, Ungerer, & Sherman, Reference Mundy, Sigman, Ungerer and Sherman1987; Brooks & Meltzoff, Reference Brooks and Meltzoff2005; Siller & Sigman, Reference Siller and Sigman2008; Yu & Smith, Reference Yu and Smith2012). A number of recent studies suggest that JA is initiated and formed socially through gesturing (Mundy & Stella, Reference Mundy, Stella, Wetherby and Prizant2000; Rickert, Yu, & Favata, Reference Rickert, Yu and Favata2010; Yu & Smith, Reference Yu and Smith2016). However, children with ASD have significant difficulties in initiating and responding to JA (Sigman, Mundy, Sherman, & Ungerer, Reference Sigman, Mundy, Sherman and Ungerer1986; Mundy, Sigman, & Kasari, Reference Mundy, Sigman and Kasari1994; Dawson et al., Reference Dawson, Toth, Abbott, Osterling, Munson, Estes and Liaw2004; Cassel, Messinger, Ibanez, Haltigan, Acosta, & Buchman, Reference Cassel, Messinger, Ibanez, Haltigan, Acosta and Buchman2007; van Ijzendoorn et al., Reference van Ijzendoorn, Rutgers, Bakermans-Kranenburg, Swinkels, van Daalen, Dietz, Naber, Buitelaar and van Engeland2007). Given these difficulties, it is likely that social references may be used differently by parents of children with ASD relative to TD children.
Current aims and research questions
The above review indicates that parental gesturing plays a critical role in shaping their children's looking behaviors, which are foundational for language development, and that gesture scaffolding varies according to developmental level. However, since children with ASD often have difficulty interpreting gestures, it is possible that, even when children with ASD are provided with numerous gestures, they do not attend to them in the same way that TD children do. The potential for these differences has implications for language development.
Accordingly, the primary aim of the present study was to evaluate whether and how parents’ awareness of the child's diagnoses with autism influence their use of social cues, and how parents’ behaviors may impact children's visual experiences. To do so, we examined (1) whether or not parents of children with ASD would use social cues such as gesturing and face monitoring (looking at the child's face) differently, compared to parents of TD children; and (2) whether or not parents’ social cues support their children's SA, and their JA (socially elicited attention). Because previous literature has documented increased referential scaffolding and heightened responsiveness among parents of children with ASD, we hypothesized: (H1) Parents in the ASD group would use more gestures and face monitoring than in the TD group; and (H2) SA in the ASD group will be more likely to occur when preceded by parents’ social cues (such as gestures and face monitoring) when compared to the TD group even if children's SA and JA in ASD are compatible to that of TD.
Methods
Participants
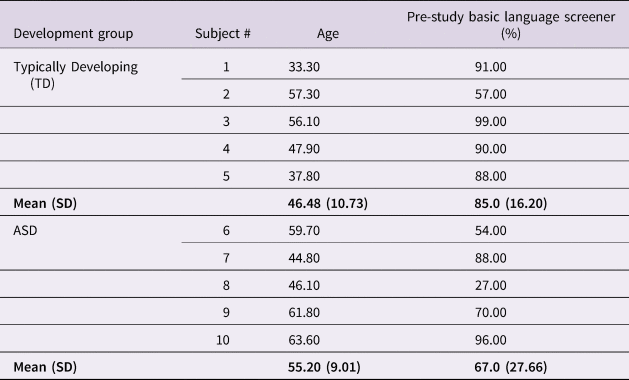
Participants were recruited throughout daycares, research institutions, libraries, our website, and schools in a large southwestern city. Ten parent–child dyads, with children between the ages of 36 and 60 months, participated. Five of them were children diagnosed with ASD (M = 55.2 months, SD = 9.0), and five were TD children with no reported language or developmental delays (M = 46.5 months, SD = 10.7). Table 1 provides information on the ages and pre-study basic language screener scores of participants in the study. We obtained substantial behavioral counts, with an average of 19,200 frames per 640 seconds (about 10 minutes) for each parent–child dyad. The use of a large number of datapoints from a small number of dyads is consistent with previous studies considering multisensory systems using similar approaches and technologies for the study of parental input (e.g., Yoshida & Smith, Reference Yoshida and Smith2008; Yu & Smith, Reference Yu and Smith2012; Gogate, Maganti, & Bahrick, Reference Gogate, Maganti and Bahrick2015).
Descriptions of basic information for the TD and ASD groups included in the study: child's age and pre-study screener scores

In the ASD group, three children were diagnosed with Autistic Disorder, and two were diagnosed with Pervasive Developmental Disorder Not Otherwise Specified (PDD-NOS), according to the DSM-IV-TR (APA, 2000) criteria. Diagnoses of children in the ASD group were confirmed via the Autism Diagnostic Observation Schedule (ADOS; Lord et al., Reference Lord, Risi, Lambrecht, Cook, Leventhal, DiLavore, Pickles and Rutter2000), which was administered prior to their lab visit; confirmation of exceeding ADOS cut-off was required for study inclusion, but individuals’ scores were not obtained for the present study. The ADOS is a semi-structured assessment of social, communicative, and play-tasks that allows examiners to observe behaviors characteristic of ASD. The ADOS is widely used for clinical diagnosis and in research (Ozonoff, Goodlin-Jones, & Solomon, Reference Ozonoff, Goodlin-Jones and Solomon2005) and can be used for individuals of different ages and of varying expressive language abilities. All participants in this study were administered Module 2 of the ADOS, which is appropriate for children with phrase speech.
As a pre-study basic language screener, parents of all participating children completed the MacArthur Communicative Development Inventory: Words and Sentences (MCDI; Fenson et al., Reference Fenson, Dale, Reznick, Thal, Bates, Hartung, Pethick and Reilly1993, Reference Fenson, Marchman, Thal, Dale, Reznick and Bates2007). The MCDI is a parental vocabulary checklist consisting of early-learned words and sentences by TD children and designed to assess younger children. The rationale for using this tool as a pre-study screener for our sample was to ensure that early language abilities were intact rather than using this to measure language status (see Skwerer, Jordan, Brukilacchio, & Tager-Flusberg, Reference Skwerer, Jordan, Brukilacchio and Tager-Flusberg2016, for their use for older children with ASD). Given that the primary focus is to study the impact of the child's previous diagnoses of autism on parents in their play experiences, we controlled age and minimal vocabulary screening as key factors. The present study is therefore limited to the documentation of the group differences, and not to identify the factors specific to ASD (i.e., children's non-verbal IQ, language development) that would explain the differences. One biological parent (9 mothers and 1 father) participated with each child in the study. The ethnic background of parents included Caucasian (6), African American (1), Hispanic (2), and Asian (1). Parents received a $20 gift card and children received a stuffed animal as a token of appreciation for their participation. All caregivers provided informed consent, and all procedures were approved by the Institutional Review Board.
Procedure
In addition to a digital video camera that was mounted on the wall to capture an overall view of the task scene, we used a head-mounted camera for recording the child's view during a parent–child play task, which is a method similar to other naturalistic observation studies using head-mounted cameras with toddlers and their parents (e.g., Yoshida & Smith, Reference Yoshida and Smith2008; Pereira, James, Jones, & Smith, Reference Pereira, James, Jones and Smith2010; Smith, Yu, & Pereira, Reference Smith, Yu and Pereira2011; see also for a review, Smith, Yu, Yoshida, & Fausey, Reference Smith, Yu, Yoshida and Fausey2015; Yoshida & Fausey, Reference Yoshida, Fausey, Horst and Torkildsen2019). Only the child's view was recorded, and a miniature video camera mounted on a headband was used to capture this view (Yoshida & Smith, Reference Yoshida and Smith2008; Aslin, Reference Aslin2009; Smith, Yu, & Pereira, Reference Smith, Yu and Pereira2011). The camera was a Watec (WAT-230A) miniature (25 g) color video camera mounted on a head-camera band. The focal length of the lens is f2.1 mm. The numbers of effective pixels are 512 (H) · 492 (V). The camera's visual field is 84 degrees (V) and 115 (H). A previous study using a head-mounted camera compared head versus eye direction in TD toddlers and found 87% correspondence between direction of head movement and direction of eye-gaze in a similar task context (Yoshida & Smith, Reference Yoshida and Smith2008). We further replicated the measuring of the correspondence of the head-mounted camera to the direction of the child's eyes by annotating the overlap from the wall-mounted camera view. There were 2,513 counts that were included in head-mounted camera viewing moments (SA) across all infants; 78% of these (1,972 counts) were judged to be aligned by the independent judgment of the corresponding head-mounted camera view (inter-rater reliability = 0.875.) This replicates the high correspondence between the head-mounted camera and eye direction reported with typically developing children (Yoshida & Smith, Reference Yoshida and Smith2008). To minimize the distraction, we also used long and lightweight cables to permit free engagement in the table-top activities.
Families of children with ASD received a mock head camera band prior to their visit to wear at home regularly for the purposes of habituating to the study procedures. The mock camera was made out of similarly weighted wooden block and attached on a style form headband. The parents of children with ASD were instructed to put the mock headband on in the morning and afternoon for 15 minutes each day for a week to provide the child with an opportunity to acclimate to the feeling of wearing the band. Since many children with ASD have heightened sensory sensitivities (e.g., Baranek, Reference Baranek2002), the purpose of this procedure was to acclimate children to wearing the head camera before their study participation. Typically developing children did not have this training prior to their visit (Yoshida & Smith, Reference Yoshida and Smith2008; Pereira et al., Reference Pereira, James, Jones and Smith2010; Smith et al., Reference Smith, Yu and Pereira2011).
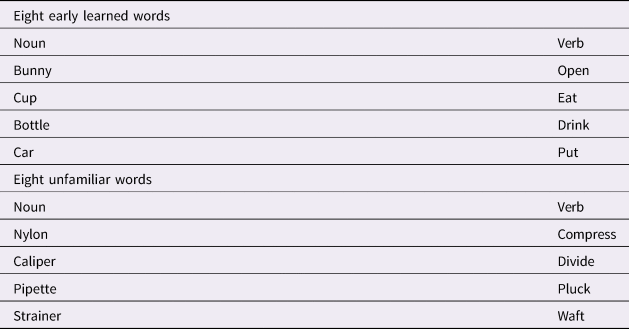
During their session, the parent and their child were seated at a child-sized table and chairs. The parent was seated next to the child, and the child was outfitted with the head camera. Video recordings were started a few minutes prior to their entering the room for minimizing the distraction from the presence of the camera. Parents were then given a box of toys and asked to play while teaching their children the toy names and action words in the same way they would at home (see Table 2 for the full list of words taught). Audio instructions were provided from a recording, directing parents which word to teach next. They were given 40 seconds to teach each word, for a total of 640 seconds for the entire task. There were a total of 16 words. Eight were early-learned words (e.g., bunny, open) that are listed on the developmental vocabulary checklist (MCDI), and right were unfamiliar words (e.g., caliper, compress), which are not among the most frequently used English words. Adding these less familiar words was done to broaden the task complexity to maintain children's interest (e.g., Horst, Samuelson, Kucker, and McMurray, Reference Horst, Samuelson, Kucker and McMurray2011). The study session, including set-up and calibration of the recording equipment, lasted 30 minutes.
Sixteen words (8 objects and 8 action words) used in the play session

Behavioral coding
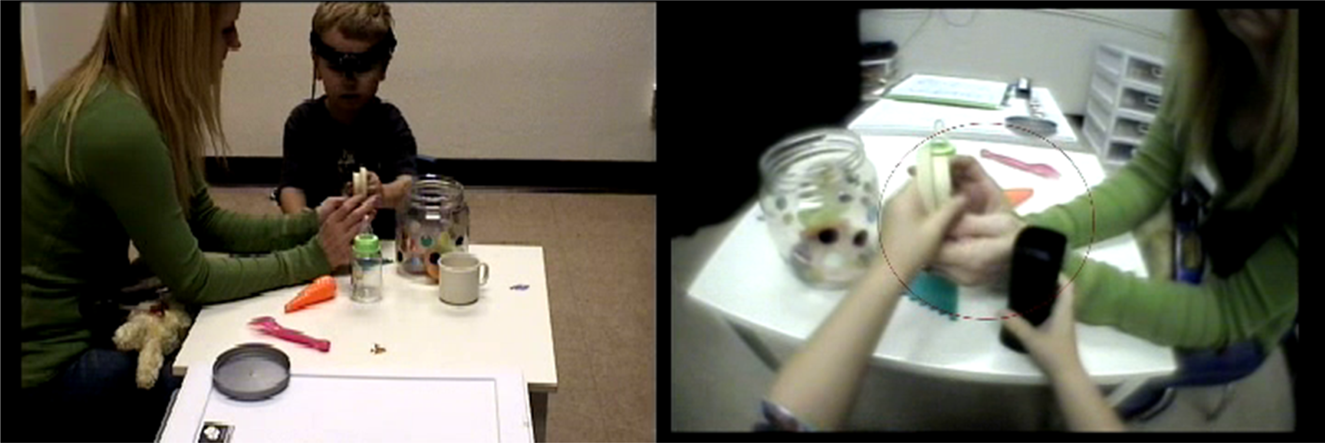
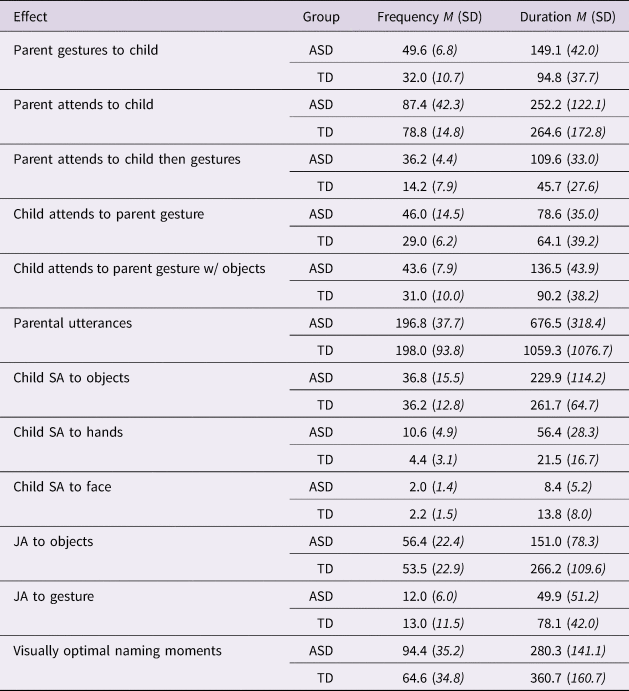
The wall/room view and child head camera view were synchronized and imported into the Datavyu coding software where each target behavior was observed and annotated (Datavyu Team, 2014). Coders were blind to whether children were in the ASD or TD groups. Inter-rater reliability between two raters, calculated using Krippendorf's alpha, was 0.84, indicating a high level of reliability (Krippendorf, Reference Krippendorff2004). Behaviors coded for in the study included: parents’ gesture use, parents’ utterances, parents’ monitoring of their child's focus of attention (face monitoring), children's SA to key objects, and children's looking at parental gesture. Coders time-stamped these variables by looking at the wall-mounted camera view (scene view) or head-mounted camera view (child's view) during coding. Table 3 includes the frequencies and durations obtained to address the present hypotheses. During the child's center view coding, a referential circle was used to help the coders determine what the child was attending to (Figure 1). This referential circle was included for a more consistent estimation of the object/gesture being in a center position for the child to attend to (Pereira, Smith, & Yu, Reference Pereira, Smith and Yu2014).
A still picture clip taken from the video recording that shows the view of the child (right) and the wall view (left) during the play session. The circle is the child's viewing referential circle used for the coding.

Frequency and duration (sec.) of observed behaviors by group, averaged across participants within the Typically Developing (TD) and Autism Spectrum Disorders (ASD) groups

Gesture coding
Three types of gestures were coded: (1) deictic gestures (e.g., pointing, showing), which are often used to redirect a social partner's attention and to share awareness of an object or event (Gómez, Sarriá, & Tamarit, Reference Gomez, Sarriá, Tamarit, Baron-Cohen, Tager-Flusberg and Cohen1993; Mundy et al., Reference Mundy, Sigman and Kasari1994); (2) symbolic gestures, which mimic the object being represented (e.g., pretending to drink out of an empty cup) and direct A partner's attention to the referent (Marlsen-Wilson, Levy, & Tyler, 1982; Hanna & Tanenhaus, Reference Hanna and Tanenhaus2004); and (3) other hand movements such as adapters (e.g., scratching nose), conventional gestures (e.g., shaking the head side to side to indicate no), and beat gestures (e.g., tapping one's lap). The first two types of gestures have been shown to drive early language development (Ungerer & Sigman, Reference Ungerer and Sigman1981; Goodwyn, Acredolo, & Brown, Reference Goodwyn, Acredolo and Brown2000; Charman, Drew, Baird, & Baird, Reference Charman, Drew, Baird and Baird2003). In the present study, deictic gestures were defined and coded as showing (directing a child towards an item, holding an object directly in front of child) and pointing (extending a finger towards the object) in the immediate environment (Medeiros & Winsler, Reference Medeiros and Winsler2014). Symbolic gestures were coded as occurring with or without objects, such as waving hands above a tray of toy cookies and nose breathing to represent wafting or pretending to drink out of an empty cup (Goodwyn et al., Reference Goodwyn, Acredolo and Brown2000). Other hand movements were expected to be minimal (e.g., Zammit & Schaffer, Reference Zammit and Schafer2011), yet these were coded to obtain a baseline of general manual activity level. Coding of these gestures was mutually exclusive. Parental gestures recorded by the child's view (head camera) are defined as parent gestures being ‘looked at by child’ and labeled as child attends to parent gesture.
SA Coding
A child's SA was coded by looking at every frame where the object such as a toy or parent hand(s) or face was located in the child's center view (Ruff & Capozzoli, Reference Ruff and Capozzoli2003; Yu & Smith, Reference Yu and Smith2012; Hollingworth & Maxcey-Richard, Reference Hollingworth and Maxcey-Richard2013). As such, we used 2,500 ms as the lower limit of our SA instance coding (2,500 to 20,000 ms).
JA coding
JA was defined as a temporally aligned looking instance by the parent and child to the same object (e.g., toy object, gesture). The coders used the child's view to identify frames containing an object in view longer than 500 msec (Yu & Smith, Reference Yu and Smith2012, Reference Yu and Smith2016). Subsequently, the wall/room view video was examined to make the decisions about objects of parental attention.
Data analytic approach
To address whether parents of children with ASD would use different social cues (e.g., gesturing and face monitoring) compared with parents of TD children, and how parents’ use of these cues impacted children's JA and SA, Bayesian analyses were used to compare differences in frequency and duration between ASD and TD groups for the effects listed in Table 3. Specifically, we fit a Bayesian multivariate generalized linear mixed effects model where multiple effects in terms of duration and frequency are measured for each individual (Goodrich, Gabry, Ali, & Brilleman, Reference Goodrich, Gabry, Ali and Brilleman2018). Statistical inference is typically classified into the frequentist and Bayesian approaches. In the frequentist approach, parameters of interest are considered to be fixed, whereas data are considered to be random. Frequentists aim to answer how likely it is to observe values in the data given a set of parameter values. For example, maximum likelihood estimation (MLE) produces estimates that maximize the likelihood. MLE has been widely used because of its desirable asymptotic (or large sample) properties: MLE is asymptotically consistent, normal, and efficient. In contrast, in the Bayesian approach, parameters of interest are considered to be random, whereas data are considered to be fixed. Bayesians are interested in estimating the probability distributions of parameters, given the data. More specifically, in the Bayesian approach, prior knowledge of a parameter (i.e., a prior distribution) is updated by the data at hand to produce a posterior distribution. The Bayesian approach has been widely used to address small sample problems (McNeish, Reference McNeish2016). In MLE, the quality of inference depends on sample sizes because statistical inference in MLE is typically based on MLE's asymptotic properties. It is well known that MLE suffers from small-sample bias, and hypothesis testing based on asymptotic normality may not work well in small samples. In contrast, the Bayesian approach does not rely on large sample theory, and therefore is known to show better small-sample performance (Muthén & Asparouhov, Reference Muthén and Asparouhov2012).
The behaviors of interest are expected to be correlated within individuals (parent–child dyads), and frequencies and durations are also expected to be correlated with the type of measurement. A common covariance matrix is estimated and used to further estimate parameters for group differences along other covariates such as age. Posterior predictive distributions are obtained from the model and comparisons are made from these distributions, reporting Bayesian highest density confidence intervals and p-values. Issues with multiple comparisons are accounted for by these types of models in terms of both shrinkage and uncertainty, and limitations due to sample size will be reflected in the posterior as uncertainty, or wider distributions for the group comparisons. As a result, this makes obtaining meaningful differences less likely as the weakly informative priors have a stronger influence over the estimation of parameters with less influence from the data (Kruschke & Liddell, Reference Kruschke and Liddell2018). All the analyses were conducted using the statistical program R, an open-source statistical program (Goodrich et al., Reference Goodrich, Gabry, Ali and Brilleman2018).
Results
Manipulation check
Prior to the primary analysis that directly addresses the study questions, we first report analyses specifically conducted for manipulation checks validating key gesture types, and to ensure that children's age and pre-study language screener scores were not different between the ASD and TD groups. Mann–Whitney U tests were used to compare groups, and the Bayesian model was used to test the age and screening score effects for target behavioral variables. The Mann–Whitney U test is a non-parametric, distribution-free test to compare two sample median scores, and is appropriate for analyzing small datasets without specific distributions (Mann & Whitney, Reference Mann and Whitney1947). Unlike like the independent samples t-test, in the Mann–Whitney U test the lower value of U indicates the larger sample median difference.
For gesture use, deictic and symbolic gestures of parents were found to make up 96.8% of total gestures across groups. Other hand movements, such as adapters, conventional gestures, and beat gestures, contributed to 3.2% of total gestures. Adapters are often considered non-communicative acts (Ekman & Friesen, Reference Ekman and Friesen1972), while beat gestures are rarely found in parent–child interactions (Zammit & Schaffer, Reference Zammit and Schafer2011). Though conventional gestures by parents have been found in a few studies (Iverson et al., Reference Iverson, Capirci, Longobardi and Caselli1999; Medeiros & Winsler, Reference Medeiros and Winsler2014), frequencies were extremely low in the present word teaching play context for both groups. Given the non-communicative nature of these gestures, other hand movements are not included in the analyses. A Mann–Whitney U test indicated that there was no significant group difference either in the age (p = .21) or in the pre-study language screener scores (p = .25). This result from non-parametric test could be due to the high within-group variability. We further validated the group equivalence of the two groups in terms of age and the screening scores. The age covariate parameter from the Bayesian model indicated there was no age effect for either frequency (β = .003, CI = [–0.024, 0.029]) or duration (β = .012, CI = [–0.021, 0.044]) of the measured behaviors. The pre-study language screening scores covariate from the model indicated there was no score effect for either frequency (β = .003, CI = [–0.007, 0.014]) or duration (β = .002, CI = [–0.011, 0.015]) of the measured behaviors. Considering these findings, any potential differences in parental gesture use between the two groups could not be attributed to differences in the age or pre-study language screener scores of their children.
Hypothesis 1: group differences in parents’ use of social cues
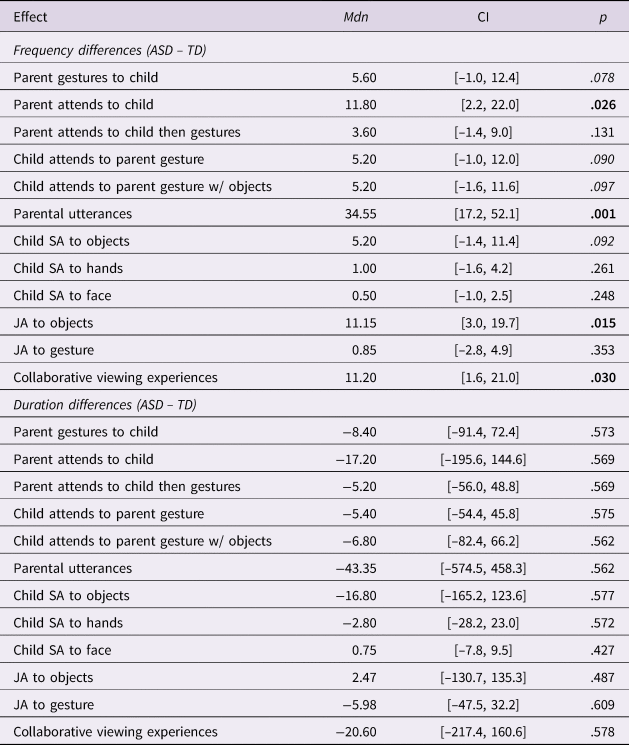
To examine whether or not parents of children with ASD would use social cues (gesturing and face monitoring) differently, compared to parents of TD children, we first tested group differences in parental gesture use and face monitoring, and further examined how gestures were actually attended to by the child. We report model-estimated differences between ASD and TD groups, with confidence intervals and p-values shown in Table 4. Average observed frequencies for these effects are shown in Table 3. For overall parental gesture frequency, we found that the ASD group produced 5.6 more gestures on average than the TD group. Also, parents of the ASD group significantly produced face monitoring with 11.8 more instances than the TD group (p = .026). Additionally, when we looked at those gestures that occurred after looking towards the child (face monitoring), the parents in the ASD group produced 3.6 more ‘socially guided’ gestures than parents in the TD group. For children, ASD children attended to 5.2 more gestures on average, with most of these gestures being attended to if accompanied by objects. Although parents within the ASD group produced more gestures on average, and children within this group also attended to these gestures more often than those in the TD group, these gesture effects (but not face monitoring effect) were not significant (see Table 4). The duration of these effects between the ASD and TD groups was not significantly different, and, in general, differences in duration of behaviors were not found to be significantly different for any measured effect. Accordingly, we will not discuss duration of behaviors for the rest of the ‘Results’ section.
Group differences in frequency and duration from posterior predictive distributions of observed behaviors. Median differences are shown for each effect. Confidence intervals are 90% Bayesian highest density intervals of the effect's distribution and p-values are the proportion of posterior MCMC samples below the null value of zero.

Hypothesis 2: group differences in sustained (SA) and joint attention (JA)
To further address how parents’ use of social cue use impacted children's attention (SA and JA), we first compared groups by child SA (to parent face/hand and object), and JA (to object and parental gesture). We then compared these child looking behaviors in relation to parents’ behaviors.
The results suggest comparable SA across the groups; there was no difference in SA to the parent (face or hands or object) by the child between groups (p = .248, p = .261, p = .092, respectively). For JA, where both child and parent were attending to the ‘same’ instances (object, gesture), only JA to objects was significantly different, with ASD groups showing 11.15 more instances of JA to objects than TD individuals. These may suggest that the heightened responsiveness (parental monitoring of child's face) among the ASD parent group may support children in the ASD group to achieve equally organized attention.
To further address the possibility of how child looking behaviors are different in relation to parent behaviors, we looked separately at socially elicited SA where the child's SA immediately followed (1) the parent monitoring the child; (2) parent speech; and (3) parent gesture. Significant group differences were obtained for all three SA instances. Specifically, children in the ASD group had more socially elicited SA moments following parent face monitoring, parental speech, and parental gesturing when compared to the TD group (p < .001, p < .001, p < .001, respectively).
Last, we recorded 34.6 more vocal utterances from parents within the ASD group (p = .001), with their children showing 10.0 more utterances than those in the TD group (p = .035). This group difference suggests that the potential difference in parental face monitoring and child's attentional experiences between the two groups could be attributed to differences in the number of words spoken by parents, and any interpretation of the results has to take this into account.
Implications for learning (follow-up analysis)
The results so far suggest that parent gesturing was made equally accessible to children with ASD (if not to a greater degree) through parental effort. However, the equally distributed gesture looking could be due to the small sample size, or potentially to our use of objects in the play session. Indeed, gestures often involve the use of objects, and the object itself may contribute to attentional guidance. Our results so far suggest that the role of an object during gesturing may be stronger among ASD children, which may also result in their parents’ increased face monitoring and utterances to the child. These findings are relevant to investigation of the second aim (i.e., whether parents’ use of social cues differentially supports their children's achievement of SA and JA), and to what extent parents coordinate these actions. It is suggested that parents increase coordination of their actions to promote their child's visual experiences during word learning contexts (e.g., Dimitrova, Özçalışkan, & Adamson, Reference Dimitrova, Özçalışkan and Adamson2016). These highly coordinated moments created by social scaffolding we refer to as collaborative viewing experiences. Under these circumstances, children often view a referent while their parents name and sustain the object in the child's view (e.g., Zukow-Goldring, Reference Zukow-Goldring, Dent-Read and Zukow-Goldring1997; Namy, Acredolo, & Goodwyn, Reference Namy, Acredolo and Goodwyn2000; Matatyaho & Gogate, Reference Matatyaho and Gogate2008). Also, when these visual moments are created by toddlers themselves when parents name objects, they are shown to learn the object names effectively (Yu & Smith, Reference Yu and Smith2012; Pereira, Smith, & Yu, Reference Pereira, Smith and Yu2014). To address the relevancy, we looked at children's SA to an object, and then selected only those instances that were temporally aligned to the parent's naming of that object. We allowed 2 seconds before and after the onset and offset of children's SA to define the moments (Yu & Smith, Reference Yu and Smith2012). Results indicate that children in the ASD group were more successful in experiencing these kinds of structured viewing moments: ASD (Mdn = 94.4) vs. TD (Mdn = 64.6) groups, with an estimated difference of 11.20 (CI = [1.60, 21.00], p = .03). It is possible that the larger amount of gesturing and utterances found among parents of children with ASD was optimally synchronized with the child's moment-to-moment looking, and that this contribute to an enriched learning experience.
Discussion
In the present study, we specifically explored, first, whether parents’ use of gestures and face monitoring differed between ASD and TD groups; and second, how parents’ use of these cues impacted the child's moment-to-moment attention, such as looking at parental gestures, SA, and JA experiences. With regard to the first study aim, we showed that parents of children with ASD monitored their child more often than parents of TD children. This is consistent with previous findings that parents of children with ASD, as well as those at risk of ASD (even if not yet diagnosed), produce more utterances and are more responsive to their child in a naturalistic play interaction (Lemanek et al., Reference Lemanek, Stone and Fishel1993; El-Ghoroury & Romanczyk, Reference El-Ghoroury and Romanczyk1999; Doussard-Roosevelt et al., Reference Doussard-Roosevelt, Joe, Bazhenova and Porges2003; Talbott, Nelson, & Tager-Flusberg, Reference Talbott, Nelson and Tager-Flusberg2015). Though the gesture use was not significantly different, these findings overall suggest that parents naturally modify their social cue use based on their perception of the developmental needs of their children. Further, in our study, parents’ gestures were recorded by the child's point-of-view camera. The results suggest that, despite the documented difficulty of gesture comprehension associated with children with ASD, children in the ASD group strongly attended to gestures.
Moreover, the follow-up analysis conducted to consider the potential learning implications suggest that, for parents of children with ASD, gesturing and monitoring their child's face might be clustered (temporally) around their planning and showing of objects. Together, these findings suggest that ASD parents not only make their gestures equally available to their child, but also may organize their gesturing in relation to their child's looking; these parental behaviors may better structure their children's social interaction and learning. This finding is interesting in regard to the child's visual experiences. For example, Yu and Smith (Reference Yu and Smith2012), observed child's viewing experiences using a head-camera, and showed that better object name learning in 18-month-old toddlers occurred when child viewing and parent naming were simultaneous. Given the attentional disengagement difficulties in children with ASD (Landry & Bryson, Reference Landry and Bryson2004; Elsabbagh, Fernandes, Webb, Dawson, Charman, & Johnson, Reference Elsabbagh, Fernandes, Webb, Dawson, Charman and Johnson2013), one may expect that collaborative visual experiences effective for language learning might not be easily created. However, the results from our follow-up analyses suggested that the visual experiences of young children with ASD were as well-coordinated with parent's speech as were those of their TD peers. This suggests that such moments might facilitate parent prompting in certain situations. Through these efforts on the part of the parent, the ASD-related deficit of attending to relevant information in a social context may, to an extent, be mitigated by the effect of socially induced SA, JA, and structured viewing experiences. In other words, a parent's use of referential cues and careful monitoring of their child's attention may support critical visual experiences for language learning among children with ASD – experiences which are more naturally occurring among TD children.
Our finding that children with ASD had socially induced enriched visual experiences comparable to those of TD children are considered in light of recent reports of parents compensating for the immature skills of their TD young children when involved in a similar parent–child interaction context (Burling & Yoshida, Reference Burling and Yoshida2019). In that study, parent involvement in showing objects to their child was higher during the early infant months (6 and 9 months), and objects that those parents brought close to the child were more likely isolated and larger in the child's view. The current study's findings reiterate the important role of immediate social partners providing behaviors to supplement the child's capability in the absence of autonomous performance. Further, our results demonstrate how interactive processes might be general across domains, populations, and developmental periods. To further understand the developmental significance of socially induced developmental achievements, it is essential to study how social scaffolding leads to learning. Important future directions for building on the current findings include studying how socially induced SA contributes to immediate learning, as well as to later developmental outcomes. Moreover, comparing how learning is facilitated by socially induced SA, and how this compares to learning facilitated through endogenous SA, are critical next questions to evaluate because uncovering these mechanisms may provide the groundwork for enhancing social scaffolding (i.e., via parent-mediated intervention) that could facilitate better early language learning among children with ASD.
Limitations
Though the present study demonstrated one potential pathway in which social cues support children's attention, there are a few limitations. First, the study uses a small sample size. However, the small sample size was balanced by the intense coding undertaken, and by using a set of Bayesian analyses, such that, even with the small sample size, several findings were significant. Still, replication with a larger sample would enhance confidence that these patterns may reveal meaningful mechanisms relevant to early learning. Relatedly, all parents in this study were self-referred for research participation (and so may be differentially motivated compared to a random sample), and thus our findings may be different in a community-based sample. A second limitation was that the heterogeneous nature of ASD was not precisely captured with regard to characteristics within our sample. Since our primary focus was how a parents’ awareness of their child's diagnostic status may shape the parents’ adaptive behaviors and relate to a child's visual experiences, the present study does not include precise estimates of children's developmental level (i.e., IQ, language, and early cognitive development, etc.), comorbidity (i.e., PDD, psychopathological profile, etc.), or treatment history. These factors may indeed drive parents’ responsiveness and the play experiences, and thus limit generalizability.
More specific to the potential treatment history, in programs based on the principles of applied behavior analysis (ABA), children's attention to a social partner is encouraged (Simpson, et al., Reference Simpson2005; Carbone, O'Brien, Sweeney-Kerwin, & Albert, Reference Carbone, O'Brien, Sweeney-Kerwin and Albert2013; Wang et al., Reference Wang, Desalvo, Zhao, Feng, Loveland, Shi and Gnawali2014). Therefore, if participants had a history of ABA-based treatment, this could explain, at least in part, the finding that ASD and TD groups did not differ in children's attention to parent's face, hands, and gesturing. Furthermore, though we used the MCDI as a screen to establish a minimal vocabulary level for study inclusion, and employed unfamiliar words to promote communications, more informative measures of language functioning and the individual's vocabulary knowledge would have more thoroughly characterized our sample on language development, and provide insights into how an individual's language development could account for our findings.
Conclusion
The results of this study are unique and provide important initial insights into parents’ critical role in influencing the social environment they share with their child, which may affect early language development. Developmental researchers tend to explore phenomena such as atypical sensorimotor development and atypical patterns of object exploration (de Campos, Savelsbergh, & Rocha, Reference de Campos, Savelsbergh and Rocha2012), impaired visual processing (Behrmann, Thomas, & Humphreys, Reference Behrmann, Thomas and Humphreys2006), and poor attention (Takarae, Luna, & Sweeney, Reference Takarae, Luna, Sweeney and Preedy2012). Some studies confirm that children with ASD engage in gaze-following and JA much less than their TD counterparts (Mundy et al., Reference Mundy, Sigman, Ungerer and Sherman1986; Bacon, Fein, Morris, Waterhouse, & Allen, Reference Bacon, Fein, Morris, Waterhouse and Allen1998; Leekam, López, & Moore, Reference Leekam, López and Moore2000; Pelphrey, Morris, & McCarthy, Reference Pelphrey, Morris and McCarthy2005). As informative as such findings may be, there are limitations in studying a disorder without accounting for the impacts of the social environment. For example, the lack of imitation, synchronization of behaviors, language, JA, and gesturing in children with ASD constrain the way in which parents interact with their child through the developing years, dramatically altering the child's social environment and changing the developmental course of the child (Mundy et al., Reference Mundy, Sigman, Ungerer and Sherman1986; Bacon et al., Reference Bacon, Fein, Morris, Waterhouse and Allen1998; Leekam et al., Reference Leekam, López and Moore2000; Williams, Whiten, Suddendorf, & Perrett, Reference Williams, Whiten, Suddendorf and Perrett2001; Pelphrey et al., Reference Pelphrey, Morris and McCarthy2005; Ramachandran & Oberman, Reference Ramachandran and Oberman2006; Eigsti, Reference Eigsti2013). The present study adds to existing knowledge about specific ways in which behaviors associated with a neurodevelopmental disorder may affect the social input received by the child. The findings of our preliminary study, which certainly warrant further research, could contribute to enhanced investigations into potential mechanisms for early language learning in ASD, a line of study that ultimately may lead to enhanced intervention to improve child outcomes.
Acknowledgments
Parts of the data for this paper were presented at the International Conference on Infant Studies in 2010 and the Society for Research in Child Development meeting in 2009 and 2013. This research was supported in part by a National Institutes of Health grant (R01 HD058620), awarded to the University of Houston, and by the University of Houston Small Grant Program. We thank the parents and children in our community who supported the research and participated in the study, and thank the Cognitive Development Lab for collection and coding of the data.