Implications
Existing genetic selection indexes can be augmented to account for the impact that changes in component traits will have on greenhouse gas (GHG) emissions intensities (EIs) from farmed livestock using a proposed theoretical framework. This results in a change in the selection direction in favour of traits that result in a reduction in GHG emissions per unit of farm product output. In a dairy cattle breeding example, the substantial genetic trend in milk protein was an important factor in improving EI via dilution of fixed emissions, but genetic gains in survival were also important in reducing the emissions associated with herd replacements.
Introduction
Greenhouse gas emissions from farm livestock are of global significance (Gerber et al., Reference Gerber, Steinfeld, Henderson, Mottet, Opio, Dijkman, Falcucci and Tempio2013) and, as such, a substantial amount of research is currently under way to identify technical opportunities to mitigate these impacts. For many farmers, families, businesses and industries who depend on livestock for their sustenance and livelihoods, and for consumers of numerous and diverse products that they generate, reductions in the size of the livestock population as well as in the productive output in these populations are undesirable (Herrero et al., Reference Herrero, Grace, Njuki, Johnson, Enahoro, Silvestri and Rufino2013). An alternative is to attempt modification of farm livestock systems so that the total GHG emissions generated for each unit of product output – that is, EI – is reduced (Watson et al., Reference Watson, Zinyowera and Moss1996).
Novel trait measurements that can potentially act as genetic selection criteria for reduced GHG emissions are currently undergoing extensive research (Pickering et al., Reference Pickering, Chagunda, Banos, Mrode, McEwan and Wall2015). It is important, however, that selection efforts also consider improvements in EI (Cottle et al., Reference Cottle, Nolan and Wiedemann2011) rather than focus on gross reductions in GHG emissions alone. This is because GHG emissions from livestock farming systems (mainly methane and nitrous oxide) are highly linked to the amount of feed consumed by the animals (Blaxter and Clapperton, Reference Blaxter and Clapperton1965). Because of the well-known genetic association between animal output and feed requirements (Archer et al., Reference Archer, Richardson, Herd and Arthur1999), the selection of criteria associated with low feed intake in isolation will apply selection pressure towards lower productivity, which will inherently decrease the biological efficiency of the animals, and a deterioration in EI could arise. A better global outcome could be achieved much more effectively by reducing the number of animals farmed, but unless animal output is maintained or enhanced this would be extremely expensive in terms of impacts on farming industries, which constitute a means of sustenance for many people worldwide, and on the consumers of animal products.
Genetic gains in EI can also be achieved in the absence of novel GHG-focussed phenotypes (Wall et al., Reference Wall, Simm and Moran2010b). For example, conventional genetic traits such as prolificacy and milk yield that increase output typically result in dilution of GHG emissions associated with maintaining a population of breeding females, when expressed per unit of product. Other genetic traits can reduce the proportion of non-productive animals in the farming system. For example, better survival of breeding females results in less replacements to be reared, and thus the GHG emissions associated with these replacements are reduced. Therefore, the opportunity for genetics to substantially contribute to reduced agricultural GHG emissions, although complex and multifaceted, has great potential (de Haas et al., Reference de Haas, Davis, Reisinger, Richards, Difford and Lassen2016).
This paper demonstrates a framework for including EI as part of a broader economic breeding goal. The framework partitions the EI impacts of traits into four components. These components, combined with some system-level scaling parameters, provide a simple and transparent methodology for calculating EI economic values.
Material and methods
A theoretical derivation was first provided to create a generic framework for inclusion of EI weightings in the formulation of a breeding objective. This framework was then applied within the context of the Irish dairy industry, including a set of example calculations.
Theoretical model
Let GHG EI for a commercial farming operation be defined as follows:
 $${\rm EI}\,{\equals}\,{{\mathop{\sum}\limits_{i\,{\equals}\,1}^c {{\varepsilon}_{i} n_{i} } } \over {\mathop{\sum}\limits_{j\,{\equals}\,1}^p {y_{j} n_{j} k_{j} } }}$$
where the numerator of equation (1) sums ε emissions for a fixed time period (i.e. a year or a typical average breeding interval) across c different animal classes (indexed i) with n number of animals in each class on average per breeding female. The denominator sums per animal product outputs y generated within the fixed time period, across p different product categories weighted by the numbers of animals, n, in the class of animals producing the jth product on average per breeding female, and k are proportionality coefficients that convert multiple products into a ‘main product’ equivalent.
All components of the EI equation defined above can be influenced by genetic selection. For example, emissions ε are influenced by genetic gains in traits that affect feed intake (because GHG emissions such as methane and nitrous oxide are closely linked to the amount of feed consumed, Blaxter and Clapperton, Reference Blaxter and Clapperton1965) and also by trait changes that affect emissions per unit of feed consumed (such as methane yield measured at fixed-feed allowance, or adjusted for feed allowance). It is well known that genetic trait changes can also influence the numbers of animals, n, of different classes; for example, genetic improvement in survival of breeding females is likely to lead to a long-term reduction in the number of replacement breeding females reared, whereas both fertility and prolificacy traits influence total numbers of surplus offspring for rearing and sale. Genetic traits also affect product outputs, y. Thus, the variables ε, n and y can be expressed as functions of genetic merit for a generic genetic trait x.
The marginal change in GHG emissions per unit of output expressed per breeding female (e.g. a dairy or beef cow, a breeding ewe or a milking doe) that arises from a unit change in genetic trait g can be derived by taking the first partial derivative of Equation 1 with respect to genetic merit for a trait x. These values are subsequently referred to as GHG intensity values (IV). The result can be expressed (after rearrangement – see Supplementary Material S1) as the following general formula:
 $$\eqalignno { {\rm IV}{\equals}{{\delta EI} \over {\delta x}}{\equals}&{1 \over {\Sigma y^{{\bar{g}}} }}\left [ {\mathop{\sum}\limits_i {{{\delta {\varepsilon}_{i} \left( x \right)} \over {\delta x}}n_{i}^{{\bar{g}}} {\plus}\mathop{\sum}\limits_i {{{\delta n_{i} \left( x \right)} \over {\delta x}}{\varepsilon}_{i}^{{\bar{g}}}}}}\right \cr & {{\left {\minus}EI^{{\bar{g}}} \left( {\mathop{\sum}\limits_j {{{\delta y_{j} \left( x \right)} \over {\delta x}}n_{j}^{{\bar{g}}} k_{j} } {\plus}\mathop{\sum}\limits_j {{{\delta n_{i} \left( x \right)} \over {\delta x}}y_{j}^{{\bar{g}}} k_{j} } } \right)} }} } \right]} $$
where
 $$\Sigma y^{{\bar{g}}} $$
is an index of total system output at an average level of genetic merit
 $$\bar{g}$$
calculated as the sum over multiple outputs y (indexed j) after multiplication of a scaling factor k
j
that converts units of multiple outputs to a single ‘main product’ output equivalent (i.e.
 $$\Sigma y^{{\bar{g}}} {\equals}\mathop{\sum}\nolimits_j {y_{j}^{{\bar{g}}} n_{j}^{{\bar{g}}} k_{j} } $$
) and
 $$EI^{{\bar{g}}} $$
is the total GHG emissions per breeding female expressed per indexed unit of output at an average level of genetic merit. The first term inside the square brackets of equation (2) accounts for changes in emissions ε
i
of animals in class i because of a change in individual trait x with weighting to account for the number
 $$n_{i}^{{\bar{g}}} $$
of animals in class i per breeding female at an average level of genetic merit. The second term inside the square brackets of equation (2) accounts for changes in numbers of animals of class i because of a change in individual trait x, weighted by emissions per animal of class i. The third term inside the square brackets of equation (2) accounts for the dilution effects of both increased product output per animal (weighted by the number of animals in the class producing the jth product and allowing for different relative product values k, and increases in numbers of output-generating animals in each animal class producing the jth product, which also allows for different relative product values k. At the margin, and with other things being equal, more product output reduces the EI at an average level of genetic merit in direct proportion to the extra output generated.
Indexes
In many instances, it would be desirable to combine IVs with a set of conventional economic values that make up an index excluding GHG emissions. This is because farm profitability drivers are typically used to prioritise traits in genetic improvement programmes (Nielsen et al., Reference Nielsen, Amer and Byrne2014), and it is unlikely that farmers and breeding companies would be motivated to completely switch their selection decisions from their current priorities to a new set of priorities based on EI weightings. An existing economic merit (EM) index can be calculated as follows:
 $${\rm EM}\,{\equals}\,\mathop{\sum}\limits_{t{\equals}1}^T {EV{}_{t} \cdot DGE_{t} \cdot EBV_{t} } $$
where, for each trait t out of a total of T traits, each estimated breeding value (EBV) is weighted by a discounted genetics expressions (DGE) coefficient and an economic value (EV). The impacts of differences in frequency and timing of expressions of traits expressed by different animal classes are accounted for by the DGE, although in some applications, these differences may have been accounted for directly in the definition of the EVs. An expanded index reflecting merit aggregated (AM) across EI effects through a future carbon price and farm profitability effects would then take the following form:
 $${\rm AM}\,{\equals}\,\mathop{\sum}\limits_{t{\equals}1}^T {\left( {EV{}_{t}{\plus}\alpha \cdot \beta \cdot \gamma \cdot IV_{t} } \right) \cdot DGE_{t} \cdot EBV_{t} } $$
where α converts units of product output to the same animal or farm system-level scale that applies for the conventional breeding objective, β quantifies the financial implication associated with a change in EI as defined in ε
i
coefficients, and γ is a concentration (value>1) or dilution factor (value<1) that can be used to arbitrarily change the relative weighting given to EI in the final selection priority. In the situation where EBVs are directly available for all traits for which either an EV or a IV has been derived, a vector containing values calculated as
 $$\left( {EV{}_{t}{\plus}\alpha \cdot \beta \cdot \gamma \cdot IV_{t} } \right) \cdot DGE_{t} $$
constitutes the breeding objective or breeding goal for an entity such as a breeding programme or a national industry, where the breeding goal has now been expanded to account for trait impacts on EI.
Traits missing from the breeding objective
When the set of traits for which EBV are available is only a subset of all traits for which IV can be derived, correlated genetic changes in those traits for which IV are calculated but for which no EBV is available can, in principle, be accommodated. This was achieved by computing proxy EBV from the genetic regression coefficients of the missing trait on correlated traits for which EBVs are known (James, Reference James1981) as follows:
 $${\bf EBV}_{u} \,{\equals}\,{\bf CG}^{{{\minus}1}} {\bf EBV}_{k} $$
where EBV u and EBV k are vectors of EBVs that are unknown (subscript u) and known (subscript k), respectively; C is a matrix of genetic co-variances between traits with unknown EBVs and traits with known EBVs; G is a genetic variance–covariance matrix for traits with known EBVs.
Impact evaluation
In application, a breeding programme analyst can quantify the impact on GHG EI for a population arising from selection using various alternative indexes. Although this can be computed using standard selection-index theory, an alternative is to use an existing set of EBVs available for a typical set of current selection candidates. It is preferable to define specific sets of candidates with similar recorded information and similar numbers of relatives with recorded information, and within a limited time window, to avoid effects of genetic trends being greater in some traits than in others. Indexes for EM and AM can be computed by first deriving IV and sourcing EV and DGE for the relevant EBV available for the population of selection candidates. A regression coefficient b t,I for each EBV trait t on each index I of interest can then be calculated using standard linear regression within the population of selection candidates of interest. Thus, the expected change in index I* from a unit change in index I can be computed as follows:
 $$\Delta I^{\asterisk}{\equals}\mathop{\sum}\limits_{t{\equals}1}^T {b_{{t,I}} \cdot EW_{t}^{I} } $$
where
 $$EW_{t}^{I} $$
make up the set of weights that define index I.
Application to the Irish dairy industry
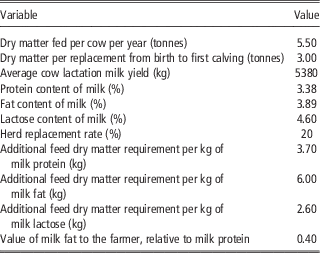
The framework described above was applied to consider impacts of methane EI due to genetic changes in key traits on the Irish dairy industry. Equation (2) was therefore parameterised assuming two animal classes generating emissions, adult cows (i=C) and replacement heifers (i=R), and two product outputs, milk protein (j=P) and milk fat (j=F). We consider four traits for which selection is expected to have a significant impact: milk-protein yield (protein), milk-fat yield (fat), calving interval and survival. Key assumptions used in the calculations are in Table 1. Output is defined in terms of protein equivalents, in which milk-fat production is converted to protein equivalents by multiplying by 0.4 to account for the relative farm-gate value of milk fat relative to milk protein.
Key assumptions used in the calculations of greenhouse gas emission intensity weightings for the Irish dairy industry

A key component of the methodology used here is based on the assumption of a direct relationship between the level of enteric GHG emissions (methane) and the overall dry-matter consumption of dairy animals. Here we assume a constant coefficient of 0.583 kg of carbon dioxide equivalents (CO2e) for every kg of dry matter consumed. This is based on assumptions that 7% of gross feed energy intake is lost as methane, that the energy content of methane is 55.2 MJ/kg and that 25 CO2e emissions are generated for every kg of methane gas. This value is similar to the value of 0.0216 kg CH4/kg DM×25 kg CO2e/kg CH4=0.540 kg CO2e/kg DM used by O’Mara (Reference O’Mara2006), which was based on New Zealand pasture systems that are similar to Ireland.
The dry-matter feed requirements for an extra kg of protein and fat were calculated to be 3.7 and 6 kg, respectively (see Table 1), based on energy contents described in NRC (2001) and assuming 11.5 MJ of ME per kg of dry matter fed to lactating dairy cows.
Genetic trends were calculated directly from the Irish Cattle Breeding Federation database as the average predicted transmitting abilities (PTAs) of cows by birth year of the cow for protein and fat (kg per standard lactation per cow per lactation), calving interval (number of days between successive calvings) and survival (average probability of surviving to the next lactation averaged over the first three successive pairs of parities). These were multiplied by 2 to translate PTAs into EBVs. Future genetic trends were predicted by fitting a simple linear regression slope through the most recent 4 years (to give a trend based on the last 3 years of genetic change) of average cow-breeding values by birth year.
Sensitivity analysis
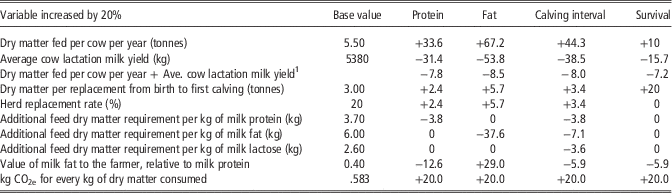
The effects of changing a number of key input parameters on EI values for protein, fat, calving interval and survival were tested. All tested input values were increased individually by 20% and new EI values were calculated. The effect of a simultaneous increase in both milk production per cow and total dry matter fed per cow per year, both increased by 20%, was also tested.
Results
Total emissions per cow were 3556.3 kg CO2e and the total protein-equivalent output per cow (
 $$\Sigma y^{{\bar{g}}} $$
) was 265.6 kg, giving an average EI before any genetic gain (
 $$EI^{{\bar{g}}} $$
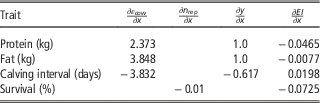
) of 13.39 kg CO2e per kg of protein equivalent. Protein, fat and calving interval were all calculated to have an impact on emissions per cow (shown in Table 2). For genetic gains in milk-protein and milk-fat yield by 1 kg, emissions were calculated as the products of the associated dry-matter production (see Table 1) and the constant coefficient of 0.583 kg of CO2e for every kg of dry matter consumed. A 1-day increase in calving interval was assumed to result in a 1-day shorter lactation with 12.5 kg of milk production lost because of later-calving cows requiring drying off one day earlier in the seasonal calving system. The reduced milk yield results in 12.5 kg milk×3.38% protein, added to 12.5 kg milk×3.89% fat×0.4 value equivalents, for a total reduced output of 0.617 milk-protein equivalents. The corresponding reduction in dry-matter intake by 5.75 kg causes a reduction in emissions per cow by 3.35 kg CO2e. A 1% improvement in cow survival was assumed to result in a 1% reduction in numbers of herd replacements required per cow in the herd.
Trait-specific components of the emission intensity calculationsFootnote 1

1 Refer to equation (2) and corresponding definitions.
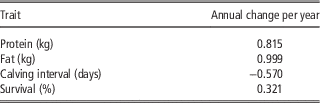
Genetic trends in PTAs of recorded cows born in Ireland by year of birth from 2013 to 2016 are in Table 3. All traits have demonstrated favourable genetic trends.
Average genetic trends in predicted transmitting abilities for key breeding traits for cow year of birth cohorts from 2013 to 2016Footnote 1

1 Values need to be multiplied by 2 to generate trait values as expressed by cows.
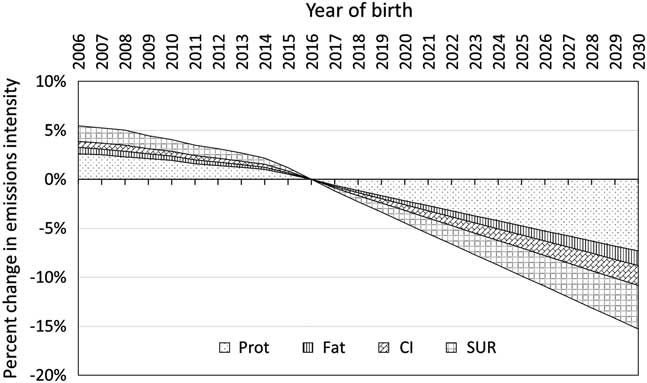
Figure 1 shows how genetic trends until 2016, and projected genetic trends from 2016 onwards (based on the 2013 to 2016 trends), contribute to changes in GHG emission intensities. The genetic traits contributing to EI reductions, in descending order, were protein, survival, calving interval and fat. Protein has a large genetic trend and dilutes the fixed per cow emissions per unit of product. Survival genetic trends are moderate, but have a significant impact because of the reduced emissions associated with rearing replacements. Although fat has a greater genetic trend than protein because of more genetic variation being present for fat yield than for protein yield, and because of the high genetic correlation between fat and protein, the dilution effect of fat is much reduced, because the relative product value of fat is substantially lower than that of protein.
Contributions of genetic trends in protein (Prot), fat, calving interval (CI) and survival (SUR) to percentage reductions in greenhouse gas emission intensity values relative to 2016 for the Irish dairy industry.

Table 4 shows the percentage changes in EI values as key inputs were increased individually by 20%. No results are shown for protein, fat and lactose composition of the milk, as these variables can be quantified accurately for any population, and no change greater that 2% in EI value was observed when the percentage of each assumed milk component was varied by 1 standard deviation (standard deviations were taken from Buckley et al., Reference Buckley, O’Sullivan, Mee, Evans and Dillon2003). Values of EI were highly sensitive to individual changes in milk yield and cow annual feed (up to 70% change in EI values for a 20% change in input), but when these two traits were changed simultaneously by 20%, the EI values for all four traits changed by <10%. The EI value for survival was directly proportional to the amount of feed required to rear a replacement, but completely insensitive to herd mean replacement rate. The EI for fat was highly dependent on the value assumed for the additional feed required per kg of fat yield, whereas the assumptions for feed requirements associated with other milk components had only minor effects. Fat requires relatively high feed energy relative to other milk components, and has low dilution impact because of its low market value relative to protein. Increasing the market value of fat relative to protein increased the EI value for fat substantially (by 29%) while decreasing the EI value for protein (by 12.6%). The decrease for protein is due to a lower dilution effect on product value when fat is proportionately more valuable, whereas the increase for fat reflects the low base EI value for fat.
Percent changes in trait emissions intensity values when key input parameters were increased by 20%

1 Dry matter fed per cow per year, and average cow lactation milk yield per year simultaneously increased by 20%.
Discussion
This paper presents a methodological framework for computing linear weighting factors that can be incorporated into conventional selection indexes to reweight selection emphasis, based on trait contributions to improvements in EI. Although the key equation for deriving the EI weightings is comprehensive and generalised to accommodate a wide range of trait effects, the application example used here has demonstrated that when working through each trait of interest, many components of the equation are not relevant, and therefore application is more straightforward than was first apparent from the equation. To date, the alternative approach has been to use complex bioeconomic models that require expansion to track methane production, and which involve many complicated interacting terms that are difficult to describe and often contain implicit assumptions that are quite difficult to describe when documenting the approach taken. The approach described here is more consistent with a so called ‘trait by trait’ approach to define the breeding objective, as summarised and discussed by Nielsen et al. (Reference Nielsen, Amer and Byrne2014). One of the key advantages of the ‘trait by trait’ approach to formulating breeding objectives is the ability to reduce the level of complexity to that required for an accurate and transparent calculation of the weighting for each individual trait.
The approach described here captures the three main opportunities for reducing EI through selective breeding of livestock described by Wall et al. (Reference Wall, Simm and Moran2010b), namely, improvement of productivity or efficiency, reduced animal wastage and traits that directly affect emission output. Bioeconomic approaches used so far to quantify these effects include a model for New Zealand sheep, which computed the gross emissions and EI effects of alternative trait changes and showed the trade-off that occurs as selection emphasis is shifted from an index based purely on profitability to one based on achieving better gains in emissions (Ludemann et al., Reference Ludemann, Byrne, Sise and Amer2011). Wall et al. (Reference Wall, Ludemann, Jones, Audsley, Moran, Roughsedge and Amer2010a) also used bioeconomic modelling to evaluate traits for the sheep, beef and dairy industries in the United Kingdom. Bell et al. (Reference Bell, Eckard, Haile-Mariam and Pryce2013) evaluated the impact of trait changes on GHG emissions per cow and per unit of product in the Australian dairy industry. As found in this study, the dilution effects of additional milk products on EI and the benefits of survival and fertility traits for reducing the number of replacements were shown. Thus, trait changes that result in improvements in GHG EI also increase animal efficiency and farm productivity.
The use of weighting factors (k values in the method described here) is important to correctly account for the fact that many livestock industries generate multiple products. Basing these values on economic criteria is desirable, namely the farm gate product value, which reflects the consumer value of the animal production outputs after accounting for supply chain and distribution costs associated with each product. Although farm gate prices are variable over time, we believe they provide a more accurate reflection of relative output values than biological alternatives such as expressing benefits per unit of energy-corrected milk. In the dairy cow example, fat typically has higher energy content than protein, but a lower farm gate unit value, so weighting outputs based on energy content could lead to substantially different conclusions to those found here for the value of protein v. fat.
The relative emphasis given to EI weightings derived using the methodology described here, v. that given to conventional farm-profit-based trait weightings, will be a key driver of the impact that genetic selection for reduced EI will have in practice. Although estimates of the shadow value of carbon emissions used to inform government policy for GHG abatement in many countries offer an objective means of determining the relative weighting to place on EI gains, as opposed to farm profit gains, such an approach assumes a fully transparent carbon market operating at the farm level. In reality, it is challenging for individual farmers to be rewarded for EI reductions because it is completely impractical to audit and reward the different gains achieved by subsets of farmers with different sources of gene stocks; however, a novel approach to auditing genetic gains in EI reductions might come through linking genetic evaluation databases with records of sire and semen purchased by commercial farmers. Provided the administration is prepared to rely on the integrity of the trait genetic merit predictions and relationships between the traits and GHG emissions, genetic changes at a commercial farm level could quite simply be audited by sampling a modest number of commercial animals and testing their genomic relationship with a suitable reference population. Although there would be some administration costs, they are likely to be substantially less than those required for the administration of many other production system changes that result in EI improvements, and which would not otherwise be adopted because of misalignment with alternative drivers for farm decision-making, such as profitability.
The purpose of this study was primarily to present a methodological framework. It is, however, worthwhile to make comparisons of results from the example presented for the Irish dairy industry with results from more formal life-cycle assessments. O’Brien et al. (Reference O’Brien, Brennan, Humphreys, Ruane and Shalloo2014) and O’Brien et al. (Reference O’Brien, Hennessy, Moran and Shalloo2015) estimated total CO2e emissions per kg of fat- and protein-corrected milk within the ranges of 0.6 to 2.13 (average 1.2) and 0.87 to 1.72 (average 1.11), respectively, across a large number of farms. Given that only 45% of total EI were attributed to the enteric values in the study by O’Brien et al. (Reference O’Brien, Brennan, Humphreys, Ruane and Shalloo2014), the value of 0.453 CO2e emissions per kg of milk (at 3.38% protein and 3.89% fat) calculated in this study falls close to the middle of the range of these estimates.
O’Brien et al. (Reference O’Brien, Shalloo, Grainger, Buckley, Horan and Wallace2010) showed that higher-milk-producing strains of Holstein-Friesians had higher EI values than lower-producing strains. A driving factor for this outcome was the fact that the higher-milk-producing strains had poorer fertility. Thus, the emissions associated with rearing additional replacements for the high-producing strains offset the dilution benefits of the higher milk yield. The current genetic trend in Ireland is for a balanced improvement of both milk production per cow and fertility and survival; thus, genetic improvement within breeds and strains has been associated with a strong EI improvement across a balance of genetic traits.
Sensitivity analysis revealed the importance of accurate specification of a subset of the input parameters; however, these are relatively straightforward to specify for a population, as they are commonly reported in scientific studies and/or industry statistics. The feed requirements associated with additional fat production has been well characterised for many years, and the amount of methane emitted per unit of feed consumed is a key input for most inventory systems that account for GHG emissions from livestock.
Although the methodological framework provides a basis for including novel methane yield traits that predict genetic variation in emissions per unit of feed, the example used here did not account for inclusion of these traits. This was because they are not currently included in genetic evaluations of Irish dairy cattle. The development of selection criteria for methane yield traits is currently the focus of substantial international research. In order to be included in this model framework, it must be ensured that these novel traits are specified independently of other traits considered within the framework. Otherwise, there will be problems with double counting.
Conclusion
An alternative methodological framework to using complex bioeconomic models is now available for deriving EI weighting factors for inclusion in genetic selection indexes. When applied to dairy cattle breeding in Ireland, the methodology demonstrated that genetic trends in both milk-production and cost-saving traits have contributed, and will continue to contribute, to substantial improvements in GHG EI.
Supplementary material
To view supplementary material for this article, please visit https://doi.org/10.1017/S1751731117001549