INTRODUCTION
Organic farming is an alternative to conventional farming methods and has been adopted in a wide range of climates and soil types (Altieri Reference Altieri1995; Gomiero et al. Reference Gomiero, Pimentel and Paoletti2011). Since the early 1990s, organic farming has grown rapidly in almost all European countries, where more than 8 million hectares are managed organically. The increase is mainly due to high production in Spain (Willer & Kilcher Reference Willer and Kilcher2009).
Conventional agriculture can result in a loss of organic matter (OM), increasing degradation of cultivated soils. Soil OM is a key soil resource that needs to be maintained and managed for agricultural sustainability (Whitbread et al. Reference Whitbread, Blair, Konboon, Lefroy and Naklang2003). Recently, the effect of OM amendments on soil properties has received renewed attention. Studies comparing organic and mineral fertilization in soils show higher OM and total nitrogen (N) for organic-amended soils (Warman Reference Warman2005; Gomiero et al. Reference Gomiero, Pimentel and Paoletti2011). The amount of OM accumulated in the soil can vary, mainly depending on the type of OM applied and its decomposition rate (Haynes & Naidu Reference Haynes and Naidu1998).
Usually, organically amended soils show significantly higher soil macronutrient content (Edmeades Reference Edmeades2003). However, other authors have indicated lower macronutrient contents for organically fertilized soils (Gosling & Shepherd Reference Gosling and Shepherd2005). Stockdale et al. (Reference Stockdale, Lampkin, Hovi, Keatinge, Lennartsson, Macdonald, Padel, Tattersall, Wolfe and Watson2001) reported that available phosphorous (P) and potassium (K) showed an increase or decline in soils under organic treatment (OT) depending on farm management methods. In organic farming, trends in soil nutrient and OM status are likely to be more important than snapshot analyses (Watson et al. Reference Watson, Bengtsson, Ebbesvik, Løes, Myrbeck, Salomon, Schroder and Stockdale2002).
The influence of soil fertilization on nutrient content in crops has been studied and different results have been recorded. Some authors have found that fruits and horticultural crops grown organically have contained more minerals and vitamins than crops grown conventionally (Bourn & Prescott Reference Bourn and Prescott2002; Magkos et al. Reference Magkos, Arvaniti and Zampelas2003), although this could not only be due to fertilization, but also to other agricultural practices involved in the management. Other authors have shown that the application of OTs improves soil nutrient content, but does not always increase plant nutrient concentrations (Roe Reference Roe1998; Warman Reference Warman2005; Maqueda et al. Reference Maqueda, Herencia, Ruiz and Hidalgo2011). Some studies have shown that the nutrient content in plants depends on crop type, nutrient type and climate type of the year of study (Warman & Havard Reference Warman and Havard1997, Reference Warman and Havard1998; Herencia et al. Reference Herencia, Ruiz-Porras, Melero, Garcia-Galavis, Morillo and Maqueda2007). Furthermore, some of the comparisons made in the scientific literature were not experimentally valid due to variations in crop varieties, timings in fertilization, field management, and handling and storage methods after harvest, leading to different results for nutrients and crops (Warman & Havard Reference Warman and Havard1997). Therefore, the results were too variable to make any definitive conclusions.
Comparisons of organic with conventional systems are complex and difficult (Watson et al. Reference Watson, Walker and Stockdale2008). The literature shows studies with different soil types, crops, edaphoclimatic conditions, type of amendments and applied amounts, etc., so it is very difficult to compare results. Furthermore, very little information exists regarding organic agriculture, especially when residues of previous crops are applied (Shafi et al. Reference Shafi, Bakht, Jan and Shah2007). In addition, the great majority of literature deals with the use of organic amendments without applying the techniques listed and recommended in organic farming, which are very important for the viability of the system (e.g. using crop rotations) (Kristiansen et al. Reference Kristiansen, Taji and Reganold2006).
The current paper is an effort to reduce the number of potential factors affecting nutritional values, having the advantage of using the same cultivar, planting system, soil and climatic conditions in a long-term comparison of organic v. conventional agriculture. It approaches the system from a holistic perspective, including all the aspects of the system that are interrelated (soil, plant and crops). In addition, several crops were used to know the effect of organic farming on plants with different physiological characteristics.
Several authors (Lucho-Constantino et al. Reference Lucho-Constantino, Alvarez-Suarez, Beltran-Hernandez, Prieto-Garcia and Poggi-Varaldo2005; Gil et al. Reference Gil, Calvo, Blanco and Sanchez2008) have indicated the usefulness of multivariate methods in assessing the effects of soil amendments on soil properties. The use of principle component analysis (PCA) takes into account the correlation between different variables analyses simultaneously and allows easier interpretation of the results.
The objectives of the current paper were to determine: (i) the soil fertility of a calcareous silty soil with different plots that had been previously handled conventionally and ecologically for several years, (ii) the nutrient content in the leaves and edible parts of different crops from the different treatments and (iii) crop yields. Four treatments were tested: one inorganic treatment in conventional plots, two OTs at two doses of manure compost in plots previously managed ecologically for 4 years and one OT in plots managed ecologically for 10 years and fertilized with residues of previous crops.
The data were evaluated with statistical multivariate analysis such as Pearson correlation and PCA.
MATERIALS AND METHODS
Field study
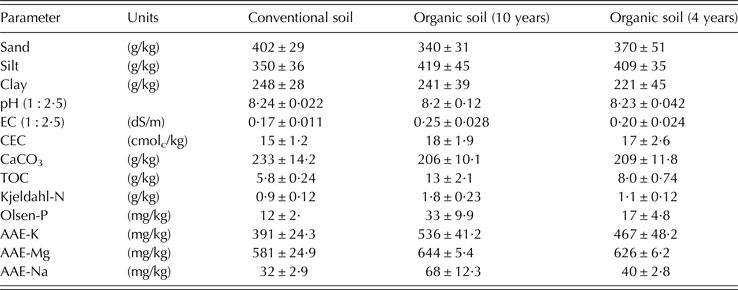
The field study was carried out on a silty loam soil classified as a Xerofluvent (Soil Survey Staff 1999). The study site (37°8′N, 5°16′W, 20 m a.s.l.) was located in the Guadalquivir River Valley (south-western Spain), at the Andalusia Research Centre of Agriculture farm in Alcalá del Río (Seville). This farm has different plots that have been managed conventionally and ecologically for several years. The textural and chemical characteristics of the soil at the beginning of the experiment are shown in Table 1.
Some soil characteristics at the beginning of the experiment (n = 12)
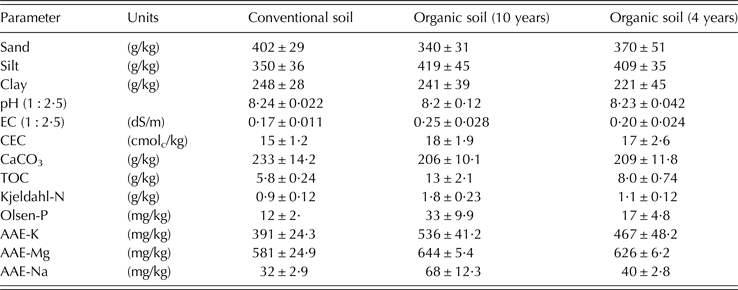
Data are the mean of all plots±standard deviation (s.d.).
EC, electrical conductivity; CEC, cation exchange capacity; TOC, total organic carbon; AAE, ammonium acetate extractable cation.
A completely randomized experimental design (four replicates per treatment) was conducted in 16 sub-plots of 10 × 20 m2. Four treatments were tested: (i) conventional treatment with synthetic fertilizer (CT) in conventional plots (ii) OT with manure compost at low doses (LD) in plots after 4 years of OT, (iii) OT with manure compost at high doses (HD) in plots after 4 years of OT and (iv) organic plots with 10 years of organic management (OR), fertilized only with residues of previous crops.
The OTs utilized manure compost and residues of previous crops. The inorganic treatment was managed with chemical fertilizer. The compost was made by the wind-row method. The usual length of time for composting was 12–14 weeks. The LD treatment was fertilized with 10 t/ha of compost to supply <170 kg N/ha, the limit allowed by European Regulation for organic farming. The HD treatment was fertilized with double doses of compost (20 t/ha) to investigate the effect of increasing N, the main limiting factor for organic crops, on crop development.
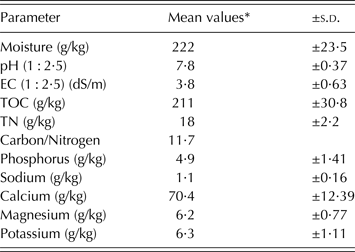
The chemical characteristics of the compost are shown in Table 2. Compost values are the means of five samples collected every spring and autumn during the study.
Some chemical characteristics of manure compost
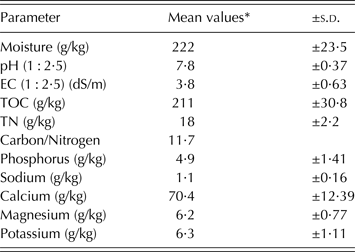
EC, electrical conductivity; TOC, total organic carbon; TN, total nitrogen.
* The data are the mean of five samples analysed. Dates were expressed based on oven-dry weight of compost.
The organic plots with 10 years of organic management were fertilized only with residues of previous crops (OR) in order to determine whether this long-term organic system is sustainable in these conditions.
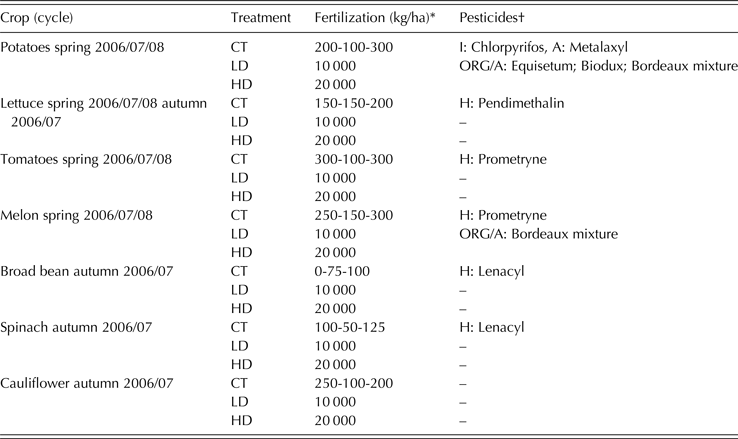
The CT was fertilized with synthetic fertilizers applied at the doses recommended by the literature for each crop in the region (Maroto Reference Maroto1995). The commercial fertilizers were ammonium nitrate (335 g N/kg), polyfeed (200-50-320 g N, phosphate (P2O5), potash (K2O)/kg), potassium nitrate (130-0-460 g N, P2O5, K2O/kg) and ammonium phosphate (120-606-0 g N, P2O5, K2O/kg). Commercial pesticides were used as shown in Table 3.
Crop cycles, fertilization and pesticides applied in the three treatments across the study
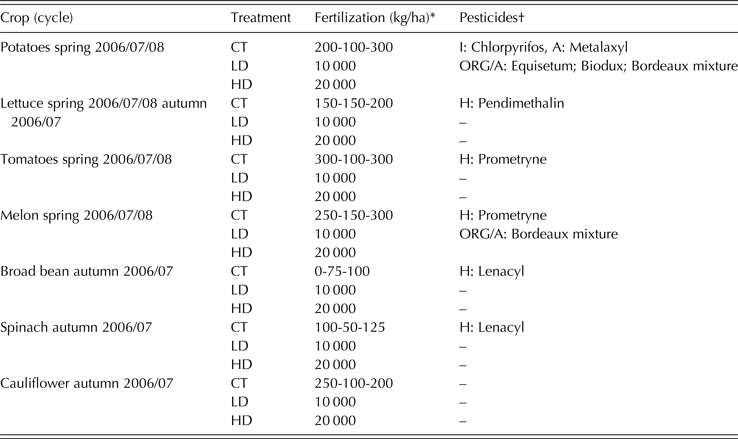
CT, conventional treatment; LD, organic compost low doses; HD, organic compost high doses.
* N-P2O5-K2O.
† Pesticides applied: I, Insecticide; A, antifungal; H, herbicide.
Organic treatments, compost or previous crop residues, were applied by superficial tillage and mineral fertilizer was applied though the drip irrigation system for each crop cycle. This superficial tillage meant that soil was only disturbed to a depth of 200 mm.
The plots were separated with a 3-m grass strip to minimize cross-contamination with fertilizer and, fundamentally, pesticides. The fertilization and pesticides used are shown in Table 3.
A crop rotation system under organic (Council of the European Union 1991) and conventional soil fertilization was performed from 2006 to 2008 over five cultivation cycles. There were two crop cycles per year. The crop cycles and rotations for the study period are shown in Table 3. The following crops were grown: potato (Solanum tuberosum L. var. Spunta), tomato (Lycopersicon esculentum Mill. var. Plato de Egipto), lettuce (Lactuca sativa L. var. Oreja de mulo), melon (Cucumis melo var. Piel de sapo), spinach (Spinacia oleracea L. var. Gigante de invierno), broad bean (Vicia faba L) and cauliflower (Brassica oleracea var. Botrytis L). Crop rotations that include different crop families are a key element in organic cropping systems and necessary to maintain field productivity. These crops were chosen in the current paper because the organic farmers in the region normally use these types of crops in their rotation systems.
Crops with different characteristics were chosen to determine which of them are more sensitive to the change of various nutrients within the treatments and better adapted to organic farming.
Weed control in OTs was performed by mechanical tillage, whereas in the CT it was performed by herbicides. The crops were irrigated by drip irrigation during the whole crop period. The climatic characteristics of the farm are average annual rainfall 650 mm, 18 °C average temperature and 4 mm average daily evapotranspiration.
Sampling and soil analysis
At the beginning of each crop period (before fertilization), soil samples from the upper layer (0–15 cm) were taken randomly from each plot, air-dried and sieved (2 mm mesh size) and stored in plastic containers before further analysis. Soil pH and electrical conductivity (EC) was determined in the 1 : 2·5 soil/water extract, Kjeldahl-N was determined by the method described by Hesse (Reference Hesse and Hesse1971), available P using the Olsen et al. (Reference Olsen, Cole, Watanabe and Dean1954) method, available K using extraction with ammonium acetate (MAPA 1994) and OM using the Walkley–Black method, modified by Jackson (Reference Jackson1958). Cation exchange capacity was determined by the Tucker method (Reference Tucker1954). Particle size distribution was measured by the Bouyoucos densimeter (Gee & Bauder Reference Gee and Bauder1979) and total carbonate content by the manometric method (Demolon & Leroux Reference Demolon and Leroux1952).
Plant and compost analysis
At harvest, the edible portion of each crop was sampled for analysis. In order to determine plant nutritional status, the youngest fully expanded leaves at flowering were also taken for analysis. The samples were carefully removed, washed with tap water to remove any attached soil particles, rinsed twice with distilled water and then dried at 60 °C. Afterwards, dried samples were passed through 40-mesh screens and stored in plastic containers. Plant Kjeldahl N was carried out with acid-digestion prior to determination by autoanalyser (BRAN + LUEBBE, method G-188-97, BRAN + LUEBBE, Norderstedt, Germany). For P, K, Mg and sodium (Na), the samples were dry ashed: the ash was treated with hot concentrated hydrochloric acid (HCl) and the element concentration determined by inductive coupled plasma. Plant nitrate concentration was determined using the hydrazine reduction method in 2% acetic acid plant extract and analysed using an autoanalyser (Kamphake et al. Reference Kamphake, Hannah and Cohen1967). The organic compost was determined by the methods of MAPA (1994).
Statistical analysis
The results were analysed by analysis of variance (ANOVA) with treatment (CT, LD, HD and OR) as the independent variable. All statistical analyses were performed with the program SPSS 11.0 for Windows (SPSS 2001). Significant statistical differences between treatments were established by the Tukey's test at P < 0·05. A correlation matrix was calculated with the values of the different parameters. The significance levels (P < 0·01 and P < 0·05) are based on the Pearson coefficients.
To investigate the relationships between the soil management and the soil properties and nutrient concentrations in vegetables crops, a multivariate statistical analysis technique (Varimax-rotated PCA) was used and the first three components were retained.
RESULTS
Soil parameters
At the beginning of the experiment, the values for soil parameters were found to be different between treatments. The soils managed organically presented higher values of total organic carbon (C), N, P and available macronutrients than the conventional ones. The values were associated with the number of years of treatment (Table 1).
The results of EC obtained in the study indicated that there were no significant differences of this parameter between treatments in general (Fig. 1(a)). The differences occurred among cultivation cycles regardless of the type of fertilization. The higher values were detected in autumn cropping cycles and the lower in spring cycles.
Values of (a) EC; (b) pH; (c) organic carbon (C), (d) Kjeldhal nitrogen (N), (e) phosphorus-Olsen (P), and available content of (f) potassium (K), (g) magnesium (Mg) and (h) sodium (Na) in soil with different fertilization type across different cultivation cycles ranging from 2006 through 2008. Spring (S) and autumn (A). CT, conventional treatment; EC, electrical conductivity; LD, organic treatment at low doses; HD, organic treatment at high doses; OR, long-term organic treatment fertilized only with residues of previous crops. Error bars indicate standard deviation of means.

The values of pH between treatments did not generally show any significant differences among treatments, with the lower values being fundamentally reported in OR treatment (Fig. 1(b)). Inversely to EC, the higher values were observed in the spring and the lower ones in the autumn.
Soil C content was found to be significantly greater (P < 0·05) in organic fertilized soils in comparison with soil receiving mineral fertilizer (Fig. 1(c)). The highest content was observed in the OR. In the HD and LD OTs, the C values showed a continuous increase throughout the study with a tendency to reach the OR treatment values in the last cycle, so that differences were not significant in the last two cycles between the three OTs. In addition, the Figs show that C values in the mineral-fertilized plots were constant throughout the study, but were slightly higher than the original values in the last crop cycle.
Nitrogen content (Fig. 1(d)) showed a similar behaviour to that of C content. The N contents in the organically managed plots were significantly higher (P < 0·05) than in the mineral ones. Nitrogen in the OR treatment was constant across the study. Nevertheless, a significant (P < 0·05) increase in N contents was observed in the plots that were organically amended with compost (LD and HD). In the first crop cycles, the N of mineral-fertilized plots (CT) was constant, but was slightly higher than the original values at the end of the experiment.
The available P content in the organically managed plots was higher (P < 0·05) than in the mineral ones, fundamentally in the OR and HD treatments (Fig. 1(e)). However, unlike C and N, the LD and HD treatments showed statistical differences between them, except for the last cycle. The differences between LD and CT treatments did not show any statistically significant differences until the fourth crop cycles.
The values of available K in the plots managed organically were slightly higher than those of the mineral plots in the first cycles, with the differences only being statistically significant (P < 0·05) in some cases (Fig. 1(f)). The differences occurred among cultivation cycles regardless of the type of fertilization. The HD treatment showed the highest values in the last cycle.
The values of available Mg in the organic plots were higher (P < 0·05) than in the mineral ones. In the beginning, OR showed the highest values but the higher values were shown for the HD treatment in the last cycle (Fig. 1(g)).
The available Na content showed a similar behaviour to that of EC (Fig. 1(h)). In general, there were no significant differences between treatments, and only significant differences (P < 0·05) between OR and CT treatment in two crop cycles (spring 06 and autumn 07), but these were with opposite trends. The differences occurred among cultivation cycles. The higher values were detected in autumn cycles, and the lower values in spring cycles.
Leaf nutrients content
The N results obtained in the current study indicated that there were no significant differences between treatments in general (Fig. 2(a)). Only two crops (tomato and potato) showed statistically significant differences (P < 0·05) between treatments.
Values of (a) nitrogen (N), (b) phosphorus (P), (c) potassium (K), (d) magnesium (Mg), and (e) nitrate contents (NO3) in the leaf of crops. CT, conventional treatment; LD, organic treatment at low doses; HD, organic treatment at high doses; OR, long-term organic treatment fertilized only with residues of previous crops. The values represent the mean of the different cultivation cycles. Error bars indicate standard deviation of means. LE, lettuce; ME, melon; BE, bean; CA, cauliflower; SP, spinach; TO, tomatoes; PO, potatoes.

A clear trend for higher leaf P content in organic crops was observed (Fig. 2(b)). However, P was higher (P < 0·05) in only three of the seven crops analysed.
In contrast to P but similar to N, K and Mg content in leaves did not show a clear trend. The results indicated that there were few significant differences between treatments (Figs 2(c) and ( d )). Among the crops grown in the experiment, only three of them (potato, spinach and cauliflower) showed differences (P < 0·05) in K leaf contents between the mineral and OTs, but these indicated contradictory trends. For Mg, only bean and cauliflower showed higher values for the OT.
The results of nitrate content in leaves for the different crops studied are shown in Fig. 2(e). The values showed great variability for each crop and also among different crops.
Crop nutrient content
The nutrient contents in the edible portion of the crops are shown in Figs 3(a)–(d). The results were also the mean of the crops across different cycles. In general, the results showed a similar behaviour to that of the leaf content, but with some differences. The influence of the type of crop on nutrient concentration was more remarkable than was seen in leaves. There were no great differences in N content between treatments, but the CT and OR treatments showed a trend towards higher values, with the exception of the bean crop, and the differences were significant in some cases. The P content showed a trend to higher values in OTs, and the K content showed a slight trend towards higher values in the OR that were sometimes statistically significant.
Values of (a) nitrogen (N), (b) phosphorus (P), (c) potassium (K), and (d) magnesium (Mg) contents in the edible portion of crops. CT, conventional treatment; LD, organic treatment at low doses; HD, organic treatment at high doses; OR, long-term organic treatment fertilized only with residues of previous crops. The crop values represent the mean of the different cultivation cycles. Error bars indicate standard deviation of means. LE, lettuce; ME, melon; BE, bean; CA, cauliflower; SP, spinach; TO, tomatoes; PO, potatoes.

The content of dried mass of the edible part of the crop is given in Fig. 3(e), and the results showed no significant differences between treatments.
Correlations between soil parameters and nutrient content in leaves and the edible portion of crops
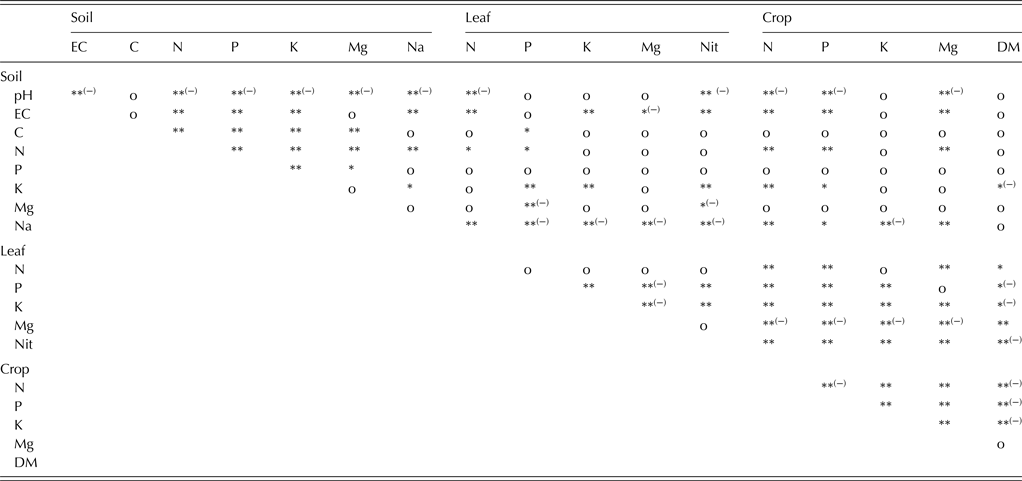
The correlation coefficients between soil parameters and nutrients from the leaf and the edible part of crops are reported in Table 4. The soil parameters C, N, P and K content showed a high correlation coefficient between them (P < 0·01). In addition, Mg showed a positive correlation with both C and N (P < 0·01), as well as with P (P < 0·05). Finally, a positive correlation was also found between EC and some soil parameters (N, P, K and Na). However, a negative correlation between pH and all soil parameters was observed with the exception of C. It is interesting to observe that there were no correlations between C and the physicochemical parameters pH and EC. Sodium was significantly and positively correlated with EC, N (P < 0·01) and K (P < 0·05), but negatively correlated with pH (P < 0·01).
Correlation coefficients between soil parameters and edible crop and leaf plant content
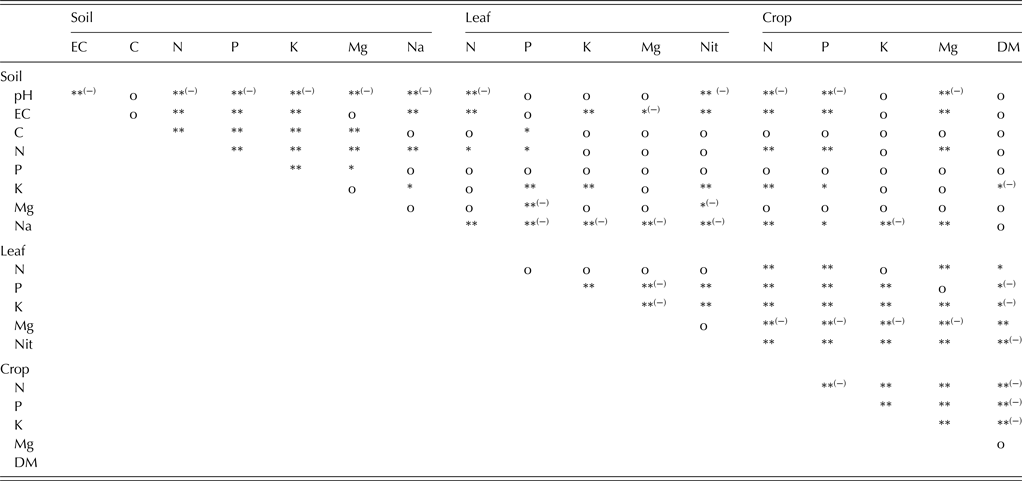
EC, electrical conductivity; C, organic carbon; N, nitrogen; P, phosphorus; K, potassium; Mg, magnesium; Na, sodium; Nit, Nitrate; DM, dry matter.
*Correlation is significant at the 0·05 level; **Correlation is significant at the 0·01 level; (−), negative correlation value; o, no correlation.
sample data = 60.
A high positive correlation between the nutrient content in the edible part of crops was observed. In addition, there were also significant and positive correlations with leaf nutrient content, except for Mg, which was negative.
However, few relationships were found between soil and plant nutrient contents, both for the leaf and the edible portion of the crops. Only soil N and K showed a positive correlation with some plant nutrients. Soil Na also showed a high correlation with other nutrients, but with contradictory trends. On the other hand, a negative correlation was found between pH and some plant nutrient parameters. Nevertheless, in contrast to the results for pH, a positive correlation was found between EC and plant nutrient parameters with the exception of leaf P and Mg, and P in the edible portion of crops.
Principal component analysis of soil properties
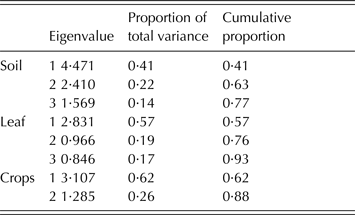
The possible association between soil fertility and the correlation with crop nutrient contents was checked by PCA, since it could reduce the number of variables. The components were rotated using Varimax rotation.
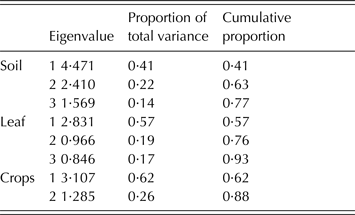
Data were analysed for soils with and without compost. Table 5 gives the eigenvalues and proportion of explained variability for soil data. The first three principal components were selected; they have eigenvalues >1·0 and represent 0·77 of the total variation.
Eigenvalues and proportion of explained variable and cumulative proportion of total variable in the Varimax-rotated principal components analysis (PCA) of data
The factor-loadings for the first three principal components of variables measured are shown in Fig. 4. The first factor (0·41 of variance) comprised the soil parameters with high loadings. The results showed that C, N and P accounted for most of the first component (0·41 of variance). Sodium, EC, K and pH showed the largest coefficients for the second component (0·22 of variance), while the largest coefficient of the third factor (0·14 of variance) was for Mg.
Factor-loadings for the first three principal components of soil variables measured. Varimax rotated component loadings of soil data set. EC, electrical conductivity; C, organic carbon; N, nitrogen; P, phosphorous; K, potassium; Mg, magnesium; Na, sodium.

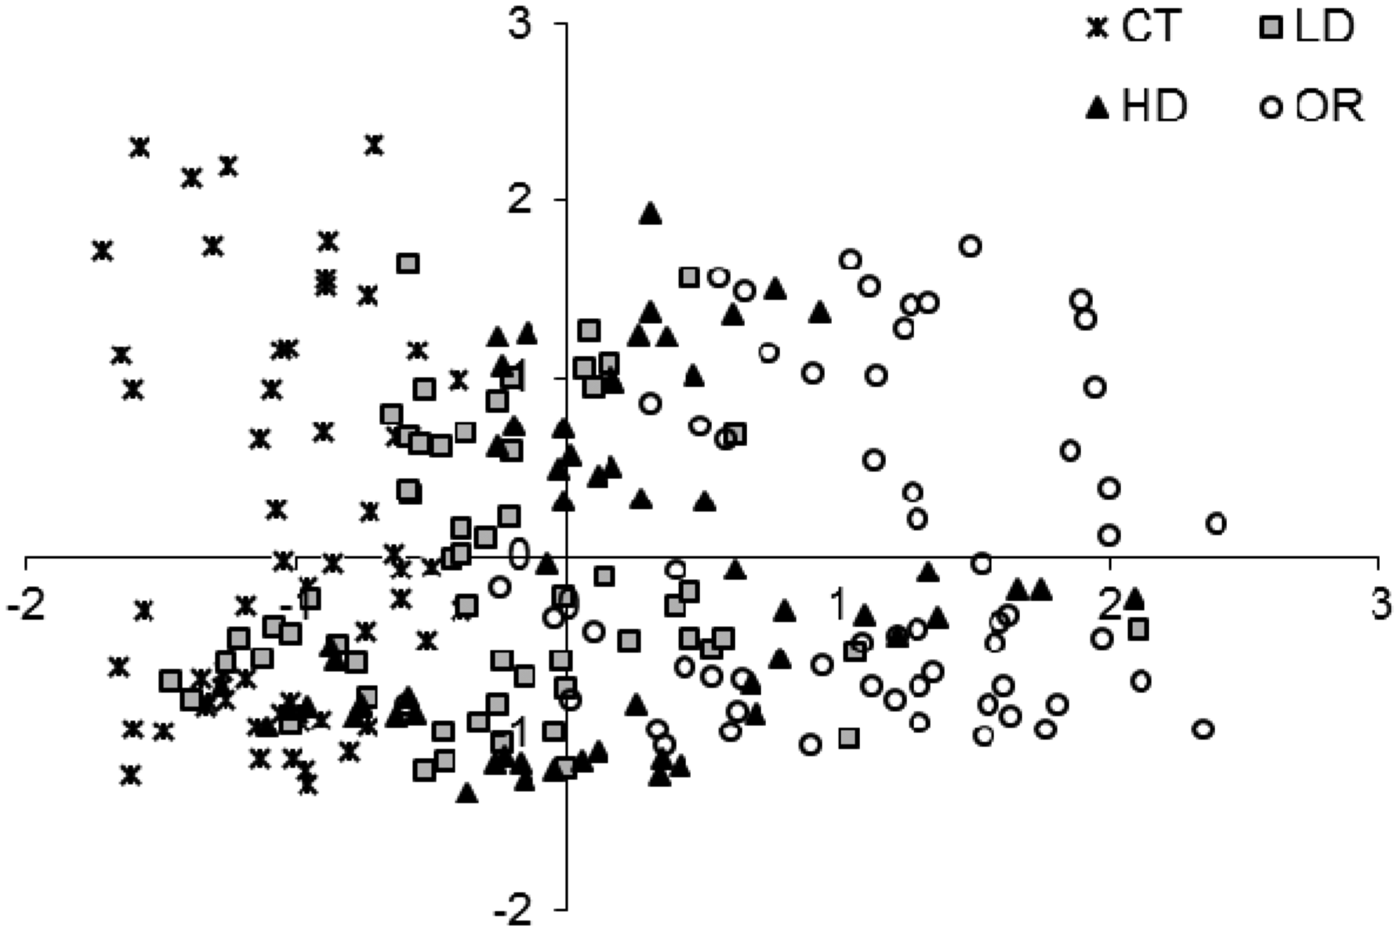
The scatter for the soil data of every plot projected on the plane of the first two components is shown in Fig. 5. Different clusters were observed for treatments between CT and OR; an intermediate cluster indicated the OT at both LD and HD.
Scatter plot of soil parameter data, projected on the plane of the first two principal components (PC1 and PC2). CT, conventional treatment; LD, organic treatment at low doses; HD, organic treatment at high doses; OR, long-term organic treatment fertilized only with crops residues.

Principal component analysis of leaf nutrients
The eigenvalues and proportion of explained variability in leaf data, and the factor-loadings for the first three principal components of variables measured are shown in Table 5 and Fig. 6. The results showed that P, K and nitrate accounted for most of the first component (0·57 of variance). Nitrogen had the largest coefficient of the second component (0·19 of variance), while the largest coefficient of the third component (0·17 of variance) was for Mg.
Factor-loadings for the first three principal components of leaf variables measured. Varimax rotated component loadings of leaf data set. N, nitrogen; P, phosphorous; K, potassium; Mg, magnesium; Nitrat, nitrate.

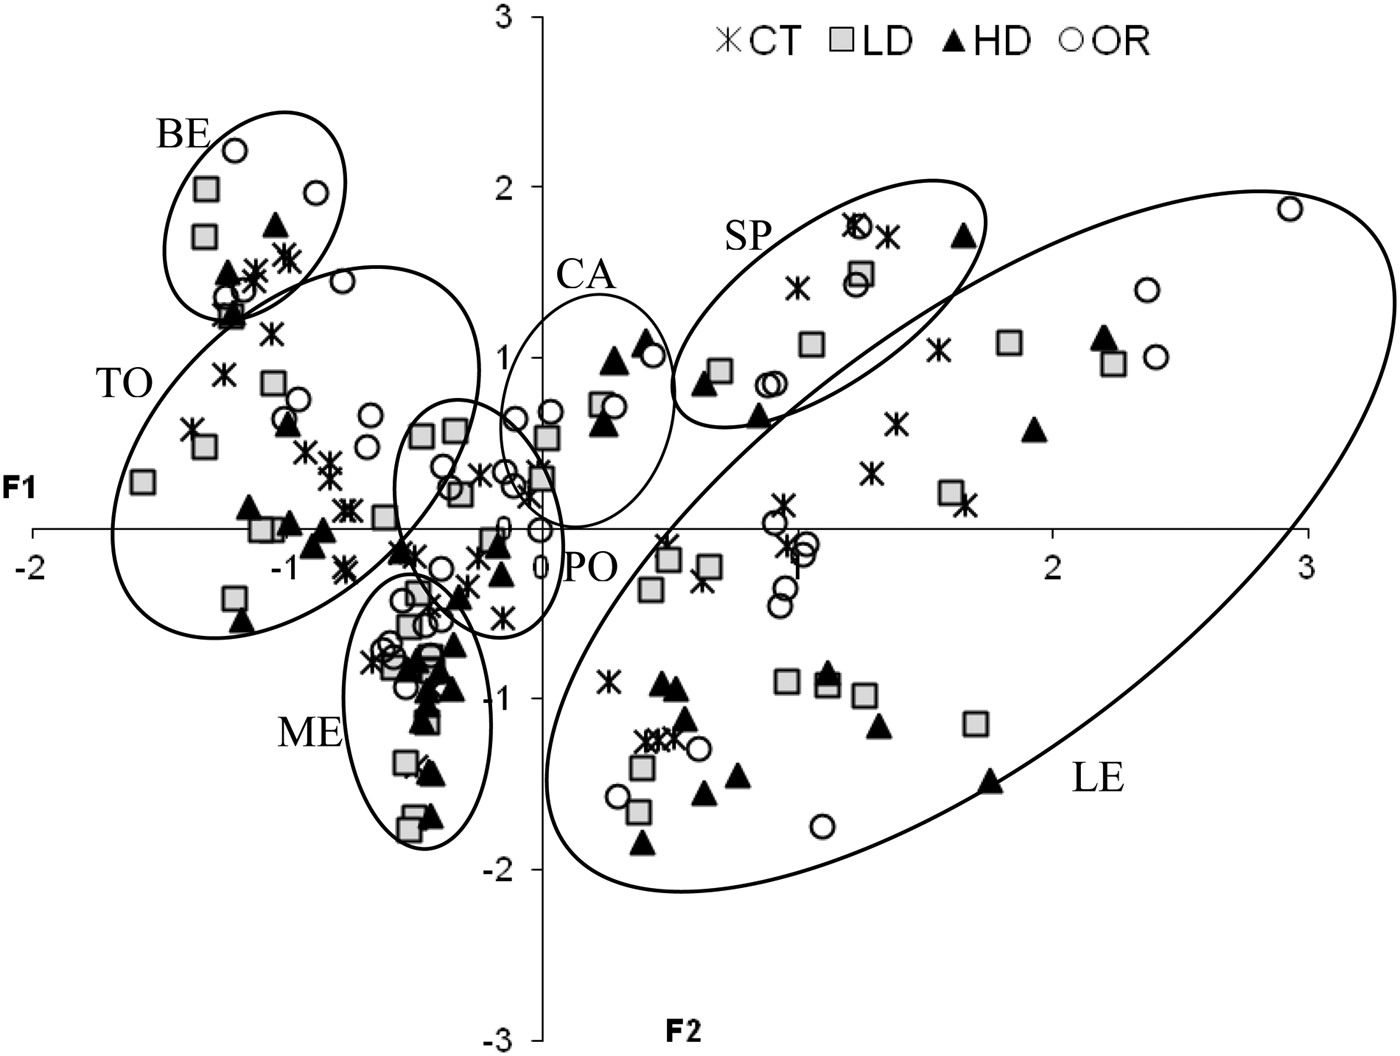
The scatter plot for the leaf data of every plot projected on the plane of the first two components (Fig. 7) showed different clusters for different crops but not with respect to treatment.
Scatter plot of leaf parameter data, projected on the plane of the first two principal components (PC1 and PC2). CT, conventional treatment; LD, organic treatment at low doses; HD, organic treatment at high doses; OR, long-term organic treatment fertilized only with crops residues. LE, lettuce; TO, tomato; CA, cauliflower; ME, melon; PO, potato; SP, spinach; BE, broad bean.

Principal component analysis of plant nutrients in the edible portion of crops
The eigenvalues and proportion of explained variability of data for crops are given in Table 5. The first two principal components were selected; they generated eigenvalues >1·0 and explained 0·88 of the crop data variability. The factor-loadings for the first two principal components of variables measured are listed in Fig. 8. The first factor (0·62 of variance) comprises crop parameters with high loadings. The results showed that N, Mg and P (to a lesser extent) account for most of the first component. Dry matter (DM) showed the largest coefficients of the second component (0·26 of variance).
Factor-loadings for the first two principal components of crop variables measured. Varimax rotated component loadings of crop data set. N, nitrogen; P, phosphorous; K, potassium; Mg, magnesium; DM, dry matter.

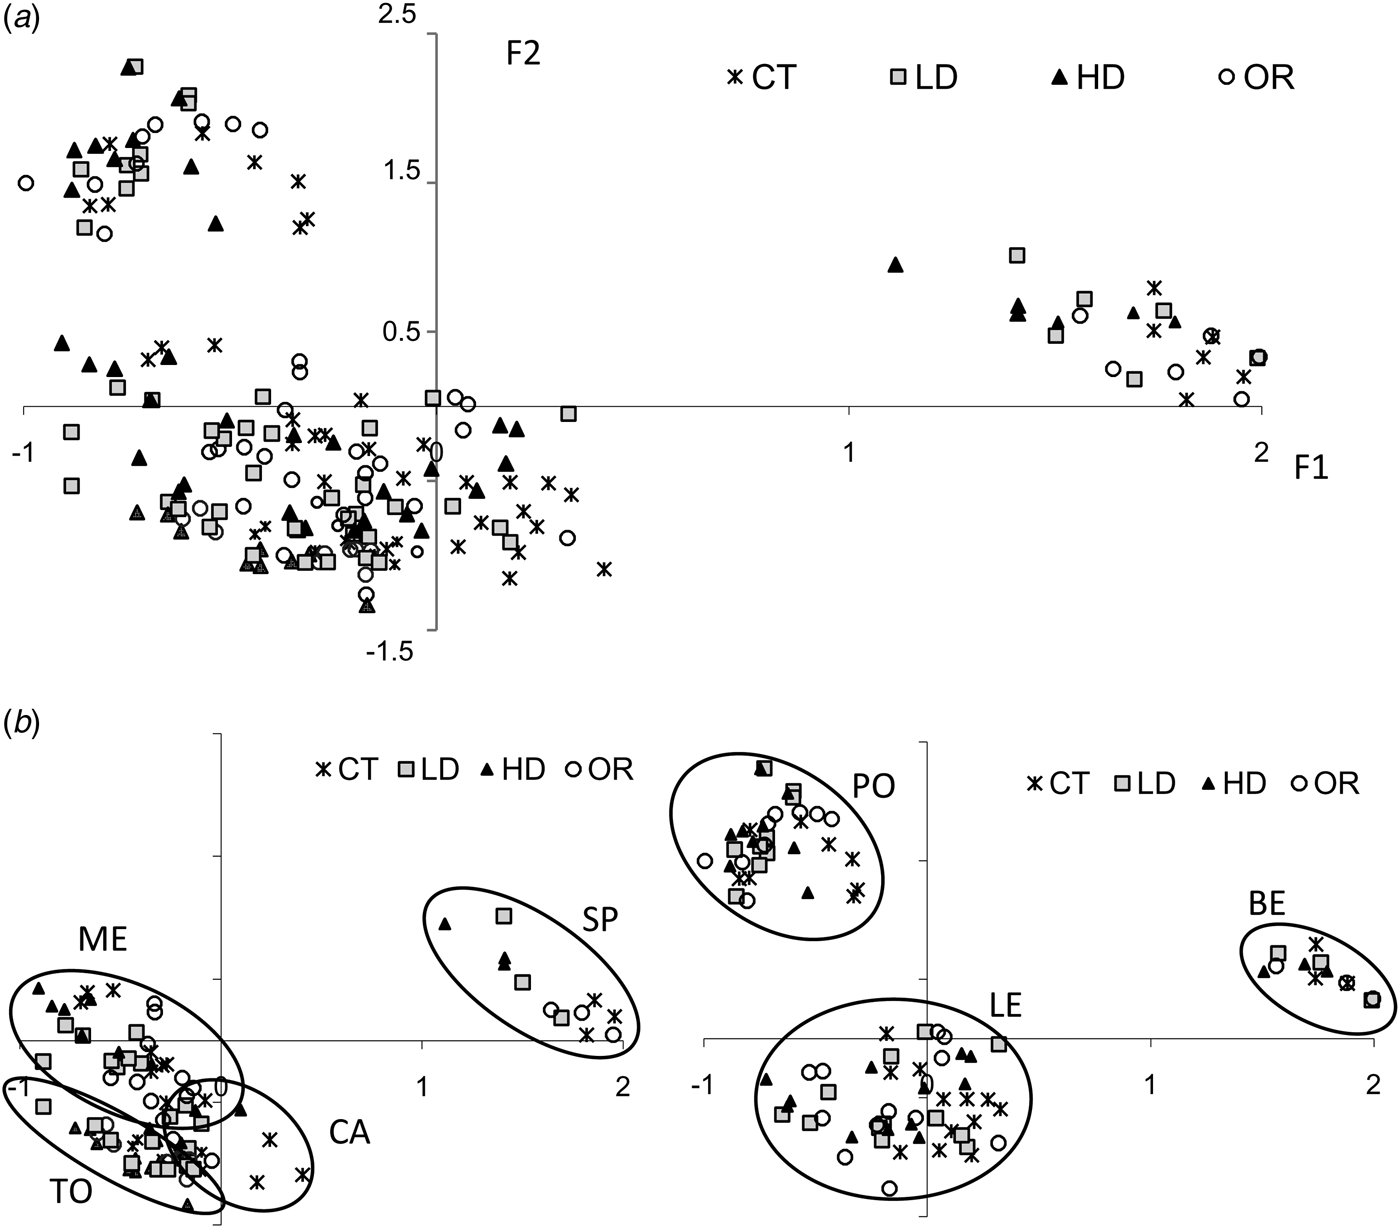
The scatter plot for the crop data of every plot projected on the plane of the first two components is shown in Fig. 9. Different clusters were observed for different crops but not with respect to treatments, as seen for the nutrient contents in leaves.
(a) Scatter plot of crop parameter total data, projected on the plane of the first two principal components (F1 and F2). CT, conventional treatment; LD, organic treatment at low doses; HD, organic treatment at high doses; OR, long-term organic treatment fertilized only with crops residues. (b) Data for each crop. ME, melon; TO, tomato; SP, spinach; CA, cauliflower; (c) PO, potato; LE, lettuce; BE, broad bean.

Crop yield
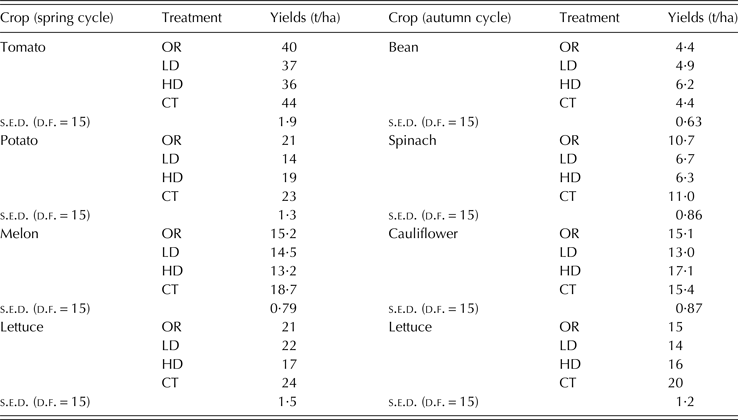
The data corresponding to the crop yields obtained for the mineral and the different organic plots are given in Table 6. In general, while there was a trend towards higher yields for conventional crops, differences were not significant in some cases. The yields were higher in CT than in the HD treatment (P < 0·05) for tomato, melon and lettuce (spring cycle). In the case of potato and lettuce (autumn cycle), yields in the CT were higher than in the LD treatment (P < 0·05). Spinach showed lower yields (P < 0·05) for LD and HD treatments. In contrast, bean yield was higher (P < 0·05) for the HD treatment.
Yields of different crops for the four treatments across the study
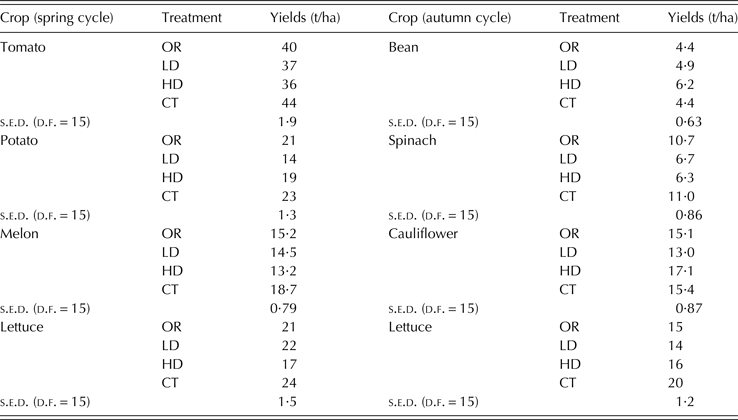
OR, organic plots with 10 years of organic management, fertilized with residues of previous crops; LD, organic treatment with manure compost at low doses in plots after 4 years of organic treatment; HD, organic treatment with manure compost at high doses in plots after 4 years of organic treatment; CT, conventional treatment with synthetic fertilizer in conventional plots.
DISCUSSION
Effect of fertilization on soil parameter
The results obtained for EC indicated that there were no significant differences between treatments. The differences occurred between cultivation cycles regardless of the type of fertilization. The largest increase was detected in autumn, both in organic and mineral plots, probably due to the fact that most of the mineralization and lower lixiviation occur in the summer, therefore resulting in increased salinity. However, other authors (Andrews et al. Reference Andrews, Mitchell, Mancinelli, Karlen, Hartz, Horwath, Pettygrove, Scow and Munk2002) found no statistical differences between OT and mineral treatments.
The values for pH between treatments did not generally show any significant differences, with lower values in some cases being reported for the organic plots, mainly in the OR treatment. The differences occurred between cultivation cycles and, in contrast to EC, the lower values were shown in autumn, after a period of high temperatures (high mineralization) with the higher values in spring, after a period of low temperatures (lower mineralization).
Long-term changes in soil pH occurred largely as a result of displacing cations or adding sources of acidity such as H+ to the exchange complex of the soils (Tisdale et al. Reference Tisdale, Nelson, Beaton and Havlin1993). Clark et al. (Reference Clark, Horwath, Shennan and Scow1998) showed that the soil pH increased from 6·9 to 7·4 after 4 years of organic nutrition and indicated that the reduction in ammonium fertilizer was one of the reasons for the increase in pH. Bulluck et al. (Reference Bulluck, Brosius, Evanylo and Ristaino2002) showed an increase in pH in soils managed organically due to the complexation of Al and to basic cation increases in the soil solution. All of the above studies were carried out in acidic soils; however, the soil used in the current study was calcareous and in these soils the pH is correlated with the partial pressure of CO2 (Brucker & Rouiller Reference Brucker, Rouiller, Bonneau and Souchier1987). In alkaline medium, the CO2 produces bicarbonate by consuming hydroxyl ion (OH−) and therefore avoiding pH increases. Plant roots and microorganisms yield CO2 when breathing, which could be one reason for a lower pH due to the higher microbiological activity in the organic plots undergoing OR treatment (Melero et al. Reference Melero, Ruiz Porras, Herencia and Madejon2006), and in periods of higher activity (higher temperature and mineralization).
Soil C content was found to be considerably greater in organically fertilized soils in comparison with soil receiving mineral fertilizer, and the highest content was observed in the OR. The addition of organic amendment in continuous cycles increased the C content in the soil. Logically, the HD of compost produced the highest increase in carbon but the low-dose treatment also had good results, indicating that under the current conditions, the application of LD of compost would be sufficient to maintain and/or increase OM levels. In addition, it is remarkable that when the system has been under ecological management (OR) for several years, it could be sufficient to apply crop residues and possibly periodic contributions of LD of organic amendments.
Some authors have also reported that OM increased after 4 years of alternate compost and cover crop applications (Scow et al. Reference Scow, Somasco, Gunapala, Lau, Venette, Ferris, Miller and Shennan1994). Andrews et al. (Reference Andrews, Mitchell, Mancinelli, Karlen, Hartz, Horwath, Pettygrove, Scow and Munk2002) also reported an increase in C of 16% in comparison with mineral fertilization after 3 years of different fertilization methods. According to Peigné et al. (Reference Peigné, Ball, Roger-Estrade and David2007), the combined action of conservation tillage and the input of fresh OM increased soil organic C. The higher soil OM content and microbial biomass in organic plots (Melero et al. Reference Melero, Ruiz Porras, Herencia and Madejon2006) may have provided important fertility benefits. It is crucial to emphasize that the type and amount of organic amendment used is suitable to maintain an adequate level of C in this soil.
In all cases, significant increases in N contents were observed in the plots that were organically amended in comparison with the mineral ones, which is in agreement with the C results. However, unlike the results obtained for C, it was observed that OR treatment stabilized, indicating that although the system takes several years under ecological management, it could be sufficient to apply crop residues and possibly periodic contributions of LD of organic amendments in order to maintain adequate values of N. A significant increase in N content was observed in the plots that were organically amended with manure (LD and HD). In the first crop cycles, the N level of the mineral fertilized plots (CT) was constant, but was slightly higher than the original values at the end of the experiment. Also, it is important to note that the LD is sufficient to increase the N content of the soil and it is not necessary to use a double quantity of manure, which has a consequent economic saving.
It must be taken into account that the N applied with the organic amendment is not immediately available to the plant because it must first be mineralized. The mineralization rate is variable and depends on several factors such as soil properties, type of compost and environmental conditions (Sims Reference Sims and Bacon1995). In addition, part of the decomposed N is immobilized in OM (Van Delden et al. Reference Van Delden, Schröder, Kropff, Grashoff and Booij2003).
As for C, the highest values of N with the addition of OM amendment and organic residues are widely documented (Edmeades Reference Edmeades2003; Knudsen et al. Reference Knudsen, Kristensen, Berntsen, Petersen and Kristensen2006; Herencia et al. Reference Herencia, Ruiz, Melero, Garcia Galavis and Maqueda2008; Gomiero et al. Reference Gomiero, Pimentel and Paoletti2011).
Available P also showed similar behaviour to C and N. At the end of the current study, the available P content in the organically managed plots was significantly higher than in the mineral ones. However, levels of P in organic plots showed large fluctuations in comparison with the inorganic plots, possibly due to a greater variability in the compost composition compared with mineral fertilizers. Unlike the C and N results, it was observed that the treatment with the HD showed clear increases well above the LD. In addition, there were no statistically significant differences between LD and CT treatments until the fourth crop cycle. The soil P content at the beginning of the experiment showed higher values for OTs, fundamentally in the OR treatment. However, the lower addition of P by the crop residues in the OR treatment did not produce an increase in P values across the study. The supply of P in LD and HD treatments were 37·9 and 75·8 kg/ha, respectively and around 45 kg/ha in CT treatment.
This appears to show that, with respect to P, the continuous application of OM is important to increase the level of availability of this nutrient, possibly because of the soil characteristics. This soil is calcareous and is characterized by the higher P retention by carbonates by the formation of the insoluble form, Ca3 (PO4)2, with the Ca from CaCO3 (Tan Reference Tan and Tan1998). If P is not provided regularly, it may be retained and unavailable to plants. Moreover, the highest value of P with the addition of OM is widely known and documented (Andrews et al. Reference Andrews, Mitchell, Mancinelli, Karlen, Hartz, Horwath, Pettygrove, Scow and Munk2002). In calcareous soils, several mechanisms have indicated that it is more advantageous to apply these organic amendments rather than mineral fertilizer to improve the availability of P to plants because the decomposition of organic amendments increases the organic acids. These acids chelate the cations bound to phosphate, thereby converting it into soluble forms that reduce P fixation and increase P availability (Tan Reference Tan and Tan1998; Herencia et al. Reference Herencia, Ruiz, Melero, Garcia Galavis and Maqueda2008). Richardson & Simpson (Reference Richardson and Simpson2011) also indicate that microorganisms play an important role enhancing the capacity of plants to acquire P by several mechanisms that may either directly or indirectly increase P availability. In addition, the increase in microbial biomass when OM is added to the soil increases CO2 by microbial respiration, which forms H2CO3 in the soil solution, resulting in the dissolution of primary P containing minerals (Uroz et al. Reference Uroz, Calvaruso, Turpault and Frey-Klett2009).
This effect is shown clearly when HD of organic amendments are added, or where organic amendments have been used for a long time (OR), but for LD the effects are not seen immediately. It takes some time for differences according to treatment to become apparent and this will depend fundamentally on the inherent fertility of the soil and the type and amount of amendment applied. In the case of the LD treatment, four cycles were necessary to increase the P availability in comparison with CT treatment.
Some authors have also found an increase in available K after organic amendment (Bulluck et al. Reference Bulluck, Brosius, Evanylo and Ristaino2002; Edmeades Reference Edmeades2003). This was attributed to the high K content of the compost and the increase in exchange sites due to the OM added, which does not fix K strongly (Andrews et al. Reference Andrews, Mitchell, Mancinelli, Karlen, Hartz, Horwath, Pettygrove, Scow and Munk2002). Nevertheless, in the current study, the values of available K in the plots managed organically were slightly higher than those of the mineral plots, but there were no significant differences between treatments in general and the differences occurred among cultivation cycles regardless of the type of fertilization. This is probably due to a combination of interrelated factors. On the one hand, the K in composts, unlike other elements such as C, N and P, is not associated with any organic structure and is mobile in organic waste, or slightly bonded in the exchange complex; therefore, it is easy to leach. This could explain why there are differences regarding the dates. The highest values were shown in the autumn, i.e. after a period of low rainfall (low lixiviation) and high temperatures (high mineralization) and the lowest values were in the spring, after the rainy season (higher lixiviation) and low temperatures (lower mineralization).
Moreover, the soil characteristics must be taken into account. The illite-type clay minerals, which are dominant in the soil of the current study area (data not shown), fix K strongly and may be another reason for the lower differences in K availability observed between treatments.
As with available K, in the current study the results of Mg showed differences between cultivation cycles, but the values of available Mg in the plots managed organically were higher than those of the mineral plots, with the differences being statistically significant most of the time. Unlike K, Mg is associated with organic plant residues (i.e. chlorophyll), so it is not easy to leach from the compost. Furthermore, the exchange complex is more stable with Mg and is not as strongly bound as K in clays. This causes the values to be higher in organically fertilized soils. In addition, conventional K fertilizers cause soil magnesium to be less available to plants. Mineral fertilizers usually contain more K than Mg, so K could replace Mg in the exchange positions and cause Mg-loss by leaching, which could explain the lower values of Mg in the conventionally managed soil.
Magnesium nutrition of plants is frequently overlooked. Some authors have also found an increase in available Mg after organic amendment (Schjonning et al. Reference Schjonning, Christensen and Carstensen1994; Gliessman et al. Reference Gliessman, Werner, Swezey, Caswell, Cochran and Rosado-May1996), but other studies found no differences (Qian et al. Reference Qian, Schoenau, King and Japp2005). The contrasting results obtained in other studies indicate that available Mg values also depend on the dose and type of compost. Qian et al. (Reference Qian, Schoenau, King and Japp2005) have found that extractable Mg in the soils remained unchanged or tended to decrease after the repeated application of swine manure, but showed slightly higher mean soil Mg contents with the application of cattle manure; therefore, they concluded that this is consistent with the larger amounts of Mg contained in this manure source. The compost used in the current study showed a higher Mg content than the compost used by Qian et al. (Reference Qian, Schoenau, King and Japp2005).
As with Mg, availability of Na is frequently overlooked. The current results showed that there were no differences with respect to the type of fertilization. As for EC, the increase in available Na in the autumn is believed to be due to the higher mineralization and lower lixiviation in the summer period.
Effect of fertilization on leaf nutrient content
According to the literature, leaf nutrient contents might be good predictors of plant responses to nutrients supplied via fertilizers. The N, K and Mg content in the leaves studied in the current work showed that, in general, there were few differences between treatments. Fundamentally, the differences depended on crop type. Therefore, the results indicated that with conventional fertilization, as with organic fertilization, there was a similar and balanced supply of nutrients in both cases. Stockdale et al. (Reference Stockdale, Lampkin, Hovi, Keatinge, Lennartsson, Macdonald, Padel, Tattersall, Wolfe and Watson2001) concluded that although nutrient management in organically managed soils was fundamentally different to soils managed conventionally, the underlying processes supporting soil fertility were not. This suggests that, although soil fertility is theoretically better in organic management, if there is a balanced supply of nutrients, i.e. there are no deficiencies or excesses of a nutrient that cause excessive consumption, the plant will take the nutrients in proportion to their needs.
Nevertheless, a clear trend for higher leaf P content in organic crops was observed, according to the higher concentration of available P in the plots managed organically than in the inorganic ones. It is known that with the addition of organic nutrients, the supply and availability of P is high in calcareous soil (Herencia et al. Reference Herencia, Ruiz, Melero, Garcia Galavis and Maqueda2008). Compost application rates are routinely based on crop N requirements, which results in more P than is needed by the crop and could cause a build-up of P in the soil (Eghball & Power Reference Eghball and Power1999; Edmeades Reference Edmeades2003) and consequently in plants. Sommers et al. (Reference Sommers, Nelson and Yost1976) have reported that the P/N relationships for adequate crop development are usually 1/10; however, in the compost used in the current study, the P/N relationship was about 1/4. This amount would be in excess of the crop's needs. However, according to the literature (Jones et al. Reference Jones, Wolf, Mills, Jones, Wolf and Mills1991), the data for leaf P content of organic crops in the current study are within normal parameters, indicating that there were no problems of imbalance or antagonism with other nutrients, such as micronutrients.
The influence of the type of crop on nitrate concentration was more remarkable than the type of management. However, the data showed high variability, making it difficult to draw any conclusions.
Effect of fertilization on crop nutrient content
Similarly to leaves, the nutrient content in the edible portion of crops did not show any great differences between treatments. Only P content showed a clear trend toward higher values in OTs in all crops. It is remarkable that the CT and OR treatment showed a trend towards higher N content, probably due to the fact that, in fertility terms, both systems could be more equilibrated than HD and LD treatments.
With respect to the other nutrients evaluated, if CT and OR were compared only when there were statistical differences, the values were always higher for organic crops (i.e. P in bean and cauliflower, K in melon, and Mg in melon, cauliflower and potato). This could be explained by a combination of several factors. On one hand, some conventional crops showed higher yields compared with the organic fertilized plots (potato, tomato, lettuce and melon, Table 6) and the lower nutrient concentrations in conventional crops could be due to a dilution effect as a result of increased crop yield. On the other hand, the available nutrient contents in the organically fertilized plots were, in general, significantly higher compared with the mineral ones (Fig. 1), with the potential for greater nutrient uptake. In addition, crop yields in bean, spinach and cauliflower were similar for CT and OR treatments and in this case the dilution effect could not be the reason for this behaviour. Nevertheless, these results seem to show that the organic crops were well nourished, at least compared with conventional crops.
Correlations between soil parameters and leaf/edible plant part nutrient content
There were also high correlations between soil parameters. In addition, there was a positive correlation between leaf nutrients and between nutrients in the edible portion of crops (see Table 4). However, there was no correlation between soil and plant parameters, either for leaves or the edible portion of crops.
It is interesting to observe that the positive correlation between EC and nutrients in soil and plants indicated that the mineralization in organic management or the application of fertilizer increased the nutrients in solution and their availability for crops.
These results reaffirm the previous comment that there was an adequate and balanced supply of nutrients with conventional fertilization, as with organic fertilization. A rich and equilibrated soil can supply the necessary nutrients to crops regardless of the fertilization systems used. Nevertheless, the lack of correlation between soil and plant nutrients would indicate that each crop takes only the nutrients that they need.
The results of PCA analysis of soil indicated that the first component comprised the characteristic soil parameters that represent different soil management methods (C, N and P), the second component comprised the characteristic soil parameters that represent the influence of climatic conditions that affect the nutrients availability (EC, pH, K and Na) and the third component represented soil parameters that could be of intermediate influence of management and climatic condition in the nutrient value content (Mg). In addition, Fig. 5 clearly indicates the differentiation of groups of objects. The type of fertilization was the key factor clearly defining two different clusters for treatment, fundamentally between conventional (CT) and long-term organic management (OR). The intermediate cluster, which included the OT at LD and HD, indicated that both systems are still in a period of reconversion to the organic system. In Fig. 5, PC1 separates the samples with 10 years of organic amendment from soils managed with inorganic fertilization. Organic samples are on the right side and the others are on the left (positive X-axis values).
For leaves, no clear conclusion can be obtained with respect to the type of management because only the first component showed an eigenvalue >1 and explained only 0·57 of the data variability. For the edible portion of crops, the second components that showed the second higher variance include DM, where the differences were more due to the physiological characteristic of each crop than to the type of fertilization. The scatter plots of the plant data showed that the nutrient concentrations in the edible part of crops and leaves were not directly related to the different fertilization systems, which is characteristic of each crop. Therefore, the nutrient concentrations in crops depended on their respective physiological characteristics rather than the type of fertilization method used.
Yield
Application of compost had a positive effect on soil fertility; however this fact did not correlate with crop yield. There were higher yields for some conventional crops (potato, tomato, lettuce and melon) than for HD or LD OTs; nevertheless other crops (bean, spinach and cauliflower) showed similar yields for CT and OR treatments. Bean also showed higher yields for the HD treatment. Given these results, it seemed that the effect of treatment on production depended to some extent on good management practices and crop type.
Recently, Seufert et al. (Reference Seufert, Ramankutty and Foley2012) indicated in a comprehensive meta-analysis of the relative yield performance for organic and conventional farming systems that, overall, organic yields were lower than conventional yields. However, with good management practices, particular crop types and growing conditions, organic systems can nearly match conventional yields. This is in agreement with the organic plots in the current paper, because few statistically significant differences in yields were observed between plots organically amended and plots fertilized with synthetic fertilizer. Other authors have also indicated that yields of crops grown either with organic or mineral fertilization can be equivalent (Reider et al. Reference Reider, Herdman, Drinkwater and Janke2000; Warman Reference Warman2005). Drinkwater et al. (Reference Drinkwater, Letourneau, Workneh, Van Bruggen and Shennan1995) suggested that other components such as cultivar and management skill were more significant in determining yields than the specific type of input or cultural practice employed. Palmer et al. (Reference Palmer, Cooper, Tetard-Jones, Srednicka-Tober, Baranski, Eyre, Shotton, Volakakis, Cakmak, Ozturk, Leifert, Wilcockson and Bilsborrow2013) indicated that the lower N supply from organic fertilizers rather than inefficient pest and disease control may be the major limiting factor for yields in organic potato production systems. In agreement to the statement made by Palmer et al. (Reference Palmer, Cooper, Tetard-Jones, Srednicka-Tober, Baranski, Eyre, Shotton, Volakakis, Cakmak, Ozturk, Leifert, Wilcockson and Bilsborrow2013), the similar N concentrations in OR and CT fertilized tubers found in the current work could be the main reason for the similar yields.
Greater yield in long-term organic treated plots in comparison with the short-term treatment is in agreement with Pimentel et al. (Reference Pimentel, Hepperly, Hanson, Douds and Seidel2005), who indicated that organic systems may create N shortages over the short-term, which temporarily reduce crop yields. It is necessary to note that the N applied in organic amendments is not immediately available to the plant because it must first be mineralized. In a 3-year study, Gliessman et al. (Reference Gliessman, Werner, Swezey, Caswell, Cochran and Rosado-May1996) indicated that strawberry production was initially lower in organic systems, but this difference decreased progressively in such a way that, considering the superior prices of the organic fruit, the final result was economically favourable for the organic systems. Taylor et al. (Reference Taylor, Younie, Matheson, Coutts, Mayer, Watson and Walker2006) reported that organic farming with an appropriate crop rotation system can be sustainable.
Based on the results of the present study it can be concluded that some time is necessary for organic systems to increase crop yields to match conventional yields.
In organic management, it is important to control the type, amount and form of incorporation of the OM in the soil, and it is more important to maintain an adequate content of OM in the soil than the theoretical application of a pool of nutrients, because a rich and equilibrated soil can supply all of the nutrients necessary for crops. When nutrients are available to the plant in an appropriate and balanced way, the plant will take the nutrients it needs, regardless of the type of fertilizer used.
In other words, organic production systems can provide balanced nutrition for the development of crops and this, coupled with a system that is environmentally friendly and with a higher price for organic products, results in a system that is both agronomically and financially sustainable.
In the current paper, the PCA analysis allows conclusions to be drawn about the application of organic compost to soil. The PCA showed a strong association between the type of crops and their nutrient contents.
The authors thank the Junta de Andalucía through projects PAI RNM 166 and exp. 92162/1 for financial support.