I. INTRODUCTION
Tissue engineering is a multidisciplinary subject which combines manipulation of cellular pathways and mechanisms with chemical and mechanical engineering to create artificial tissues and organs such as skin, blood vessels, bone, liver, and nerve conduits.Reference Wang, Lin, Yao and Chen1–Reference Rosado and Brewster5 Tissue scaffolds that provide three dimensional (3D), highly porous extracellular matrix (ECM) microenvironments for cells play a pivotal role in tissue engineering.Reference Zhang, Venugopal, Huang, Lim and Ramakrishna6 A highly porous and interconnected 3D structure with suitable surface properties is necessary to attain a proper integration between cells and scaffold for synthesizing new tissues.Reference Yang, Leong, Du and Chua7 However, it is difficult to produce such high porosity scaffolds with specific shapes and suitable mechanical properties. Additionally, the porosity and mechanical properties, which are both important traits of tissue engineering scaffolds, are closely interrelated.Reference Gupta, Patra and Ray8 Researchers have used scaffolds with porosities ranging from 55 to 74% for bone regeneration due to their advantageous mechanical properties.Reference Sherwood, Riley, Palazzolo, Brown, Monkhouse, Coates, Griffith, Landeen and Ratcliffe9,Reference Shao, Hutmacher, Ho, Goh and Lee10 The optimal pore size for tissue regeneration depends on the type of tissue.Reference Yang, Leong, Du and Chua7 For example, pore sizes ranging from 50 to 70 µm is suitable for cardiac cells, whereas human osteoblast cells typically require pore sizes of around 200 µm to achieve good performance.Reference Odedra, Chiu, Reis, Rask, Chiang, Radisic, Burdick and Mauck11,Reference Liu and Ma12
Biocompatibility and surface chemistry are crucial properties for tissue engineering scaffolds because they strongly influence a variety of cellular behaviors including survivability, adhesion, and migration. The introduction of hydrophilic functional groups, or compounding a substrate with hydrophilic materials, leads to increased hydrophilicity, resulting in a higher cell adhesion rate and proliferation.Reference Ghasemi-Mobarakeh, Prabhakaran, Morshed, Nasr-Esfahani and Ramakrishna13 Rough scaffold surfaces also contribute to cell adhesion, and different methods have been developed to improve the surface roughness such as the addition and copolymerization of ceramic particles,Reference Shor, Yildirim, Guceri and Sun14,Reference Yeo, Wong and Teoh15 scaffold surface modification or crystallization,Reference Ajami-Henriquez, Rodriguez, Sabino, Castillo, Muller, Boschetti-de-Fierro, Abetz, Abetz and Dubois16 and leaching of small particles.Reference Navarro, Aparicio, Charles-Harris, Ginebra, Engel and Planell17
Biodegradable polyurethane (PU) elastomers have been used in a variety of applications to aid the repair and reconstruction of soft tissues including blood vessels,Reference Nieponice, Soletti, Guan, Hong, Gharaibeh, Maul, Huard, Wagner and Vorp18 urinary bladders,Reference Danielsson, Ruault, Simonet, Neuenschwander and Frey19 catheters,Reference Hentschel and Munstedt20 and skin.Reference Li, Davidson and Guelcher3 Thermoplastic polyurethane (TPU), as a class of PU, has been widely used in medical applications, mainly because of its biocompatibility, high fracture strain, moderate tensile strength, and excellent abrasion and tear resistances.Reference Maurus and Kaeding21 By changing the hard and soft segment ratio, TPU can be synthesized into resins with a large range of properties, which makes it suitable for many types of tissue applications.Reference Lamba, Woodhouse and Cooper22 Several methods have been used to fabricate TPU tissue scaffolds such as electrospinning,Reference Huang, Chen, Ke, Morsi, Zhang and Mo23,Reference Dempsey, Schwartz, Ward, Iyer, Parakka and Cosgriff-Hernandez24 thermally induced phase separation,Reference Martinez-Perez, Garcia-Casillas, Romero, Martinez-Villafane, Moller and Romero-Garcia25 solvent casting/particle leaching,Reference Sin, Miao, Liu, Wei, Chadwick, Yan and Friis26 rapid prototyping,Reference He and Wang27 batch foaming,Reference Ito, Matsunaga, Tajima and Yoshida28 and microcellular injection molding.Reference Leicher, Will, Haugen and Wintermantel29 The last two methods are attracting increasing attention from researchers because they do not require an organic solvent. Generally, in these methods, the super critical fluid is first dissolved into the polymer for batch foaming, or mixed with the melted polymer at high temperature and pressure for microcellular injection molding. Next, bubbles are generated from a sudden release of pressure.Reference Gerhardt, Manke and Gulari30 Although these methods avoid the use of an organic solvent, the pores obtained are mostly closed and the porosity is not very high, which is not ideal for cell culture. Compared to batch foaming, microcellular injection molding has much higher productivity and it is easier to shape the scaffold by changing the mold cavity design. However, it is a relatively new method applied to tissue engineering, and the know-how to improve scaffold properties has yet to be fully developed. While salt has been used as a physical porogen to improve the porosity of the scaffold, an alternative water soluble polymer porogen such as polyvinyl pyrrolidone or polyvinyl alcohol (PVOH) has also been used.Reference Leicher, Will, Haugen and Wintermantel29 PVOH is a water soluble, nontoxic, biodegradable polymer whose melting point is 180–190 °C. It can be melt blended with most polymers to modify the blend's properties such as the mechanical properties and hydrophilicity. When applied to scaffold fabrication, PVOH is leached from the blend to further increase the porosity of the scaffold.
The combination of multiple processing methods is becoming popular in tissue engineering scaffold fabrication, which can sometimes result in products with either diverse properties or properties better than those of individual method.Reference Wu, Jing and Ding31,Reference Liu, Hsueh, Ueng, Lin and Chen32 A novel scaffold fabrication method combining microcellular injection molding and a leaching process has been developed, in which polylactic acid was used as the polymer matrix, NaCl was used as the porogen, and PVOH was used to improve pore interconnectivity and hydrophilicity.Reference Kramschuster and Turng33 In this study, this novel method was applied to produce a TPU polymer matrix in a mass-producing fashion and the effects of PVOH and NaCl were studied specifically. Miscibility, scaffold morphology, and fibroblast cell viability were investigated as well.
II. EXPERIMENTAL
A. Materials and methods
TPU (Elastollan 1185A, BASF Ltd.) was used as the matrix material for tissue culture. Microcellular injection molding and particle leaching techniques were used to generate an interconnected porous structure. PVOH (Celvol 325, Celanese Chemicals Ltd.) with a melt temperature of 190 °C [as determined via differential scanning calorimetry (DSC)] was used to connect the pores in the TPU matrix and create a co-continuous network as well as to improve its hydrophilicity. Sodium chloride (NaCl), which was used as porogen to further increase the porosity and maintain pore size distribution, was purchased from Sigma-Aldrich. The salt particles were sieved with screens to 150–300 µm. The schematic shown in Fig. 1 illustrates the novel and scalable tissue scaffold fabrication method. The polymer matrix [Fig. 1(a)] was first melt blended with PVOH and NaCl particles using a twin-screw extruder to form a uniform composite [Fig. 1(b)]. A microcellular injection molding machine was utilized to allow the composite to foam with supercritical carbon dioxide (scCO2) [Fig. 1(c)]. The foamed composite was submerged into a hot water bath [Fig. 1(d)] to leach out the PVOH and NaCl particles [Fig. 1(e)]. Figure 1(f) shows the expected final high porosity, interconnected scaffold structure.
Schematic illustration of this novel tissue scaffold fabrication method. (a) TPU matrix, (b) TPU mixed with PVOH and NaCl, (c) microcellular injection molded TPU/PVOH/NaCl components with bubbles, (d) beginning of leaching process, (e) end of leaching process, and (f) final porous and interconnected structure.

B. Scaffold fabrication
1. Compounding
The TPU, PVOH, and NaCl were dried at 100 °C with a circulating air flow for 3 h prior to compounding. Pre-mixed materials were melt blended with a twin-screw extruder (LeistritzZSE 18 HPe, Leistritz Advanced Technologies Corp., Somerville, NJ) at 190 °C (the die temperature) and a screw speed of 120 rpm, followed by air cooling and granulation.
2. Microcellular injection molding
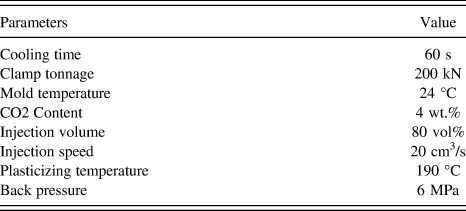
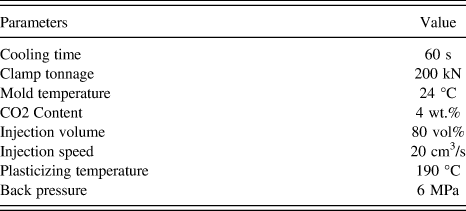
The injection molding machine used was an Arburg Allrounder 320S (Arburg, Loßburg, Germany) with a 25-mm-diameter screw and a mold temperature controlling device. It was equipped with a scCO2 supply system (MuCell® Trexel, Inc., Wilmington, MA) which can precisely control the gas injection rate by adjusting gas flow velocity and valve open time. The composites were dried for 3 h at 100 °C to remove any residual moisture before processing. Both solid and foamed samples were collected. The processing parameters for the microcellular injection molding procedure used are listed in Table I. The mold used has a standard bending test cavity geometry with dimensions of 165.0 × 13.0 × 4.5 mm.
Microcellular injection molding processing parameters.
3. Particle leaching
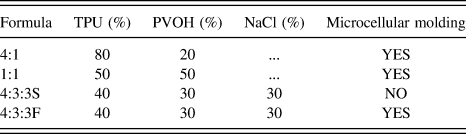
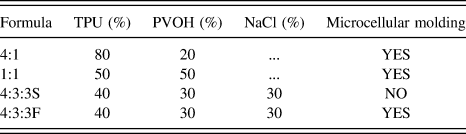
Samples and their formulas are listed in Table II. Samples with TPU:PVOH:NaCl ratios of 4:1 (no NaCl), 1:1 (no NaCl), 4:3:3S, and 4:3:3F (where S is for solid and F is for foamed) were selected to compare the effects of each factor. The leaching step was performed in an 80 °C hot water bath with vigorous stirring for 12 h, and the water was replaced every 3 h. To achieve sufficient water penetration and improve PVOH dissolution, the scaffolds were further sonicated in 60 °C hot water for 2 h using an ultrasonicator (Branson 2510, Fisher Scientific, Pittsburgh, PA).
Experimental formulas in weight percentages.
4. Cell culture
The 4:1, 1:1, and 4:3:3F scaffolds were chosen for cell culture testing. All samples were trimmed to 6 × 6 mm square with a height of around 3 mm using a scalpel and exposed to sterilizing UV for 30 min before seeding. National Institutes of Health (NIH) 3T3 cells (mouse fibroblast) were maintained prior to testing on 6-well tissue-culture-treated polystyrene plates (BD Falcon). Test samples were placed in 24-well tissue-culture-treated polystyrene plates after autoclave sterilization. 3T3 cells were treated with ethylenediaminetetraacetic acid for 5 min and washed with phosphate-buffered saline (PBS) prior to seeding. Cells were then seeded at a density of 1.25 × 10⁵ cells/cm2 in the high-glucose 3T3 medium described above. The medium was replaced daily (1 mL/day/well) for screening samples.
C. Characterizations
1. Differential scanning calorimetry
DSC measurements were performed with a DSC Q20 (TA Instruments, New Castle, DE). Samples were encapsulated in standard aluminum pans and lids. Samples were heated to 230 °C at a heating rate of 10 °C/min and held isothermally for 5 min to remove any prior thermal history. Samples were then cooled to −80 °C and heated again to 230 °C with a 10 °C/min heating rate. The tests were repeated 3 times to make sure that the results were consistent and all tests were carried out under the protection of a nitrogen atmosphere.
2. Scanning electron microscopy
The morphologies of the solid and foamed samples were evaluated using a JEOL Neoscope scanning electron microscopy (SEM) (Nikon Corp., Tokyo, Japan). Cross sections and flow direction sections were examined with an accelerating voltage of 10 kV. Specimens were frozen in liquid nitrogen and broken by two clamps in cross section at the center of the injection molded parts. Specimens were cut in the flow direction with a scalpel because the injection molded samples were too thin to freeze break in flow direction. SEM observations were performed after sputtering the samples with a thin layer of gold for 40 s.
3. Pore diameter, pore density, and porosity
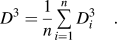
Pore diameters and pore densities of the scaffolds were calculated from the cross sections of 3 different SEM images using the Image-Pro Plus software. Equation (1) was used to convert the surface average diameter to the volume average diameter.
 $${D^3} = {1 \over n}\mathop\sum\limits_{i = 1}^n {D_i^3} \quad .$$
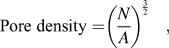
The volume pore density was determined with Eq. (2),Reference Naguib and Park34
 $${\rm{Pore}}\;{\rm{density = }}{\left( {{N \over A}} \right)^{{3 \over 2}}}\quad ,$$
where N is the pore number from the SEM image and A is the area of the SEM image. The samples were trimmed carefully into rectangles for the porosity measurement. The weight and dimensions of the samples were measured and Eq. (3) was used to calculate the porosity. The porosity value is the average of 5 samples.
 $${\rm{Porosity}} = {{{V_{th}}\rho - {W_m}} \over {{V_{th}}\rho }} \times 100\% \quad ,$$
where W m is the measured weight; ρ is the density of TPU, which is 1.12 g/cm3 for the TPU used in this study; and V th is the volume of the foamed sample.
4. Thermogravimetric analysis
Thermogravimetric analysis (TGA) (TA Q50, TA Instruments, New Castle, DE) was used to analyze the residual components after leaching. Approximately 10 mg samples were used for the TGA tests. The tests were initiated at room temperature and the temperature was increased to 600 °C using a heating rate of 10 °C/min. At least 2 specimens of each sample were tested to ensure consistency.
5. Water contact angle
Water contact angle (WCA) tests of leached samples were performed at room temperature in a Dataphysics OCA 15 optical contact angle measuring system (DataPhysics Instruments GmbH, Filderstadt, Germany) using the sessile drop method. Five microliters of deionized water were dropped on the samples and images were taken and measured at 0, 5, and 10 s. The WCA was the average value of three different spots.
6. Cell viability
Cell viability was determined 3 and 10 days after seeding. Viability was assessed via a Live/Dead Viability/Cytotoxicity Kit (Invitrogen). Green fluorescent Calcein-AM stain was used to target the esterase activity within the cytoplasm of the living cells, and red fluorescent ethidium homodimer-1 (EthD-1) was used to indicate cell death by penetrating damaged cellular membranes. Blue fluorescent DAPI stain was also applied as a nuclear marker. Fluorescent images were taken using a Nikon Ti-E Confocal Microscope (Nikon Instruments Inc., Melville, NY).
7. Fixation of fibroblasts for SEM
The same samples that were used for cell viability tests were rinsed twice with a PBS solution (Invitrogen). Samples were then submerged in a 4% paraformaldehyde solution (Electron Microscopy Solutions) for 30 min. The samples were dehydrated via consecutive 30-min ethanol washes of 50%, 80%, 90%, and 100% concentrations. They were then dried with a vacuum desiccator for 2–3 h before gold sputtering for SEM imaging.
8. MTS assay
Cell Titer 96 Aqueous One Solution Cell Proliferation Assay (Promega) was used to determine the cell number during culture on the scaffolds. This assay utilizes a tetrazolium compound that is bioreduced upon entering a cell. The resulting products alter the absorbance of the media in which the cells reside. Standard curves were established and confirmed by comparison to hemocytometer readings prior to these experiments. Upon testing, cells were treated with an 83% media, 17% MTS [3-(4,5-Dimethylthiazol-2-yl)-5-(3-Carboxymethoxyphenyl)-2-(4-Sulfophenyl)-2H-Tetrazolium] solution and allowed to incubate for exactly one hour. After incubation, 100 µL of spent media was removed and added to a clear 96-well plate. The absorbance of this plate at a wave length of 450 nm was then read with a GloMax-Multi+ Multiplate Reader (Promega, Madison, WI) and the subsequent cell number was thus determined.
III. RESULTS
A. Miscibility of TPU and PVOH
The miscibility of polymers is an important property of composites and may affect the foaming and leaching procedures examined in this study.Reference Gong and Ohshima35Figure 2 shows the DSC results of pure TPU, PVOH, and three composites. Phase separation can be identified from the glass transition temperature (T g) and the crystallization temperature (T c). It was found from Fig. 2(a) that the onset T g of TPU and PVOH was −51 °C and 72 °C, respectively, and that two obvious glass transition slopes were observed in all three composites at the same temperatures, suggesting the poor miscibility between TPU and PVOH. The melting peak separation of the composites was not obvious since the examined materials had close melting temperatures (T m) for the convenience of melt blending. It was noticed that the 1:1 curve and the 4:3:3 curve were very similar in both the second heating and cooling periods since the two samples had similar TPU to PVOH ratios, indicating that the existence of NaCl particles did not influence the thermal properties of the composites. Crystallization peak separation was observed in Fig. 2(b) in which the 1:1 and 4:3:3 samples had similar PVOH and TPU crystallization peaks and the PVOH peak moved to a lower temperature. The 4:1 sample, however, did not have any clear peak, indicating that the two components restricted the crystallization of each other at this ratio.
DSC results of TPU, PVOH, 4:1, 1:1, and 4:3:3 compound pellets before the microcellular injection molding process: (a) second heating and (b) cooling.
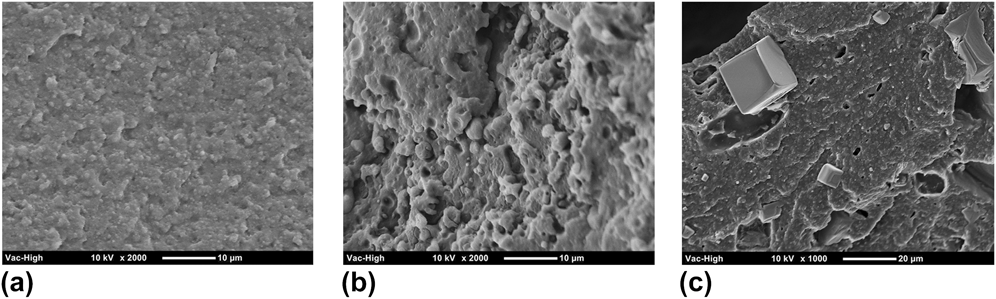
High magnification SEM images can help to further understand the components' miscibility. The phase morphologies of the three composites are shown in Fig. 3, which further proves the poor miscibility of TPU and PVOH. In Fig. 3(a), PVOH is shown to form tiny, uniformly dispersed spheres in the TPU matrix, whereas at a higher PVOH content [Fig. 3(b)], PVOH formed a continuous phase and larger spheres. The poor miscibility between PVOH and TPU may support the feasibility of the leaching procedure. Figure 3(c) at lower magnification shows broken NaCl crystals embedded in the TPU/PVOH matrix. They did not form a strong interface with either TPU or PVOH, which suggests that they will not influence the sample's thermal properties, which matches the DSC results.
SEM phase morphology of three composites: (a) 4:1, (b) 1:1, and (c) 4:3:3.
B. Scaffold morphology
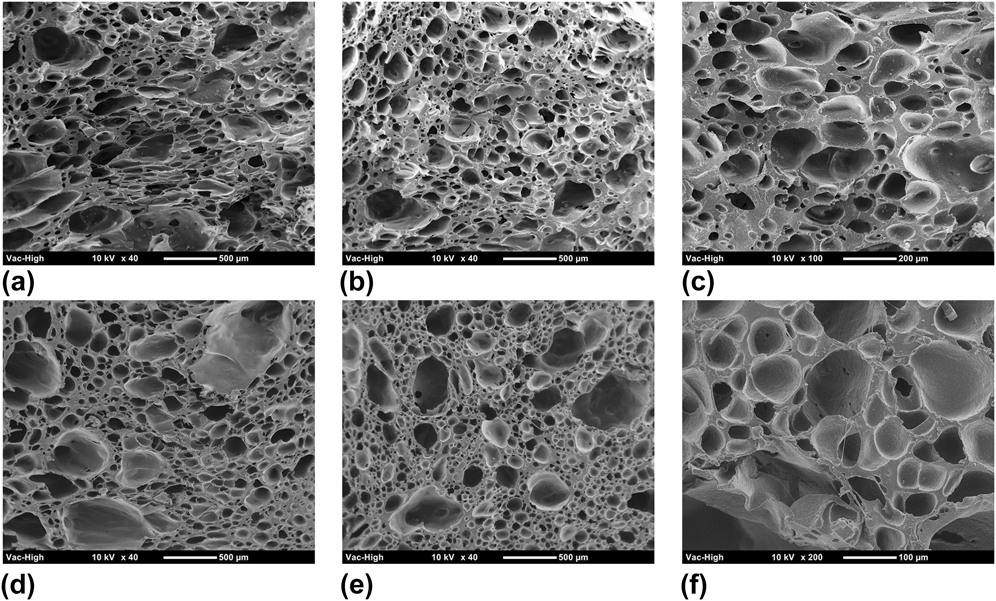
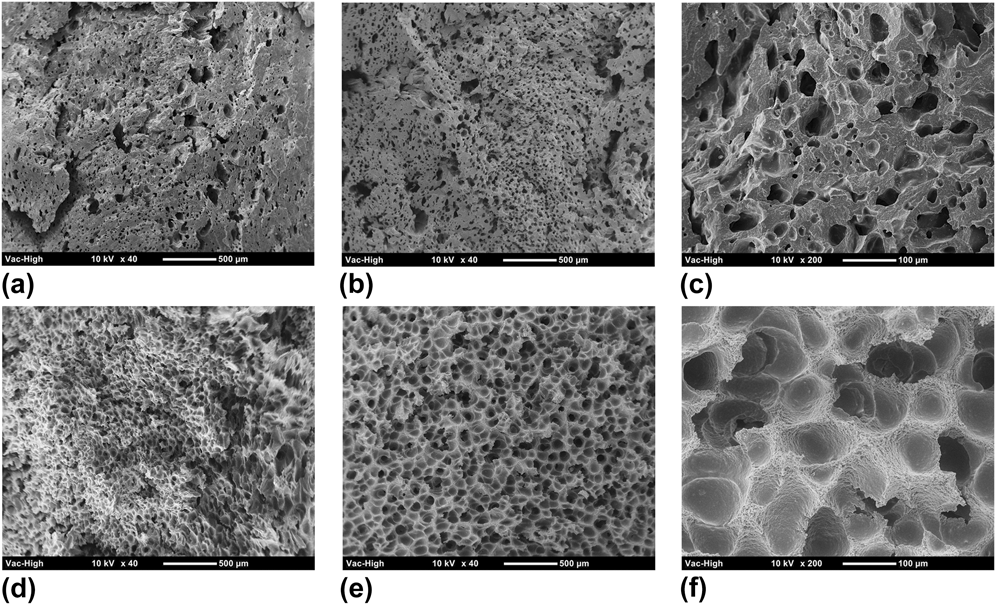
Both cross section and flow direction morphologies of four samples, including 4:1, 1:1, 4:3:3S (solid), and 4:3:3F (foamed), were studied because the injection flow effect is a significant factor in microcellular injection molding. The morphology results of these four samples are shown in Table III. Figure 4 shows the morphology of a 4:1 sample from which it can be seen that the pore size dispersion is more uniform and has fewer small pores along the cross section. Conversely, both large and small pores tend to form in the flow direction and no obvious flow elongated pore structure was observed. A large portion of TPU leads to larger pores, with smaller pores forming at the TPU/PVOH interface. It was noticed from the results that the pore density and porosity increased after leaching, but the average pore diameter decreased. The high magnification images did not show an obvious connection between pores, which probably occurred for two reasons: (1) the PVOH content was too low to form interconnections, and (2) the PVOH molecules had been enclosed by the TPU matrix.
Scaffold morphology statistical results.
SEM pictures of 4:1 samples: (a–c) are cross section morphologies and (d–f) are flow direction morphologies; (a and d) are unleached samples, (b and e) are leached samples, and (c and f) are leached samples at high magnification.
The morphology of the 1:1 sample is shown in Fig. 5. The pore structure in the cross section and flow directions is very different, where the pores in the flow direction are larger and more uniform than those in the cross section direction. This is because the pores grow more easily in the flow direction, which is the direction of decreasing pressure. The pore diameter, pore density, and porosity all increased after leaching according to test results. However, the pore diameter was much smaller than in the 4:1 sample because the increased TPU/PVOH interface supplied more nucleation spots during foaming which led to a higher pore density and a smaller pore diameter.
SEM pictures of 1:1 samples: (a–c) are cross section morphologies and (d–f) are flow direction morphologies; (a and d) are unleached samples, (b and e) are leached samples, and (c and f) are leached samples at high magnification.
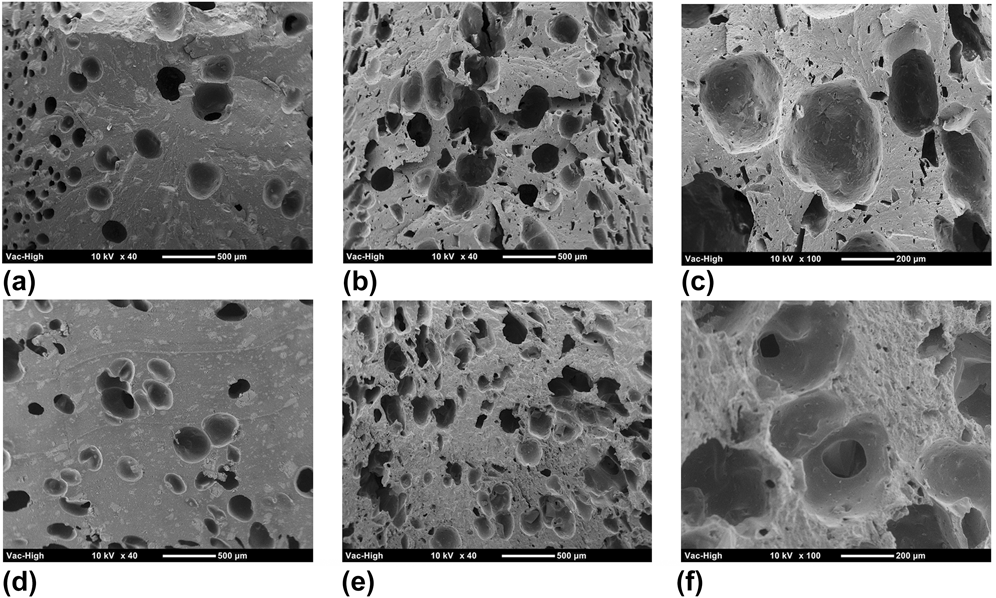
Figure 6 shows the morphology of the 4:3:3S sample. The voids shown in the samples before leaching might have been caused by the degradation of PVOH under high temperature and shear stress, which would have generated water molecules and thus pre-existing voids (due to water-turn-vapor foaming) during processing. After leaching, the samples had very large pores with low density and porosity according to test results. No interconnection between pores was found from the high magnification images.
SEM pictures of 4:3:3S samples: (a–c) are cross section morphologies and (d–f) are flow direction morphologies; (a and d) are unleached samples, (b and e) are leached samples, and (c and f) are leached samples at high magnification.
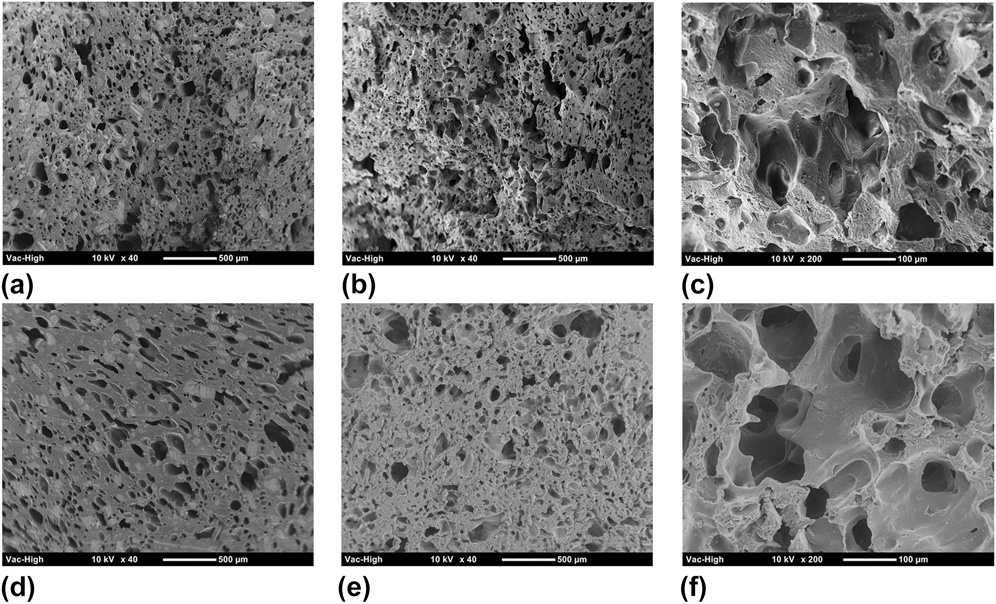
The morphology of the 4:3:3F sample is shown in Fig. 7. The pore structure before leaching was similar to the 1:1 sample, with a small increase in pore diameter and porosity since they have close TPU to PVOH ratios. This confirmed that the addition of the 30% NaCl porogen supplied some nucleation spots and stimulated CO2-foaming behavior. The average pore diameter, pore density, and porosity clearly increased after the leaching process. The enlarged images show that pore interconnection increased in both the cross section and flow directions. Moreover, no visible NaCl particles were observed on the leached samples.
SEM pictures of 4:3:3F samples: (a–c) are cross section morphologies and (d–f) are flow direction morphologies; (a and d) are unleached samples, (b and e) are leached samples, and (c and f) are leached samples at high magnification.
C. Residual of components
The efficiency of the leaching process has to be taken into consideration with this fabrication method. Residual components were studied on the 4:1, 1:1, and 4:3:3F samples. TGA results (Fig. 8) proved that the NaCl particles had been leached out because the leached samples had the same remaining ash as the pure TPU samples. Furthermore, the weight loss of the unleached and leached samples that started at a lower temperature than pure TPU was caused by the decomposition of residual PVOH. To investigate the residual percentage of PVOH, the leached scaffolds were dissolved in DMF for 6 h with vigorous magnetic stirring. Hot water was then added to dissolve the PVOH and precipitate the TPU. The resulting solution was vacuum filtered and dried with a desiccator to obtain the TPU content in the scaffold. The weight loss after the test indicated the PVOH content in the scaffold. The residual PVOH in the leached samples was 11.9%, 24.5%, and 19.5% for the 4:1, 1:1, and 4:3:3F samples, respectively.
TGA results of 4:3:3F leached and unleached samples. Pure TPU was tested for comparison.
D. Cell viability and proliferation
The fluorescence and SEM images of day 3 and day 10 3T3 fibroblast cell culture results are shown in Figs. 9 and 10, respectively. At day 3, very few dead cells (red spots) were found on all three scaffolds, and cells formed some concentrated colonies all over the scaffold surfaces. Interestingly, the scaffold substrate clearly fluoresced purple because the TPU matrix absorbed the DAPI stain. More cell clumps were observed on the 4:3:3F scaffold [Fig. 9(c)] than on any other sample.
Day 3 fibroblast cell culture results of 4:1 (a, d, g), 1:1 (b, e, h), and 4:3:3F (c, f, i) scaffolds: (a–c) are fluorescence microscope pictures, (d–f) are low magnification SEM images, and (g–i) are high magnification SEM images.
Day 10 fibroblast cell culture results of 4:1 (a, d, g), 1:1 (b, e, h), and 4:3:3F (c, f, i) scaffolds: (a–c) are fluorescence microscope pictures, (d–f) are low magnification SEM images, and (g–i) are high magnification SEM images.
By combining SEM images, a better understanding of the fibroblast morphology can be obtained. From Figs. 9(d) and 9(g), it was found that the fibroblast cells spread on the 4:1 scaffold and covered the small pores. Most cells appeared to grow on the surface of the scaffold, with some cells clearly migrating into the pores. The fibroblasts on the 1:1 scaffold, however, did not disperse very well. Some spread and covered the pores, but most of them aggregated into clumps and still exhibited a rounded morphology as shown in Fig. 9(h). The 4:3:3F scaffold presented the best fibroblast cell proliferation and viability at day 3 according to Figs. 9(c), (f), and (i). The fibroblast cells covering the scaffold were mostly flat and well dispersed over the entire scaffold.
More regions of viable cells were observed on all three scaffolds at day 10 than on day 3, indicating that the fibroblast cells proliferated and migrated across the scaffold. Very few dead cells can be seen on the 4:1 and 4:3:3F scaffolds [Figs. 10(a) and 10(c)], while slightly more dead cells were found on the 1:1 scaffold [Fig. 10(b)]. This might have been due to the inability of the cells to penetrate into the scaffold because of the low porosity of the 1:1 scaffold, thus they died on the surface of the scaffold. Figure 10 show that cells spread over the scaffolds and that the small pores were covered at day 10. Cells on the 4:3:3F and 1:1 scaffolds tended to have larger areas than those on the 4:1 scaffold. The high magnification images (Figs. 10i-10g) show that the cells have all spread into a flat morphology, suggesting good attachment. This morphology is particularly apparent on the 4:3:3F scaffold, such that individual cells can hardly be distinguished from their neighboring cells. Additionally, SEM imaging showed that the cells migrated deep into the pores on all of the scaffolds.
IV. DISCUSSION
A. Effect of factors on scaffold morphology
By comparing sample 4:1 (Fig. 4) and 1:1 (Fig. 5), it can be seen that increasing the PVOH content increased the pore density and decreased the pore diameter dramatically, which was due to an increase in the TPU/PVOH interface which induced heterogeneous nucleation during the foaming process.Reference Leung, Park and Li36 The foaming procedure influenced scaffold morphology significantly, as can be seen by comparing sample 4:3:3S (Fig. 6) and sample 4:3:3F (Fig. 7). The pore density and porosity improved dramatically after foaming because the presence of PVOH molecules and NaCl particles induced more pore nucleation spots when foaming occurred. By comparing sample 1:1 (Fig. 5) with sample 4:3:3F (Fig. 7), the effect of NaCl particles can be explored. The addition of NaCl particles improved the pore diameter and porosity. The NaCl particles were leached out leaving voids that further improved the porosity, pore diameter and created interconnection channels.
B. Effect of residual PVOH
The amount of residual PVOH was determined by TGA test. It has been reported that combining PVOH with a polymer can improve the hydrophilicity of composites. Oh et al. fabricated high wettability tissue scaffolds via particle leaching by simply melt blending PVOH with PLGA, and they proved that the addition of PVOH improved human chondrocyte adhesion and proliferation.Reference Oh, Kang, Kim, Cho and Lee37 The improvement of wettability was confirmed in the current study as well. The WCA test results, which are shown in Fig. 11, show that the WCA of three scaffolds all decreased as time went on, and the samples containing PVOH had a much lower WCA than pure TPU sample at 10 s (Fig. 11, inset images). At 0 s, the scaffolds had more residual PVOH and a lower WCA. However, as time passed, the WCA of the 4:3:3F sample decreased faster than for the other samples, which may have been caused by the penetration of water into the sample. This means that the 4:3:3F scaffold had better wettability than the 1:1 scaffold even though there was less residual PVOH, which would account for the high porosity and interconnectivity of the scaffold.
WCA test results for (a) 4:1, (b) 1:1, and (c) 4:3:3 samples at 0, 5, and 10 s. Inset images show the water beads at 10 s. A pure TPU scaffold (WCA: 106.7°) was used for comparison.
C. Effect of scaffolds on cell behavior
It has been reported that the ideal pore size range for MC3T3 cells is 95.9–150.5 μm since scaffolds show the highest cell attachment and viability with pores of this size.Reference O'Brien, Harley, Yannas and Gibson38 The fibroblast cells in this study were about 20 µm long when round and about 40 µm long when spindle-shaped, according to SEM images. It was found that most cells existed on the surface and covered or spread into the small pores on the 4:1 scaffold, while cells dispersed over a larger area on the 1:1 and 4:3:3F scaffolds because of their more uniform and smaller pores. Therefore, a pore size ranging from 50 to 120 µm was suitable for 3T3 fibroblast cells. The cell number on the scaffolds at day 3 and day 10 from the MTS assay is shown in Fig. 12. The data were analyzed using analysis of variance technique. The group with P < 0.05 was recognized as statistically significant. The resulting cell number indicates the number of living and attached cells/cm2 on the scaffold. It was found that the cell count for the 4:1 scaffold was lower than that of the other scaffolds (significantly lower than 4:3:3F) at day 3. The reasons for this might be that the large pores on the 4:1 scaffold were not of the optimal size for fibroblast proliferation, or that the hydrophilicity of the 4:1 scaffold was lower than the others leading to lower cell adhesion as well. It was found at day 10 that the cell number did not increase very much, which was likely due to the over confluency of the seeded cells, which impeded total cell proliferation, while the 4:3:3F scaffold still had the largest number of cells. Moreover, the cell number on the 1:1 scaffold was significantly lower than on the 4:3:3F scaffold due to the large portion of dead cells on the scaffold corresponding to Fig. 10(b). Thus, the scaffold fabricated by the microcellular injection molding and particle leaching method is biocompatible and has the potential to be used in the field of soft tissue recovery.
MTS assay cell count results of 4:1, 1:1, and 4:3:3F scaffolds at day 3 and day 10 time points (significance level P < 0.05).
V. CONCLUSIONS
Interconnected TPU tissue scaffolds were successfully fabricated for the first time by combining microcellular injection molding and particle leaching methods. In this study, supercritical CO2 was used to generate micropores inside of the TPU matrix. NaCl particles were used as porogens to improve the porosity and interconnectivity. PVOH was added to further enhance the interconnectivity and provide hydrophilicity to the scaffolds. It was found from DSC and phase morphology that TPU and PVOH were immiscible and that NaCl particles were embedded inside of the polymer matrix. The effect of each factor on scaffold morphology was investigated. The foaming procedure was necessary to create high pore density and porosity. The addition of PVOH decreased the pore diameter and increased the pore density due to the TPU/PVOH interface. Furthermore, the scaffolds with NaCl porogens exhibited uniform pore morphology and more pore interconnections. The 3T3 fibroblast cell culture was used to confirm the biocompatibility of the scaffolds. Pore sizes ranging from 50 to 120 µm were ideal for 3T3 fibroblast growth. The residual PVOH increased scaffold hydrophilicity, which further improved cell adhesion and proliferation. Lastly, for scaffolds with poor interconnections, an increase in cell death was seen as the culture time increased. The microcellular injection molding and particle leaching combining method have the potential to mass produce tissue scaffold.
ACKNOWLEDGMENTS
The authors would like to acknowledge the financial support of the Wisconsin Institute for Discovery (WID), the China Scholarship Council, the National Nature Science Foundation of China (No.51073061, No.21174044), the Guangdong Nature Science Foundation (No. S2013020013855, No. 9151064101000066), and the National Basic Research Development Program 973 (No. 2012CB025902) in China.