1 Introduction
The learning and prediction capabilities of classifiers are strongly dependent on the data set characteristics. An eminent field has as of recently arisen; that uses a set of complexity measures (CMs) connected to the data set to depict its difficulty. These measures evaluate specific aspects of the data set which are considered complicated to the classification task by Basu and Ho (Reference Basu and Ho2006). Investigations of data complexity metrics applied to specific learning algorithms can be found in Baumgartner and Somorjai (Reference Baumgartner and Somorjai2006) and Basu and Ho (Reference Basu and Ho2006).
Traditionally, a large group of researchers in machine learning deals with the analysis of learning algorithms, to compare the various algorithms. Recently, the issue of data quality has attracted significant attention from a lot of researchers, motivated them to identify the property of data sets which affect the classifiers performance by Salvador and Herrera (2008). From the different properties of data sets like overlapping between classes, noise and class imbalance. Over the past years researchers encountered class overlap problem that appears in real-world domains such as text classification, detection of oil spills and credit card fraud detection. The class overlap problem is concerned with the performance of machine learning classifiers in which data samples appear as valid instances of more than one class by Luengo and Herrera (Reference Luengo and Herrera2012) and Kretzschmar et al. (Reference Kretzschmar, Karayiannis and Eggimann2003). The minor differences that are present in the instances of two different classes are usually difficult to capture using only attributes proposed by the domain experts.
Our work aim is to resolve this noise problem by identifying the reason due to overlapped instances by using four proposed instance overlap measures. After identification, we remove these overlapped instances and apply the noise filter to find the noisy instances. Further, we move to consider the interrelationship between the overlapped instances and class noise present in the data sets.
To perform this study, we have created 438 binary classification data sets from real-world problems and computed the value of 12 metrics proposed by Basu and Ho (Reference Basu and Ho2006). From these 438 binary data sets, we first identified overlapped data sets by using three overlapping measures N1, N2 and F2. If the values of these three measures are close to 1, it means the data sets are highly overlapped. We found that 259 data sets were highly overlapped. Then we apply proposed overlap measures to find overlapped instances from these data sets. Then we try out the relation between overlapped instances and noise by using four noise filters. Our results show that overlapped instances in training data sets degrade the performance of four classifiers, and it is one of the reasons of class noise.
The rest of the work is organized as follows. Section 2 describes our preliminaries and previous work which includes data CMs and noise filters. Section 3 describes data CMs. Section 4 provides an introduction to noise and section 5 describes noise filters. The overlap measures are presented in Section 6 as a means of providing insight into why an instance is overlapped. Then in Section 7, we show the systematic experimental results to find out the useful results. Finally, in Section 8, we conclude our work and the future work.
2 Related work
The increasing popularity of machine learning techniques, it is becoming more and more interesting to identify, a priori, which specific technique will perform better for a particular data set based on the characteristics of the data set. This kind of studies started to receive attention with by Mollineda et al. (2005), and has become more popular since the work of Salvador and Herrera (2008). Many studies have shown that data set complexity including overlapping, lack of representative data as well as the presence of noisy instances by He and Garcia (Reference He and Garcia2009). The issues of overlapping and noisy instances exist in data sets. Therefore, it is not realistic to simply balancing the data set with the complex structure of data.
This idea matures in Mollineda et al. (2005), where a selection of several measures for characterizing the complexity of classification problems is presented, along with an empirical study of the distribution of real-world problems compared to random noise, indicating that it is possible to find learnable structures with the geometrical measures presented. That is, they can be successfully used to discriminate between the different classes based on different geometrical properties of the data manifolds. These measures indicate the overlap of individual feature values; the separability of classes; and geometry, topology and density of manifolds. This group of measures encounters its natural definition in the two-class domain.
3 Data Complexity Measures
The use of CMs for classification has received increasing consideration since their formal definition in Bernad-Mansilla and Ho (Reference Bernad-Mansilla and Ho2005). These measures have been characterized to focus the intrinsic qualities of real-world classification data sets. They go for describing the unpredictability of classification problem by using geometrical descriptors, for example, the degree of linear separability amongst classes, Fisher’s discriminant proportion or the width of the class limit. Henceforth, numerous ensuing studies have connected these CMs to discover the areas of capability of diverse classifiers by Mollineda et al. (2005) and Orriols-Puig et al. (Reference Orriols-Puig, Macia and Ho2010).
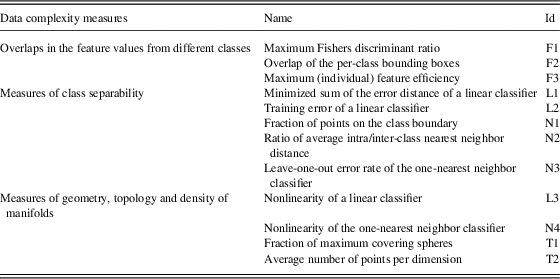
The prediction capabilities of learning classifiers are emphatically subject to data complexity. This is the motivation behind why different late papers have acquainted the use of measures with portray the information and to relate these qualities to the classifier performance by Luengo and Herrera (Reference Luengo and Herrera2012) and Snchez et al. (Reference Snchez, Barandela, Marqus, Alejo and Badenas2003). The authors characterize some quality measures for two classes, and we have likewise demonstrated in Table 1.
Data complexity measures

4 Noise in data sets
Noise in a data set can adversely affect decisions that are based on modeling and analysis of the software data by Zhu and Wu (Reference Zhu and Wu2004). The data set can usually be characterized by two information sources: (1) attributes and (2) class labels. The quality of the attributes indicates how well the attributes describe instances for classification purpose, and the quality of the class labels represents whether the class of each instance is correctly assigned. The quality of a data set is determined by two, external and internal, factors: the internal factor indicates whether attributes and the class are well selected and defined to characterize the underlying theory, and the external factor shows errors introduced into attributes and the class labels (systematically or artificially). Improved data quality considerably shortens and simplifies analysis cycles.
Noise, when it happens in the class labels, can have a negative effect on classification performance by Khoshgoftaar et al. (Reference Khoshgoftaar, Zhong and Joshi2005). An instance contains class noise if the anticipated class of the instance is different in relation to the recorded target class. The most common technique for taking care of with noise is to apply a learning algorithm that is robust by Jeatrakul et al. (Reference Jeatrakul, Wong and Fung2010) to noise. It is difficult to depict the adequacy of the description for attributes and the class expressively. When an instance becomes noisy due to the errors present in attributes or the class, we indicate that the instance contains noise. The nature of the properties of attributes shows how well the attributes characterize instances for classification purpose; and the nature of the class labels signifies whether the class of every instances is accurately assigned. The class label, concurring to Zhu and Wu (Reference Zhu and Wu2004), is also a target concept which when performing classification is characterized by the attributes. Therefore, it is an issue which is all that much fixed to the specific problem of learning a classifier since attribute noise will hamper the classifier’s ability to predict a class variable.
The physical sources of noise in machine learning and data mining can be distinguished into two categories:
∙ Attribute noise: in contrast to class noise, attribute noise reflects erroneous values for one or more attributes (independent variables) of the data set.
∙ Class noise: the class labels noise represents whether the class of each instance is correctly assigned or not.
5 Noise filters
Filtering essentially filter out the data instances that are suspect of noise as indicated by precise assessment mechanisms. Numerous noise-filtering techniques avoid overfitting or just filter out offending portions of the information in data. In filtering out the noisy instances, there is an undeniable tradeoff between the measure of noise filtered and the measure of information held: the more noisy instances filtered, the less accessible data left for critical data analysis investigation.
In this section, some representative studies of filters are given below.
1. Edited nearest neighbor (ENN): This algorithm was proposed by Wilson (Reference Wilson1972). It removes all instances that have been misclassified by the k-nearest neighbors (KNN) rule from the training set. This method is the basis for many other related methods.
2. Repeated ENN (RENN): RENN by Wilson (Reference Wilson1972) applies the ENN algorithm repeatedly until all remaining instances have a majority of their neighbors with the same class, which continues to widen the gap between the classes and to smooth the decision boundary of ENN.
3. All KNN (ANN): The ANN algorithm is similar to the iterative ENN except that the value of k is increased after each iteration by Tomek (Reference Tomek1976).
4. Multiedit: This method was proposed because Wilson ENN is inconsistent with its assumption of statistical independence. This is because the training examples are alternatively used as both testing and training data. To achieve statistical independence, the examination of the training examples can be performed in a Holdout manner by Devijver (Reference Devijver1986).
5. Modified ENN: This algorithm is an extension of ENN. It removes the example if its label differs from the predicted label of its k+l nearest neighbors. Here, the additional one neighbors are the instances in the training set that have the same distance as the last neighbor of x i by Hattori and Takahashi (Reference Hattori and Takahashi2000).
6. Relative neighborhood graph edition: Although there are many mislabeled data detection methods, most existing studies suffer from certain limitations. Especially when the number of training examples is not large enough, many of the existing methods are no longer optimal. Therefore, some alternative schemes are needed. This method uses the concept of a proximity graph to detect mislabeled examples by Snchez et al. (Reference Snchez, Mollineda and Sotoca1997).
7. Nearest centroid neighbor edition: In the nearest centroid neighborhood (NCN) concept, the neighborhood is defined by two factors: the proximity of instances to a given training example and the symmetrical distribution around it. The NCN neighborhood makes use of the information of the geometrical distribution to obtain better classification by Salvador and Herrera (2008) and Derrac et al. (Reference Derrac, Triguero, Garca and Herrera2012).
6 Proposed overlap measures
In this section, we introduce a set of measures that measure overlapping aspects an individual instance in the data set. Every overlap measure evaluates a part of why an instance are overlapped by utilizing distinctive measures that are in light of learning algorithm utilized as a part of machine learning and, in this way, gives essential experiences into:
∙ Why specific instances are overlap?
∙ How could we identify them?
∙ How the overlapped instances responsible for the presence of noise?
∙ How the performance of classifiers affected by the overlapped instances as noise?
The set of overlap measures was discovered by examining the learning mechanisms of several learning algorithms. In compiling a set of measures, we choose to use those that are relatively fast to compute and are interpretable so as to provide an indication as to why an instance is overlapped.
Nearest Enemy Ratio (NER): NER measures the local overlap of an instance in the original task space about its nearest neighbors. The NER of an instance is the percentage of the k nearest neighbors for an instance that do not share its target class value. To identify the k nearest neighbors, we were using Euclidean distance measure:
 $$NER(x){\equals}{{\left| {x''\in T\,\,\colon\,\,x''\,\in\,k{\minus}neighbors(x)\,\wedge\,class(x'')\,\,\ne\,\,class(x) } \right|} \over k}$$
SubConcept Ratio (SCR): The SCR of an instance is the number of instances in a subconcept belonging to different class divided by the total number of instances in the subconcept:
 $$SCR(x){\equals}{{\left| {x''\,\in\,T\,\,\colon\,\,x''\,\in\,subconcept(x)\,\wedge\,class(x'')\,\,\ne\,\,class(x)} \right|} \over k}$$
Likelihood Ratio (LR): LR is the contrast between the class probability of instance fitting in with its objective class and maximum probability to second class.
 $$LR(x){\equals}\prod\limits_i^{\left| x \right|} {P\left( {x_{i} \,\mid\,t(x)} \right){\minus}argmax_{{y{\epsilon}Y}} \,L(x,\,y)} $$
Soft Margin Ratio (SMR): Given an instance x (definition candidate), support vector machines (SVM) assigns a score to it based on
 $$SMR(x){\equals}\mathop{\sum}\limits_{j{\equals}1}^m {\left( {\alpha _{j} y_{j} G(x_{j} ,\,x)} \right)} {\plus}b$$
where
 $\alpha _{j} $
,
 $j{\equals}1, \cdot \cdot \cdot ,l$
denotes a Lagrange multiplier and b denotes an intercept. The sample data with the corresponding Lagrange multiplies α
j
>0 are called support vectors.
The higher the value of SMR(x) is the better the instance x is as a definition. In classification, the sign of SMR(x) is used. If it is positive, then x is classified into the positive category, otherwise into the negative category.
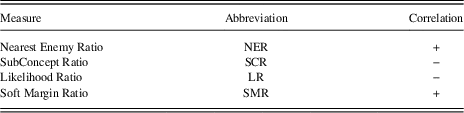
The summary of overlap measures and their description with correlation to class overlapping is given in Table 2. Although all of the overlap measures are intended to understand why an instance is overlapped and the second important question is why overlapped instances misclassify by classifiers. In Table 2, the + and − symbols distinguish which overlap measures are positively and negatively correlated with class overlapping.
List of overlap measures and their description with correlation to overlapping

7 Experimental framework
In this section, we present and discuss the results of the experiments carried out to assess the overlap measures proposed in the context of learning applied to improve classifier performance. The primary goal of this work is to gain some insights on the class overlapping problem and their interrelationship with classification performance and class noise. We investigate the performance of KNN by Cover and Hart (Reference Cortes and Vapnik1967) and Snchez et al. (Reference Snchez, Mollineda and Sotoca2007), C4.5 by Quinlan (Reference Quinlan2014), Naive Bayes (NB) by Domingos and Pazzani (Reference Domingos and Pazzani1997), SVM by Cortes and Vapnik (Reference Cover and Hart1995) algorithm with and without overlapped condition.
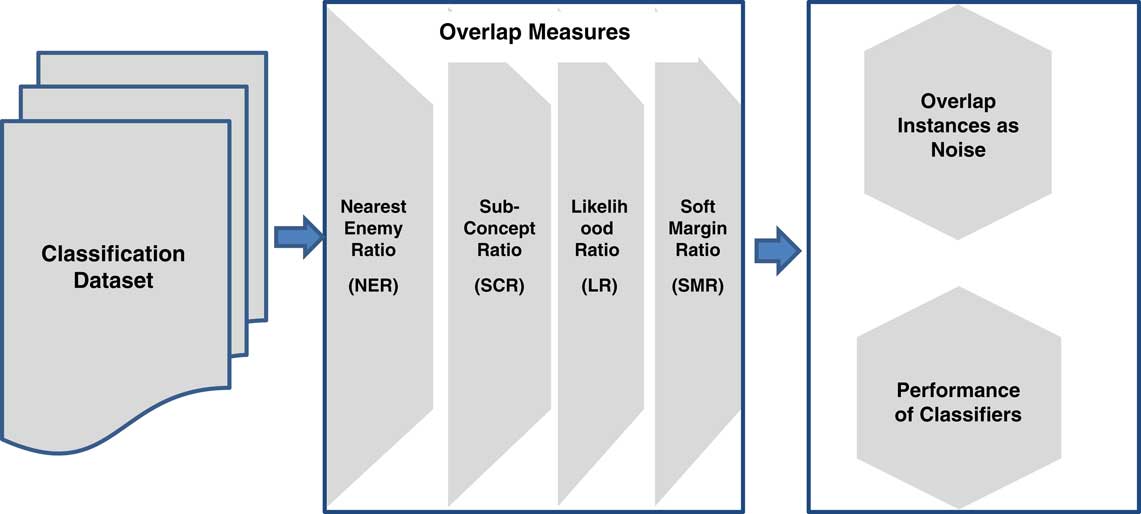
The overview of experimental framework along with the steps identified at each level is shown in Figure 1. We describe each step of the experimental framework in next subsections.
Experimental framework

7.1 Experimental data sets
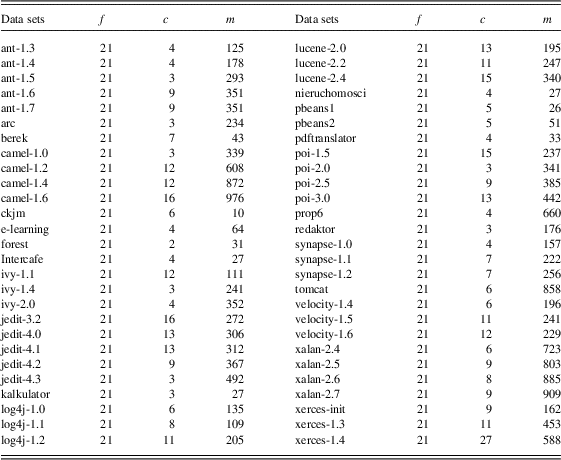
To do this experiment, we were using 54 real-world multi-class data sets from data set repositories. Multi-class data sets are used to create other binary data sets employing the selection and combination of their classes. From these 54 data sets, we built 438 binary data sets. These binary data sets were generated from pairwise combinations of the classes. We take each data set and extract the instances belonging to each class, and a new data set with the combination of the instances from two different classes is constructed. The statistics of data set are given in the Table 4.
7.2 Parameters of the methods
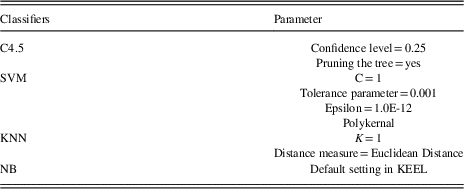
In this section, we present the parameters used for the four classifiers considered using the values recommended by the studies. We have used the implementations of these learning classifiers available in KEEL software by Alcal-Fdez et al. (Reference Alcal-Fdez, Fernndez, Luengo, Derrac, Garca, Snchez and Herrera2011). The parameters are shown in Table 3, indicating the ranges of search if applicable.
Parameters used by the classifiers

7.3 Experimental study
The complete process to execute the experiment is described as follows:
1. In total, 438 different classification data sets are built as follows:
∙ From 54 data sets in Table 4 have been selected from the UCI and KEEL-data set repository by Alcal-Fdez et al. (Reference Alcal-Fdez, Fernndez, Luengo, Derrac, Garca, Snchez and Herrera2011).
∙ Binary data sets are created from these data sets by means of the selection and/or combination of their classes. Only problems with two classes are considered as the data CMs are only well defined to work on binary problems.
2. The test performance of three classifiers: KNN, C4.5, NB and SVM on each of the 438 data sets, is computed. The estimation of the classifier performance is obtained by a run of five cross-validations.
3. Overlapped instances as noise: to identify noisy instances in overlapped data sets, we apply four noise filter. Further, we find the percentage of overlapped as noisy instances.
Statistics of the data sets: number of variables (f), number of classes (c), number of instances (m) and imbalanced ratio

7.3.1 Identification of overlapped data sets using data CMs
For identification of overlapped data sets from 438 data sets. We first identify the value of the different data CMs has been obtained with the data complexity library in DCoL (Orriols-Puig et al., Reference Orriols-Puig, Macia and Ho2010). It is important to note that not all the data sets generated by this procedure may be valid. To avoid the data sets that may yield erroneous conclusions, we filter those created data sets that resulted to be too easy for the classification task and less overlapped data sets. If the data set proves to be less overlapped, then we may classify it with a linear classifier with no error and such a data set would not be a representative problem to perform the experiment. The CMs N1, N2 and F2 indicate the overlapping among the classes in data set by Mollineda et al. (2005) and Luengo and Herrera (Reference Luengo and Herrera2012). When the value of N1 and N2 is close to 1, and F2 value is close to 0, it shows that a data set is highly overlapped. But there is some threshold value through with we find highly overlapped data sets. For these, we take the thresholds from studies which perform interesting experiments to locate the value. From these papers, we make a rule to filter out highly overlapped data sets. The rule is
 $$dataset(x){\equals}\left\{ {\matrix{ {{\rm Overlapped},} \hfill & {{\rm if}\,N1\,\gt\,0.26\,\,{\hbox\&}\,\,N2\,\gt\,0.6\,\,{\hbox \&}\,\,F2\,\lt\,0.57.} \hfill \cr {{\rm Nonoverlapped},} \hfill & {{\rm otherwise}.} \hfill \cr } } \right.$$
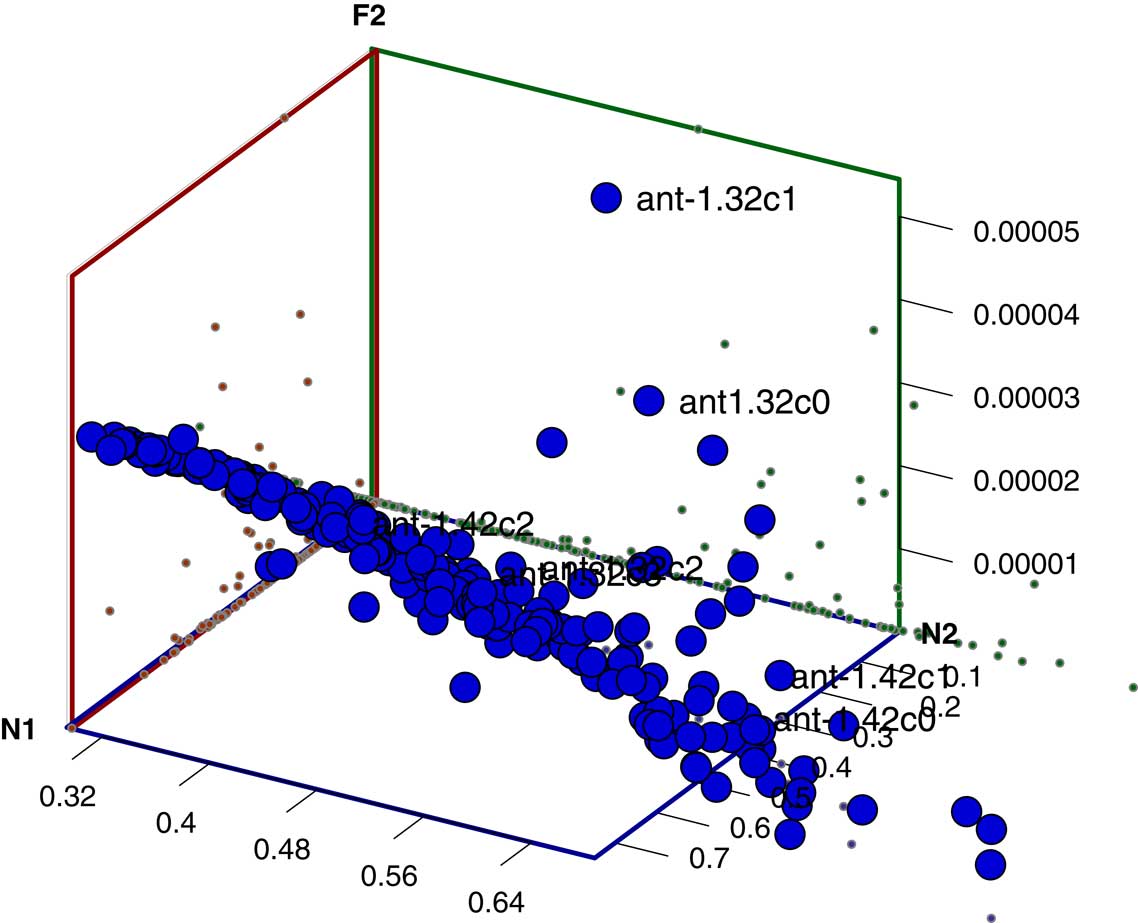
After the identification of highly overlapped data sets which is shown in Figure 2, we perform the experiments of our work which is given in next subsections.
Graph for identifying overlapped data sets using data complexity measures

7.3.2 Identification of overlapped instances using overlapping measures
Given an overlapped training set, we try to identify overlapped instances by using proposed overlapped measures and find the measures values according to overlapped measures. From these values we find the score of an overlapped instances by using the following formula:
 $$SOI{\equals}{1 \over k}\,\mathop{\sum}{\left( {NER,\,SCR,\,LR,\,SMR} \right)} $$
where k is the number of proposed overlap measures.
After calculating the scores for all instances in a training set, we have to find the highly overlapped instances. From this score, we found that instances whose values are greater than 0.6 are highly overlapped. After the identification of highly overlapped instances, we perform next two important experiments of our work which is given in next subsections.
7.3.3 Overlapped instances as noise
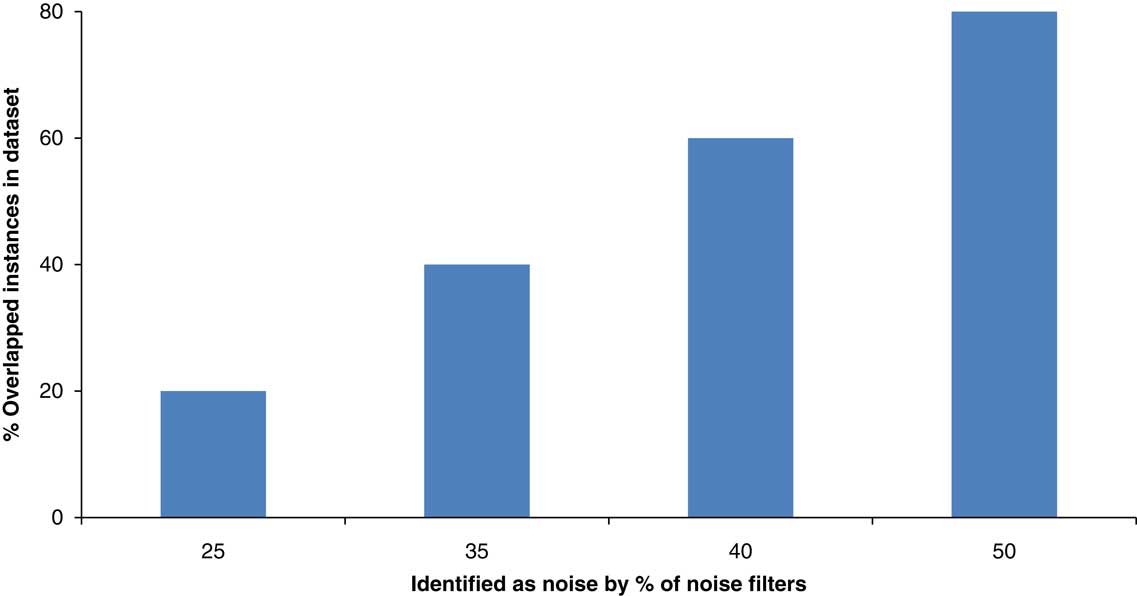
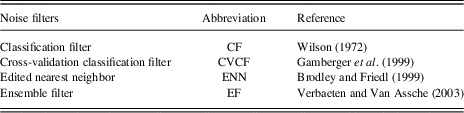
In order to find the overlapped instances as noise, we have use four noise filters – Classification filter by Gamberger et al. (Reference Gamberger, Lavrac and Groselj1999), by Verbaeten and Van Assche (Reference Verbaeten and Van Assche2003), ENN by Wilson (Reference Wilson1972) and Ensemble filter by Brodley and Friedl (Reference Brodley and Friedl1999) given in Table 5. By applying these noise filters on the data set, we found that from overlapped instances more than 60–80% overlapped instances are identified as noisy instances are shown in Figure 3.
Percentage of overlapped instances as noise that are misclassified by at least a percentage of the learning algorithms

Noise filters employed in the experimentation

7.3.4 Performance of classifiers with and without overlapped instances in training set
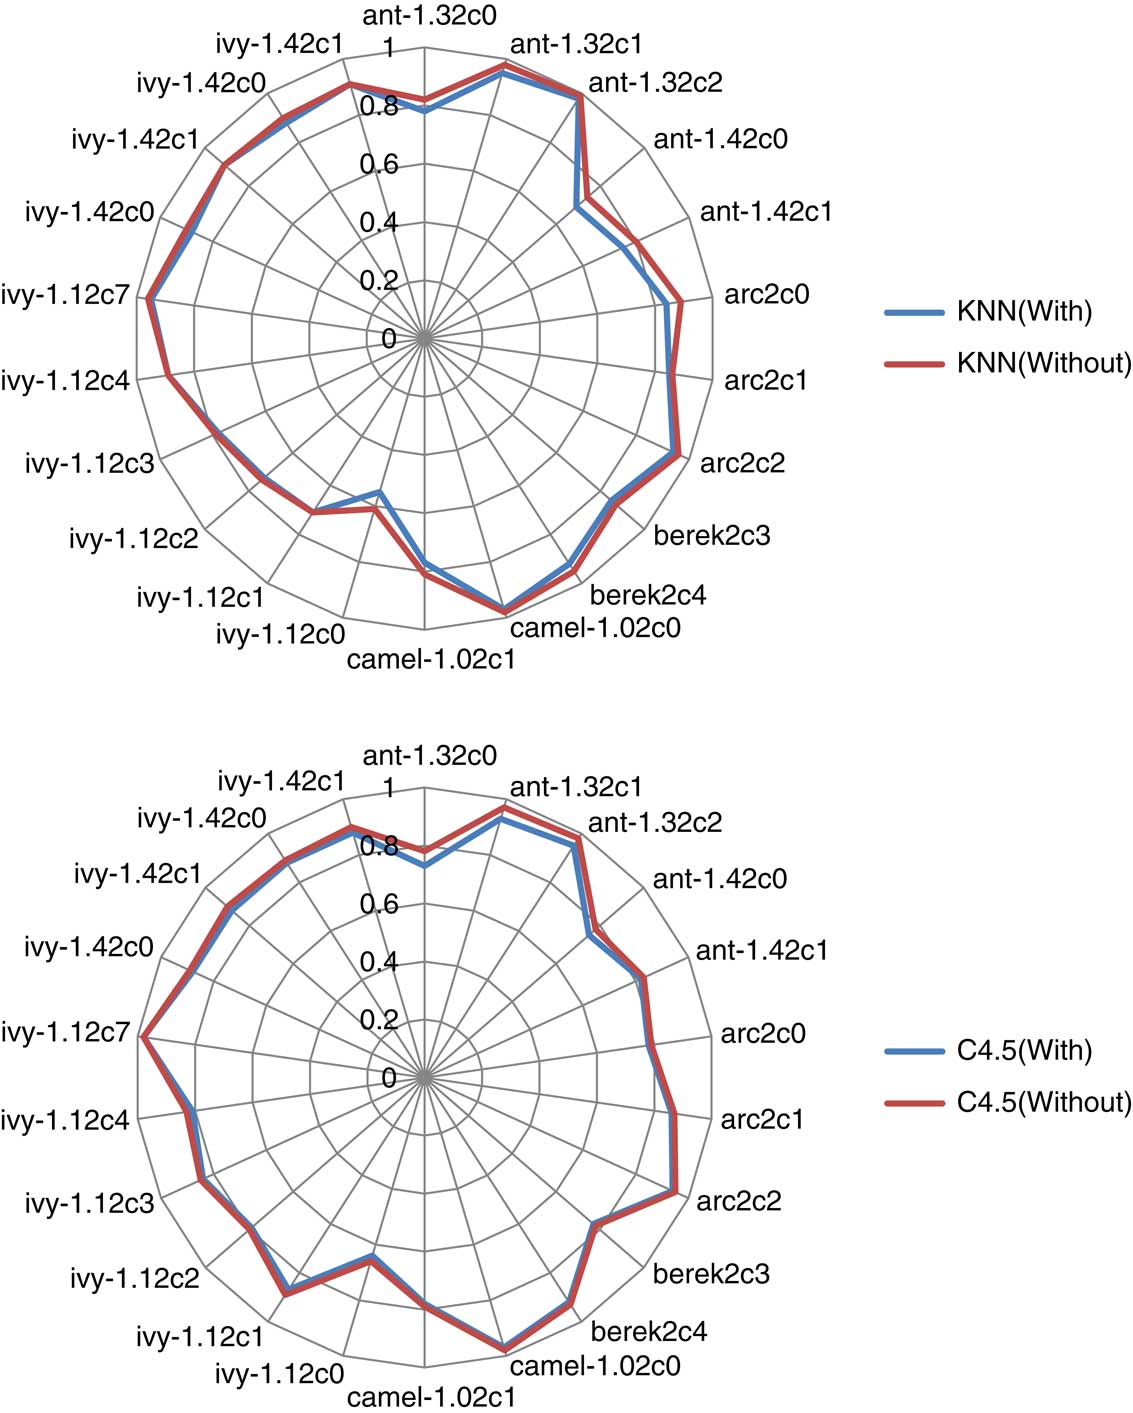
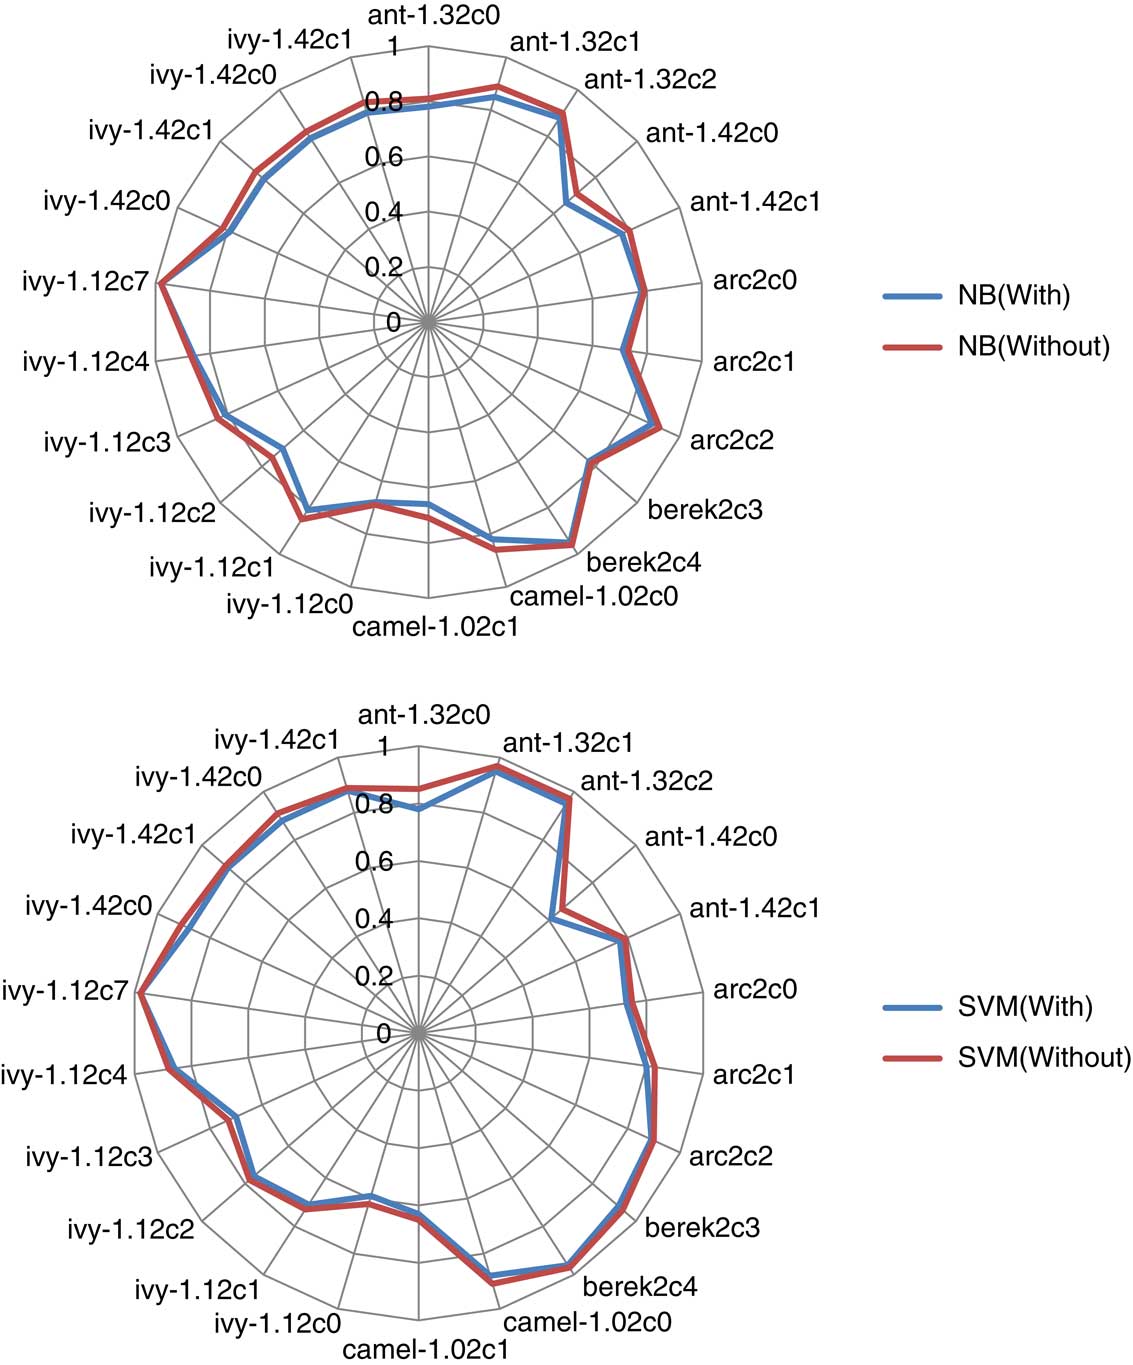
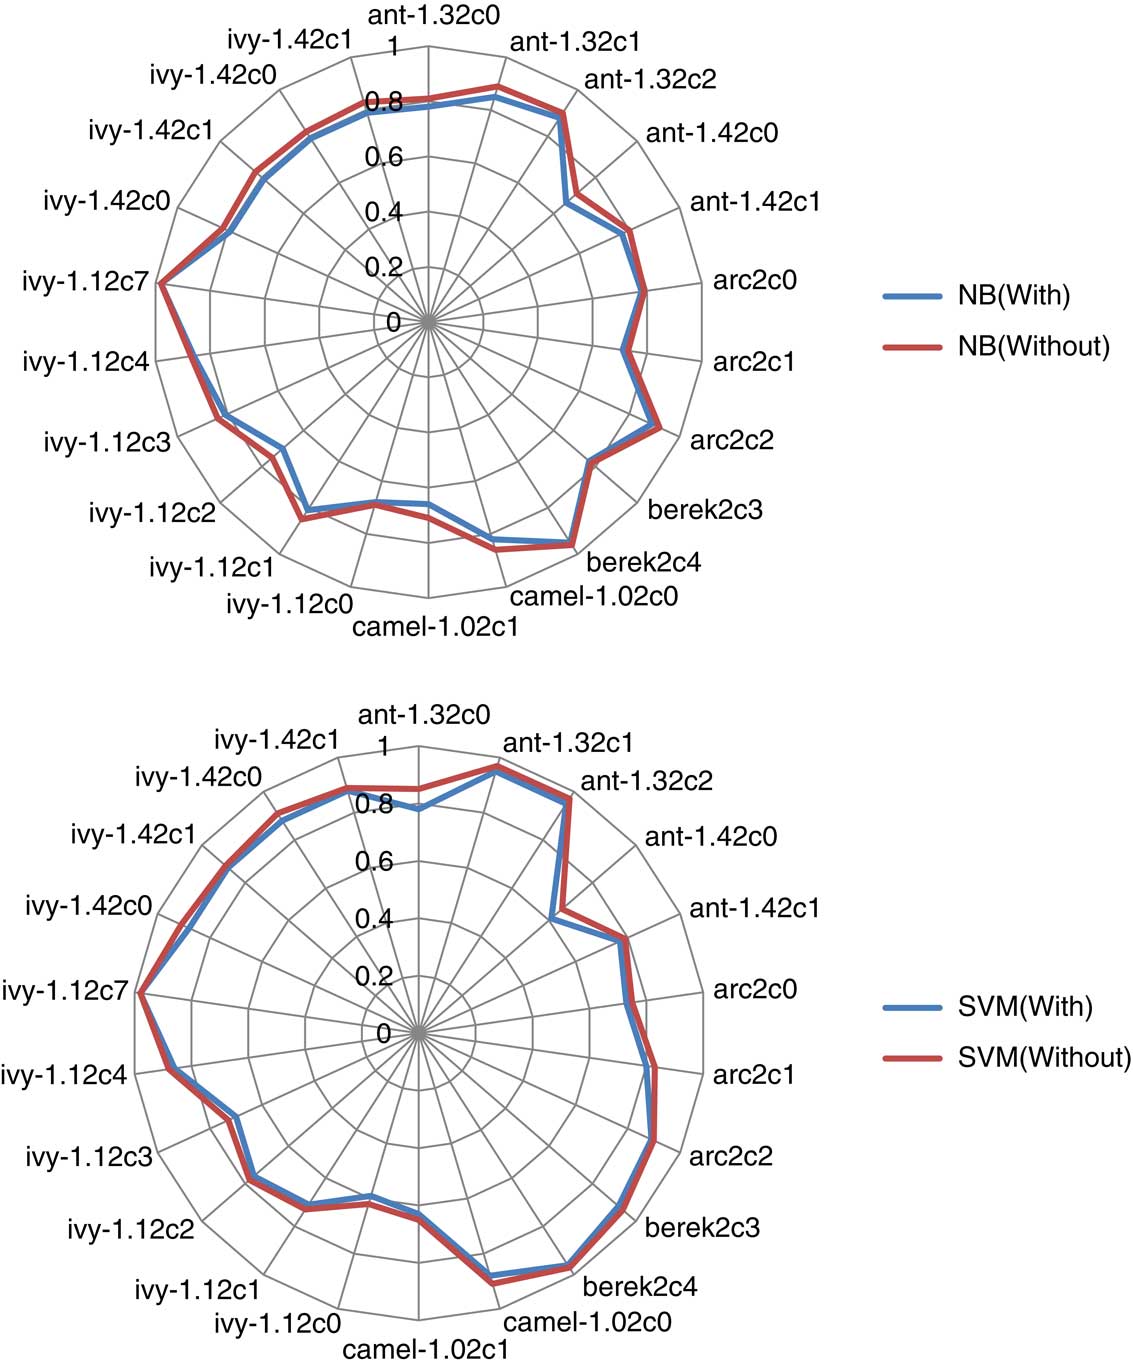
The test performance of KNN, SVM, NB and C4.5 on each of the data sets is computed. We remove those overlapped instances which are identified as noisy instances by 50% noise filters. The estimation of the classifier performance is obtained using five cross-validations. The performance evaluation is used to check which classifiers are improved in their performance by removing the overlapped instances as noise from data sets.
To properly analyze the performance of classifiers, the Wilcoxon’s signed rank statistical test is used, as suggested in the literature Jain et al. (Reference Jain, Duin and Mao2000). This is a non-parametric pairwise test that aims to detect significant differences between two sample means, that is, the behavior of the two algorithms involved in each comparison. For each data set, the with and without overlapping versions will be compared using Wilcoxon’s test and the p-values associated with these comparisons will be obtained shown in Table 6. The p-value represents the lowest level of significance of a hypothesis that results in rejection, and it allows one to know whether two algorithms are significantly different and the degree of their difference. We will consider a difference to be significant if the p-value obtained is lower than 0.05/even though p-values slightly higher than 0.05 might be showing important differences. We study both, performance and robustness because the conclusions reached with one of these metrics necessary not imply the same conclusions with the other one.
p-Values on data sets

Figures 4 and 5 and Table 6 shows the test accuracy of the KNN, SVM, NB and C4.5 classification algorithm and the associated p-values of 20 data sets out of 259 data sets(not possible to show all the data sets) between the with and without class overlapping from the Wilcoxon’s test.
Radar chart of performance(in terms of accuracy) of KNN and C4.5 classifier with and without overlapped instances as noise

Radar chart of performance(in terms of accuracy) of NB and SVM classifier with and without overlapped instances as noise
7.4 Validity considerations
We will discuss the various issues that threaten the validity of the empirical studies and how we attempted to alleviate them:
Threats to conclusion validity: The conclusion validity defines the extent to which conclusions are statistically valid. The only issue that could affect the statistical validity of this study is the size of the data set. We are aware of this, but it is well acknowledged that Empirical Software Engineering suffers from the lack of enough data.
Threats to construct validity: The construct validity is the degree to which the independent and the dependent variables are accurately measured by the measurement instruments used in the studies.
Threats to internal validity: The internal validity defines the degree of confidence in a cause–effect relationship between factors of interest and the observed results. Seeing the results of the experiment, we can conclude that empirical evidence of the existing relationship between the independent and the dependent variables exists. The analysis performed here is correlational in nature. We have demonstrated that measure investigated had a statistically and practically significant relationship with classifier performance.
Threats to external validity: External validity is the degree to which the research results can be generalized to the population under study and other research settings. The greater the external validity, the more the results of an empirical study can be generalized to actual engineering practice. In the experiments, we tried to use 438 data sets which can be representative of real-world data set. These data sets help the experiment to make the results more generalized.
8 Conclusions and future work
In real-world problems, the overlapping problem is ubiquitous, due to the imperfectness of attributes. Traditional classifiers which use the clear decision strategy may suffer from a significant number of misclassifications in the overlapping region. To solve this problem, we identify overlapped instances by using different proposed measures based on learning algorithms. We found that identifying the overlapping instances was the best scheme for solving the class overlapping problem.
The analysis of overlapping instances as noise by using noise filters shows that 60–80% of overlapped instances are identified as noise by noise filters. It indicates that if the data sets are highly overlapped, it may also contain noise which degrades the performance of classifiers.
In future, we develop a new classification algorithm that is robust to class overlapping by using these overlap measures. As future works, we plan to generate artificial data sets with different level of overlapping among classes and also add more classification algorithm to the experiments. We also find, how classifier performance can be affected by the different level of overlapping will be studied. It is also interesting to develop a new hybrid measure to identify overlap instances.