





1. Introduction
Bubble collapse near solid boundaries involves high speeds, high energy densities and very small time and length scales. This intense and fast energy release is the origin of the destructive potential of bubble cavitation, well known to be detrimental to the material surface. In fact, apart from the negative effect on hydraulic turbines and other applications in power engineering (Stripling & Acosta Reference Stripling and Acosta1962), cavitation can be exploited in many contexts, such as industrial cleaning processes (Brems et al. Reference Brems, Hauptmann, Camerotto, Pacco, Kim, Xu, Wostyn, Mertens and De Gendt2013), nanomaterials synthesis (Xu, Zeiger & Suslick Reference Xu, Zeiger and Suslick2013), kidney stones fragmentation in shock wave lithotripsy, (Zhong Reference Zhong2013), root canal treatment in dentistry (Robinson et al. Reference Robinson, Macedo, Verhaagen, Versluis, Cooper, Van der Sluis and Walmsley2018), ophthalmic surgery (Vogel et al. Reference Vogel, Hentschel, Holzfuss and Lauterborn1986) and drug permeability enhancement of overall tissues or cell membranes (Coussios & Roy Reference Coussios and Roy2008; Brennen Reference Brennen2015; Peruzzi et al. Reference Peruzzi, Sinibaldi, Silvani, Ruocco and Casciola2018; Silvani et al. Reference Silvani, Scognamiglio, Caprini, Marino, Chinappi, Sinibaldi, Peruzzi, Kiani and Casciola2019). The implosion of small bubbles is relevant also for botany, for example in the spore dispersal of ferns (Noblin et al. Reference Noblin, Rojas, Westbrook, Llorens, Argentina and Dumais2012; Scognamiglio et al. Reference Scognamiglio, Magaletti, Izmaylov, Gallo, Casciola and Noblin2018) or for the embolism of plant xylems under drought (Vincent et al. Reference Vincent, Marmottant, Quinto-Su and Ohl2012; Ponomarenko et al. Reference Ponomarenko, Vincent, Pietriga, Cochard, Badel and Marmottant2014). In most of these applications, the bubbles are relatively small, typically micrometre size. Despite their size, which may lead one to think that inertial effects are negligible, the damaging potential of micrometre-sized bubbles is, in fact, unexpectedly large.
From the experimental side, much work accumulated starting from the pioneering experiments carried out in Lauterborn's group using millimetre-sized laser-induced bubbles (Lauterborn & Bolle Reference Lauterborn and Bolle1975) that inspired much successive work (Occhicone et al. Reference Occhicone, Sinibaldi, Danz, Casciola and Michelotti2019; Sinibaldi et al. Reference Sinibaldi, Occhicone, Alves Pereira, Caprini, Marino, Michelotti and Casciola2019; Bokman et al. Reference Bokman, Biasiori-Poulanges, Meyer and Supponen2023). High-speed visualisations showed complex dynamics where the imploding bubble loses its spherical symmetry, due to the wall that inhibits the motion of the proximal part of the bubble, at the same time increasing the speed of the distal part. As a consequence, a strong water jet pierces the bubble, changing its topology from a spheroid into a toroid, while at the same time a complex system of compression waves is launched into the liquid. The combined action of the jet and the shock wave violently stresses the wall material inducing its damage in the form of pitting.
Different surfaces have been investigated in the past, including rigid walls (Tomita & Shima Reference Tomita and Shima1986; Zhang, Duncan & Chahine Reference Zhang, Duncan and Chahine1993; Brujan et al. Reference Brujan, Keen, Vogel and Blake2002; Johnsen & Colonius Reference Johnsen and Colonius2009; Gonzalez-Avila, Denner & Ohl Reference Gonzalez-Avila, Denner and Ohl2021; Saini et al. Reference Saini, Tanne, Arrigoni, Zaleski and Fuster2022), elastic solids (Brujan et al. Reference Brujan, Nahen, Schmidt and Vogel2001), soft tissues (Kodama & Takayama Reference Kodama and Takayama1998), porous plates (Andrews, Rivas & Peters Reference Andrews, Rivas and Peters2023) and free liquid–gas interfaces (Robinson et al. Reference Robinson, Blake, Kodama, Shima and Tomita2001). Plastic deformation has also been addressed in a number of papers, see e.g. Philipp & Lauterborn (Reference Philipp and Lauterborn1998), Dular, Delgosha & Petkovšek (Reference Dular, Delgosha and Petkovšek2013) and Dular et al. (Reference Dular, Požar, Zevnik and Petkovšek2019), where the shape and size of the indentations were measured accurately.
Concerning numerical simulations, several works that coupled the dynamics of the fluid–solid system emerged in recent years (Chahine & Hsiao Reference Chahine and Hsiao2015; Cao et al. Reference Cao, Wang, Coutier-Delgosha and Wang2021). In most of these cases, the focus was on relatively large, macroscopic bubbles, where the relevant physics is essentially described by the inviscid Euler equation for the only liquid phase (Johnsen & Colonius Reference Johnsen and Colonius2009; Rasthofer et al. Reference Rasthofer, Wermelinger, Karnakov, Šukys and Koumoutsakos2019).
With the advent of microtechnologies, experiments are now pushed to the submillimetre range (Ohl & Ikink Reference Ohl and Ikink2003; Tho, Manasseh & Ooi Reference Tho, Manasseh and Ooi2007; Wu et al. Reference Wu, Zheng, Li, Ohl, Yu and Li2021; Pfeiffer et al. Reference Pfeiffer, Shahrooz, Tortora, Casciola, Holman, Salomir, Meloni and Ohl2022; Gutiérrez-Hernández et al. Reference Gutiérrez-Hernández, Reese, Ohl and Quinto-Su2023). Significant effort is currently aimed at understanding how the material surface is affected by the collapsing bubble, particularly concerning clinical and biophysical applications (Miller, Pislaru & Greenleaf Reference Miller, Pislaru and Greenleaf2002; Adhikari, Goliaei & Berkowitz Reference Adhikari, Goliaei and Berkowitz2016; Mancia et al. Reference Mancia, Vlaisavljevich, Yousefi, Rodriguez, Ziemlewicz, Lee, Henann, Franck, Xu and Johnsen2019; Barney et al. Reference Barney2020), and industrial cleaning processes (Zeng et al. Reference Zeng, Gonzalez-Avila, Dijkink, Koukouvinis, Gavaises and Ohl2018; Zeng, An & Ohl Reference Zeng, An and Ohl2022; Reese, Ohl & Ohl Reference Reese, Ohl and Ohl2023; Mnich et al. Reference Mnich, Reuter, Denner and Ohl2024). It is the purpose of the present paper to discuss the response of the material surface to the implosion of such small vapour bubbles, where surface tension, viscosity and phase change are intermingled, calling for a comprehensive model encompassing all the phenomenologies occurring along bubble collapse (Magaletti, Marino & Casciola Reference Magaletti, Marino and Casciola2015; Magaletti et al. Reference Magaletti, Gallo, Marino and Casciola2016). The bubble is assumed to be already present in the liquid, with no regard to the nucleation process that led to the bubble formation, see Gallo, Magaletti & Casciola (Reference Gallo, Magaletti and Casciola2018, Reference Gallo, Magaletti and Casciola2021), Gallo et al. (Reference Gallo, Magaletti, Cocco and Casciola2020, Reference Gallo, Magaletti, Georgoulas, Marengo, De Coninck and Casciola2023) and Magaletti, Gallo & Casciola (Reference Magaletti, Gallo and Casciola2021) for details on nucleation in the context of this kind of model. The wall is assumed flat and the analysis will concern the deformation of the solid, assumed as an elastoplastic material. Given the small size of the bubble, and the need to simultaneously account for the liquid compressibility, the dynamic response of the bubble gaseous phase, the phase change taking place in the vapour and the topology modification occurring during the collapse, the model of choice is a phase-field method (Anderson, McFadden & Wheeler Reference Anderson, McFadden and Wheeler1998; Jamet Reference Jamet2001; Magaletti et al. Reference Magaletti, Picano, Chinappi, Marino and Casciola2013; Hu, Wang & Gomez Reference Hu, Wang and Gomez2023) described in terms of mass density and accounting for surface tension through distributed capillary stresses, as originally introduced by van der Waals (Reference van der Waals1893, Reference van der Waals1979). The solid is basically described by the linear elasticity equations (Gurtin Reference Gurtin1982) on account of the expected small deformation of the solid. Indeed, the scope of the present paper is limited to relatively stiff materials which are hardly deformed, leaving for future investigations the case of softer materials, such as hydrogels (Guvendiren & Burdick Reference Guvendiren and Burdick2012; Liu, Toh & Ng Reference Liu, Toh and Ng2015; Drozdov & de Claville Christiansen Reference Drozdov and de Claville Christiansen2018) or tissues and cell membranes (Bottacchiari et al. Reference Bottacchiari, Gallo, Bussoletti and Casciola2022). As we show, despite the relatively large stiffness leading to small deformations, the state of tension undergone by the solid under the pressure field of the collapsing bubble is rather large and may easily exceed the yield stress of many materials (Abbondanza, Gallo & Casciola Reference Abbondanza, Gallo and Casciola2023a).
At variance with most applications of elastoplastic materials in structural engineering, the load exerted on the solid is highly non-stationary, inducing a complex response where elastic wave propagation is combined with unsteady plastic deformation (Von Kármán & Duwez Reference Von Kármán and Duwez1950). Moreover, due to the presence of the fluid–solid interface subject to the bubble pressure load propagating at a fast speed, the system of elastic waves turns out to be rather rich. As is well known, linear elastic solids support the propagation of two substantially different kinds of (bulk) waves: longitudinal, or compression, waves, travelling at the speed  $c_{L} = \sqrt {(K+4/3G)/\rho _s}$, where
 $K$ and
 $G$ are the bulk and the shear moduli, respectively, with
 $\rho _s$ the solid mass density; and transversal, or shear, waves with speed
 $c_{T} = \sqrt {G/\rho _s}$ (Graff Reference Graff2012). In load-free conditions, the interface propagates additional waves, confined to a narrow surface layer, studied by Lord Rayleigh (Reference Rayleigh1885) and Love (Reference Love1911), respectively. These two kinds of waves have two orthogonal polarisations, with the Rayleigh waves oscillating in the plane formed by the propagation direction (parallel to the undeformed surface) and the normal to the surface, whereas Love waves are shear waves oscillating along the surface and orthogonal to the propagation direction. An axisymmetric bubble collapse cannot induce Love waves and among the two possible polarisations of the (bulk) transverse waves, only the one oscillating in the axial plane is allowed.
The moving load adds even more features to the whole picture. Let us consider, for the sake of definiteness, the effect on the solid of a strong compression wave in the liquid on top of the liquid–solid interface. Such a wave will emanate radially from the region of bubble collapse, such that, under axisymmetry, its trace on the liquid–solid interface consists of an expanding circumference centred at the bubble's centre projection onto the surface. Being the fastest signal travelling in the liquid, outside this circumference the load applied to the solid vanishes altogether. Different cases may arise, depending on the relative speed of the liquid compression (load) wave and the longitudinal and the transverse elastic waves (also the additional parameter given by the speed of the Rayleigh wave should be taken into account, which is however very close to  $c_{T}$). Without entering into detail here, the interaction of the loading wave with the surface produces an elastic wave locked to external disturbance. Moreover, the interaction of the longitudinal elastic (bulk) wave with the liquid–solid surface generates a further wavefront, the so-called head, or von Schmidt, wave (Von Schmidt Reference Von Schmidt1938). As we show, the amplitude of this interacting system of wavefronts is eventually modulated by the energy dissipation due to the plasticisation of the material taking place where the stress overcomes the material strength. Plasticity is a realm in itself. Here we stick to one of the most popular models, the so-called rate-independent classical plasticity model (Lubliner Reference Lubliner2008).
The outline of the paper is as follows. Section 2 discusses the fluid–structure interaction and the approximation derived under the assumption of a stiff solid. Section 3 summarises the diffuse interface model, introducing the capillary distributed stress that complements the standard Navier–Stokes equations (mass, momentum and energy conservation) and illustrates the equation of state to account for the phase change. Section 4, for the convenience of unfamiliar readers, provides an account of the basic concepts of plasticity theory and elastoplastic waves. Section 5 presents a short description of the numerical methods adopted in the simulations. The main results concerning the dynamics of the collapsing bubble are reported in § 6 whereas the solid wall and related elastoplastic waves are addressed in § 7. Finally, conclusions are drawn in § 8 together with a discussion of perspectives and future research directions.
2. Fluid–solid interaction
The solid response to a bubble collapse is a typical example of fluid–structure interaction. Due to the nature of the solid material, it possesses certain peculiarities which are worth exploiting in the simulation. In fact, fluid and solid are coupled through the boundary conditions at the interface  $\mathcal {I}$ which, assuming no overhangs, is described by the equation
 $z = h(x,y,t)$, where
 $x$,
 $y$ and
 $z$ are the three Cartesian coordinates of a point
 $\boldsymbol {x}$, with
 $z = 0$ the undeformed (planar) interface.
The fluid occupies the domain  $\varOmega _f = \{\boldsymbol {x} \in \mathbb {R}^3: z > h(x,y) \}$, whereas the solid is confined to the complementary region
 $\varOmega _s = \{\boldsymbol {x} \in \mathbb {R}^3: z < h(x,y) \}$. The fluid is described in terms of the mass density
 $\rho (\boldsymbol {x},t)$, the velocity
 $\boldsymbol {u}(\boldsymbol {x},t)$ and the energy density
 $E(\boldsymbol {x},t)$ fields which obey the fundamental conservation laws.
The solid is described by the density field  $\rho _s(\boldsymbol {X},t)$, the displacement field
 $\boldsymbol {r}(\boldsymbol {X},t)$ and the energy density. Under isothermal conditions, the energy evolution is ignored in favour of the constant temperature assumption, thus rendering the Helmholtz free energy density
 $\hat f_{S}$ the thermodynamic potential of choice. Here,
 $\boldsymbol {X}$ is the Lagrangian coordinate providing the initial position of the solid continuum points such that
 $\boldsymbol {x} = \boldsymbol {X}+\boldsymbol {r}$. As is well known (Gurtin Reference Gurtin1982),
 $\rho _s(\boldsymbol {X},t) = \rho _0(\boldsymbol {X} )$, while the displacement field obeys momentum conservation.
Apart from the initial state, the equations require boundary conditions that can be specified in terms of the fields or their (generalised) normal derivatives (i.e. traction vector and heat flux) at the boundary. In the present case, the domains change in time (free-boundary problem), and one should require the continuity of displacements and normal derivatives. This information is sufficient to determine the fields at the current time, in particular the velocity  $\boldsymbol {u}_{\mathcal {I}} = {\dot {\boldsymbol {r}}}_{\mathcal {I}}$ which allows the interface to be updated according to the equation
 $h_t = {\dot z} - ( {\dot x} h_x + {\dot y} h_y )$.
The specificity of the current problem is that the solid is stiff, meaning that its deformation (hence, also the interface displacement) is small under a finite intensity load,  $|\boldsymbol {r} | = O(\epsilon ) \ll 1$, where
 $\epsilon$ is a small parameter. In the simulations described in the following, this condition is accomplished by having a solid-to-liquid impedance ratio
 $Z_s/Z_l>10.5$, such that the solid–liquid interface can be considered rigid. This assumption allows linearising the entire system of equations with respect to the solid displacement while keeping finite all the other relevant quantities, in particular, the fluid velocity
 $\boldsymbol {u}$ and the stress distribution in the solid.
Linearisation of the solid's equations requires the stress tensor to be linearised with respect to the displacement field. Nevertheless, also in its linearised form, the stress in the solid is still large, implying that the material may yield under the load. The final result is a linear elastic model with plasticity occurring where the yield strength of the material is locally exceeded.
We stress that, from the point of view of the fluid, the system at order zero in  $\epsilon$ still retains its original nonlinearity. To this order, the interface is flat and the no-slip condition applies in the form
 $\boldsymbol {u}_{\mathcal {I}} = 0$. In other words, the fluid motion decouples from the solid. As a consequence, the solid occupies its undeformed domain and experiences the load exerted by the fluid. Clearly, the solid displacement dictates the deformation of the interface. In principle, one may want to carry over this procedure to evaluate the effect on the fluid of the order one interface displacement. Although doable, this would be uninfluential if the first-order solution for the solid is sufficient.
3. Diffuse interface model of a cavitation bubble
The dynamics of a cavitation bubble close to a solid surface is described by a diffuse interface model (Jamet et al. Reference Jamet, Lebaigue, Coutris and Delhaye2001; Magaletti et al. Reference Magaletti, Marino and Casciola2015) which, overall, involves the familiar mass, momentum and energy conservation equations,
 $$\begin{gather} \frac{\partial \rho}{\partial t}+\boldsymbol{\nabla}\boldsymbol{\cdot}(\rho\boldsymbol{u})=0, \end{gather}$$
 $$\begin{gather}\frac{\partial \rho\boldsymbol{u}}{\partial t}+\boldsymbol{\nabla}\boldsymbol{\cdot}(\rho\boldsymbol{u}\otimes\boldsymbol{u}) =\boldsymbol{\nabla}\boldsymbol{\cdot} \boldsymbol{T}, \end{gather}$$
 $$\begin{gather}\frac{\partial E}{\partial t}+\boldsymbol{\nabla}\boldsymbol{\cdot}(E\boldsymbol{u})=\boldsymbol{\nabla}\boldsymbol{\cdot} (\boldsymbol{T}\boldsymbol{\cdot}\boldsymbol{u})-\boldsymbol{\nabla}\boldsymbol{\cdot} \boldsymbol{q}_f, \end{gather}$$
with  $\boldsymbol {T}(\boldsymbol {x},t)$ the stress tensor and
 $\boldsymbol {q}_f(\boldsymbol {x},t)$ the energy flux. The specificity comes from the constitutive equations (Magaletti et al. Reference Magaletti, Gallo, Marino and Casciola2016),
 \begin{gather}
\boldsymbol{T}={-}\left(p_0-\frac{\lambda}{2}|\boldsymbol{\nabla}\rho|^2
-\rho\boldsymbol{\nabla}\boldsymbol{\cdot}(\lambda\boldsymbol{\nabla}\rho)\right)
\boldsymbol{I}\nonumber\\
-\lambda\boldsymbol{\nabla}\rho\otimes\boldsymbol{\nabla}\rho+\eta(\boldsymbol{\nabla}\boldsymbol{u}
+(\boldsymbol{\nabla}\boldsymbol{u})^{\rm
T})-\tilde{\eta}(\boldsymbol{\nabla}\boldsymbol{\cdot}
\boldsymbol{u})\boldsymbol{I},
\end{gather}
 \begin{gather}
\boldsymbol{q}_f=\lambda\rho\boldsymbol{\nabla}\rho\boldsymbol{\nabla}\boldsymbol{\cdot}
\boldsymbol{u}-k\boldsymbol{\nabla}\theta,
\end{gather}
which, aside from classical effects described by Newton's law of viscosity and Fourier's law of heat conduction, accounts for distributed capillary terms depending on the density gradient. Moreover, a suitable pressure field is derived from an equation of state able to describe the thermodynamics of the fluid in the liquid, vapour and supercritical states that all occur during bubble implosion. In the above equations, the capillary coefficient  $\lambda (\theta )$ is a function of the temperature
 $\theta$,
 $\eta$ is the first dynamic viscosity coefficient,
 $\tilde {\eta }$ (often taken to be
 $\tilde {\eta }=-2/3\eta$) is the second dynamic viscosity coefficient and
 $k$ is the thermal conductivity.
Importantly, this system describes the transition from the high-density liquid to the low-density vapour, together with the change of the other thermodynamic and kinetic properties of the fluid. In the case of a vapour bubble in a liquid bulk, the fluid properties switch smoothly across a thin interfacial layer, a distributed form of liquid–vapour interface as originally envisaged by van der Waals (Reference van der Waals1893). Its thickness is determined by the fluid thermodynamics,
 \begin{equation} \ell_{lv} = (\rho_l-\rho_v)\sqrt{\frac{\lambda/2}{{w}_0(\bar{\rho})- {w}_0(\rho_v)}} , \end{equation}
where  ${\bar \rho }$ is the fluid density where the density gradient is maximal,
 $|{\rm d} \rho /{\rm d}{\kern0.8pt}x|_{max} = \sqrt {2(w_0({\bar \rho }) - w_0(\rho _v))/\lambda }$, and it is the seat of the strong density gradients that sum up to the (equilibrium) surface tension
 \begin{equation} \sigma = \int_{-\infty}^{+\infty}\lambda\left(\frac{{\rm d}\rho}{{\rm d}{\kern0.8pt}x}\right)^2{\rm d}{\kern0.8pt}x = \int_{\rho_v}^{\rho_l}\sqrt{2\lambda ({w}_0(\rho) - {w}_0(\rho_v))}\,{\rm d}\rho, \end{equation}
where  ${w}_0 = {f}_f^b - \rho \mu ^b_f$, with
 ${f}_f^b$ the fluid (bulk) Helmholtz free energy per unit volume and
 $\mu ^b_f = \partial {f}_f^b/\partial \rho$ the chemical potential, which under equilibrium (saturation) conditions is a function of the only temperature (
 $\mu ^b_f = {\mu ^b_f}_{eq}$).
The system of equations (3.1), complemented with the constitutive relations (3.2)–(3.3), is closed by prescribing the appropriate thermodynamics potential that holds across the liquid–vapour transition. Here the van der Waals equation of state for the Helmholtz free energy is assumed,  $f_f^b/p_c = -8/3 \rho _R \theta _R \{1 + \ln [(1 - \rho _R/3 )/(\rho _c \rho _R\varLambda ^3/m_p) ] \} - 3 \rho _R^2$, with the subscript
 $R$ denoting reduced quantities (e.g.
 $\rho _R = \rho /\rho _c$),
 $\varLambda = \sqrt {2\pi \hbar ^2/(m_p k_b \theta )}$ denoting the De Broglie thermal wavelength,
 $m_p$ denoting the atom mass and the subscript
 $c$ denoting the critical state. Hence, the pressure is
 \begin{equation} \frac{p_0}{p_c}= \frac{\rho^2}{p_c} \frac{\partial (f_f^b/\rho)}{\partial \rho} = \frac{8\rho}{3\rho_c-\rho}\frac{\theta}{\theta_c}-3\left(\frac{\rho}{\rho_c}\right)^2. \end{equation}
Most of the boundary conditions are standard: in the present case, as discussed in § 2, no-slip and impermeability conditions and constant temperature hold on the flat solid wall. A little more information is needed concerning capillarity, which should account for the solid wettability and requires explicitly calling into play the Helmholtz free energy functional for a stratified fluid, which reads
 \begin{equation} F[\rho, \theta] = \int_{\varOmega_f} [f_f^b (\rho, \theta ) + \lambda/2 |\boldsymbol{\nabla}\rho |^2 ]\, {\rm d}V + \int_{{\mathcal{I}}} f_w (\rho, \theta )\, {\rm d}S , \end{equation}
where  $f_w (\rho, \theta ) = - \cos \varTheta \int _{\rho _v}^\rho \sqrt {2 \lambda [w_0(\rho, \theta ) - w_0(\rho _v, \theta ) ]} \,{\rm d}\rho +\gamma _{sv}$ is the solid–fluid interfacial energy, with
 $\varTheta$ Young's contact angle and
 $\gamma _{sv}$ the surface energy for vapour in contact with the solid. In the free energy functional, the square density gradient term accounts for the excess energy of the interfacial layer and ultimately is the origin of the distributed capillary stresses. Minimising the free energy with respect to the density field provides two Euler–Lagrange equations. The first is the equation for equilibrium density, replaced here by the evolution equations illustrated before, whereas the second provides the boundary condition for the mass density (Gallo et al. Reference Gallo, Magaletti and Casciola2021),
 \begin{equation} \lambda \frac{\partial \rho}{\partial n} + \frac{\partial f_w}{\partial \rho} = 0. \end{equation}
The flow is governed by three dimensionless parameters, the Cahn, Reynolds and Péclet numbers, taking the place of  $\lambda$,
 $1/\eta$ and
 $1/k$, respectively, in (3.2) and (3.3), and defined as
 \begin{equation} Cn=\sqrt{\frac{\lambda\rho_c^2}{p_cR_0^2}},\quad Re=\frac{R_0\sqrt{p_c \rho_c}}{\eta}, \quad Pe= \frac{R_0\sqrt{p_c \rho_c}}{k} , \end{equation}
with  $R_0$ the initial bubble radius.
3.1. Baroclinic vorticity production
The interface and, possibly, the strong compression waves generated by the bubble implosion, may activate the baroclinic mechanism of vorticity production. As usual, the vorticity equation follows by taking the curl of the momentum equation (B26), rewritten here explicitly
 \begin{align} \frac{\partial \rho \boldsymbol{u}}{\partial t} + \boldsymbol{\nabla}\boldsymbol{\cdot}(\rho\boldsymbol{u}\otimes\boldsymbol{u}) &={-}\boldsymbol{\nabla}\left(p_0-\frac{\lambda}{2}|\boldsymbol{\nabla}\rho|^2 -\rho\boldsymbol{\nabla}\boldsymbol{\cdot}(\lambda\boldsymbol{\nabla}\rho)\right)\nonumber\\ &\quad -\boldsymbol{\nabla}\boldsymbol{\cdot}(\lambda\boldsymbol{\nabla}\rho\otimes\boldsymbol{\nabla}\rho) +\boldsymbol{\nabla}\boldsymbol{\cdot}\boldsymbol{\varSigma}, \end{align}
where  $\boldsymbol \varSigma$ is the classical viscous part of the stress tensor. The first two terms on the right-hand side of (3.10) are manipulated to yield
 \begin{align} &-\boldsymbol{\nabla}\left(p_0-\frac{\lambda}{2}|\boldsymbol{\nabla}\rho|^2 -\rho\boldsymbol{\nabla}\boldsymbol{\cdot}(\lambda\boldsymbol{\nabla}\rho)\right) -\boldsymbol{\nabla}\boldsymbol{\cdot}(\lambda\boldsymbol{\nabla}\rho\otimes\boldsymbol{\nabla}\rho)\nonumber\\ &\quad ={-}\boldsymbol{\nabla} p_0 + \frac{1}{2}\frac{\partial \lambda}{\partial \theta}|\boldsymbol{\nabla}\rho|^2\boldsymbol{\nabla}\theta +\rho\boldsymbol{\nabla}[\boldsymbol{\nabla}\boldsymbol{\cdot}(\lambda\boldsymbol{\nabla}\rho)]. \end{align}
Expressing  $p_0$ in terms of the bulk (fluid) Helmholtz free energy
 $f_f^b(\rho,\theta )$ and chemical potential
 $\mu _f^b = \partial f_f^b/\partial \rho$ as
 $p_0 = \rho \mu _f^b - f_f^b$, its gradient takes the form
 \begin{equation} \boldsymbol{\nabla} p_0 = \rho\boldsymbol{\nabla}\mu_f^b + \mu_f^b\boldsymbol{\nabla}\rho - \frac{\partial f_f^b}{\partial \rho}\boldsymbol{\nabla}\rho - \frac{\partial f_f^b}{\partial \theta}\boldsymbol{\nabla}\theta= \rho\boldsymbol{\nabla}\mu_f^b + s_f^b\boldsymbol{\nabla}\theta, \end{equation}
where the bulk entropy density is  $s_f^b=-\partial f_f^b/\partial \theta$. Substituting (3.12) in (3.11) and back into (3.10), we get
 \begin{align} \frac{\partial \rho \boldsymbol{u}}{\partial t} + \boldsymbol{\nabla}\boldsymbol{\cdot}(\rho\boldsymbol{u}\otimes\boldsymbol{u}) &={-} \rho\boldsymbol{\nabla}[\mu_f^b - \boldsymbol{\nabla}\boldsymbol{\cdot}(\lambda\boldsymbol{\nabla}\rho)]\nonumber\\ &\quad + \left({-}s_f^b + \frac{1}{2}\frac{\partial \lambda}{\partial \theta}|\boldsymbol{\nabla}\rho|^2\right)\boldsymbol{\nabla}\theta +\boldsymbol{\nabla}\boldsymbol{\cdot}\boldsymbol{\varSigma}. \end{align}
After noting that the terms in brackets on the right-hand side can be written in terms of generalised entropy and chemical potential,
 \begin{equation} s_f ={-}\frac{\delta F}{\delta\theta} = s_f^b - \frac{1}{2}\frac{\partial \lambda}{\partial \theta}|\boldsymbol{\nabla}\rho|^2,\quad \mu_f = \frac{\delta F}{\delta\rho} = \mu_f^b - \boldsymbol{\nabla}\boldsymbol{\cdot}(\lambda\boldsymbol{\nabla}\rho), \end{equation}
where the total Helmholtz free energy of the system is  $F[\rho,\theta ]=\int _{V} [f_f^b(\rho,\theta ) +\lambda /2|\boldsymbol {\nabla }\rho |^2]\,\text {d}V$ (van der Waals Reference van der Waals1979), and exploiting mass conservation, (3.13) reads
 \begin{equation} \frac{\partial \boldsymbol{u}}{\partial t} + \boldsymbol{u}\boldsymbol{\cdot}\boldsymbol{\nabla}\boldsymbol{u}= \frac{{\rm D}\boldsymbol{u}}{{\rm D}t}={-}\boldsymbol{\nabla}\mu_f -\frac{s_f}{\rho}\boldsymbol{\nabla}\theta +\frac{1}{\rho}\boldsymbol{\nabla}\boldsymbol{\cdot}\boldsymbol{\varSigma}. \end{equation}
Applying the curl operator to (3.15), recalling that  ${\rm D}\boldsymbol {u}/{\rm D}t=\partial \boldsymbol {u}/\partial t+\boldsymbol {\nabla }(|\boldsymbol {u}|^2/2)+\boldsymbol {\zeta }\times \boldsymbol {u}$, the vorticity equation follows as
 \begin{equation} \frac{{\rm D}}{{\rm D}t}\left(\frac{\boldsymbol{\zeta}}{\rho}\right)= \left(\frac{\boldsymbol{\zeta}}{\rho}\boldsymbol{\cdot}\boldsymbol{\nabla}\right)\boldsymbol{u} -\frac{1}{\rho}\boldsymbol{\nabla}\left(\frac{s_f}{\rho}\right)\times\boldsymbol{\nabla}\theta +\frac{1}{\rho}\boldsymbol{\nabla}\times\left(\frac{1}{\rho}\boldsymbol{\nabla}\boldsymbol{\cdot} \boldsymbol{\varSigma}\right), \end{equation}
where the first term on the right-hand side describes the stretching and tilting of vorticity, and the second is a generalised baroclinic term, responsible for vorticity production. It was shown in Gallo et al. (Reference Gallo, Magaletti and Casciola2018) that a constant capillary coefficient can reproduce the temperature dependence of the surface tension for a Lennard-Jones fluid; see figure 1 for the Van der Waals case. In these conditions, the baroclinic term appearing in (B27) simplifies considerably, see § 3.1.
Surface tension  $\sigma$ vs temperature
 $\theta$ obtained from (3.5) with the Van der Waals equation of state. The capillary coefficient is kept constant corresponding to the dimensionless Cahn number
 $Cn = 1.1 \times 10^{-3}$, (3.9). In the graph,
 $p_c=22$ MPa,
 $\theta _c=647$ K and
 $R_0=10^{-6}$ m are the critical quantities and the reference radius used.

A discussion of the sharp interface limit for the vorticity equation, which recovers the well-established sharp interface formulations (Magnaudet & Mercier Reference Magnaudet and Mercier2020) (see also (Terrington, Hourigan & Thompson Reference Terrington, Hourigan and Thompson2020, Reference Terrington, Hourigan and Thompson2021, Reference Terrington, Hourigan and Thompson2022) for a detailed analysis of vorticity generation on interfaces) compared with the diffuse interface form discussed here, is provided in Appendix B.
4. Elastoplastic dynamics of the substrate
It is a common belief that elastoplastic models may look bewildering to the non-specialist (Antman & Szymczak Reference Antman and Szymczak1989). It may then be appropriate to simplify the discussion as much as possible to focus on key features. We henceforth assume that thermal effects can be neglected and we shall limit the analysis to materials with a rate-independent response. The first assumption is well-motivated given the small heat capacity of microbubbles as compared with the solid. Rate-independency, instead, is in principle questionable, due to the extremely fast time scales involved in the collapse. Nevertheless, we adopt a rate-independent model sufficiently rich to account for material hardening and to address the time-dependent elastoplastic response (Von Kármán & Duwez Reference Von Kármán and Duwez1950). In case it was required, the model, and the simulations thereof, can be readily extended in several respects to include thermal effects and rate-dependency, as we explain in Appendix A.
As discussed in § 2, for stiff materials the dynamics can be linearised with respect to the solid displacement. The formal procedure is highlighted in Appendix A which also provides a self-contained account of basic nonlinear plasticity elements. Here, as a necessary preliminary to elastoplastic wave dynamics, we begin the section with a concise summary of the equations, see Appendix A and (Antman Reference Antman2005; Lubliner Reference Lubliner2008) for further details.
Once linearised based on the assumption  $| r| = O( \epsilon )$, § 2, the solid displacement field can be expressed in the Eulerian frame as
 $\boldsymbol {r} = \boldsymbol {r}(\boldsymbol {x},t )$ which, to the required accuracy level, entails
 $\rho _{S}(\boldsymbol {x},t) = \rho _0 + O( \epsilon )$, with
 $\rho _0 = {\rm const.}$ for a homogeneous material. In the linearised theory, the (infinitesimal) strain reduces to
 \begin{equation} \boldsymbol{\epsilon} = (\nabla_{\boldsymbol{x}} \boldsymbol{r} + \nabla_{\boldsymbol{x}} \boldsymbol{r}^T)/{2} \end{equation}
and possesses the peculiar property of being additively split into plastic and elastic parts,  $\boldsymbol {\epsilon } = \boldsymbol {\epsilon }_p + \boldsymbol {\epsilon }_e$. With little surprise, the linearised momentum equation becomes
 \begin{equation} \rho_{S}\frac{\partial^2 \boldsymbol{r}}{\partial {t}^2}=\boldsymbol{\nabla}\boldsymbol{\cdot}\boldsymbol{\sigma}, \end{equation}
where  $\boldsymbol {\sigma } = \boldsymbol {C}_e : \boldsymbol {\epsilon }_e$ is the (linearised) Cauchy stress, see Appendix A and, e.g. Gurtin, Fried & Anand (Reference Gurtin, Fried and Anand2010).
We assume the material to be isotropic, implying that the stress–strain relation involving the elastic tensor  $\boldsymbol {C}_e$ is entirely characterised by the Lamé constants,
 $\lambda _{S}$ and
 $\mu _{S}$. When the material's distortional free energy density,
 $f^e_{dev} = \boldsymbol {\sigma }_{dev}: \boldsymbol {\sigma }_{dev}/(4 \mu _{S})$, is on the verge of exceeding the critical value
 $f^c_{dev} = \sigma _Y^2/(6 \mu _{S})$ that depends on the yield stress
 $\sigma _Y$, the material yields, the plastic strain accumulates and the material undergoes hardening. While all this is happening, the material will still remain in an admissible state, i.e.
 $f^e_{dev} - f^c_{dev} \le 0$. This unilateral constraint acts only under plastic loading, i.e. when the two conditions (i) distortional free energy reaching the critical level,
 $|\boldsymbol {\sigma }_{dev}| = \sqrt {2/3} \sigma _Y$, and (ii) positive distortional stress power,
 $\boldsymbol {\sigma }_{dev} : \dot {\boldsymbol {\epsilon }} > 0$, are met.
The elastic strain, needed to evaluate the stress, is known from the total strain after the evolution equation for the plastic strain,
 \begin{equation} {\dot{\boldsymbol
\epsilon}}_p =\left\{\begin{array}{@{}l@{\quad}l@{}}
\hat{\boldsymbol{\sigma}}_{dev} \otimes
\hat{\boldsymbol{\sigma}}_{dev} : {\dot{\boldsymbol
\epsilon}}/D & {\rm if} \ |\boldsymbol{\sigma}_{dev}| =
\sqrt{2/3} \sigma_Y \ {\rm and}\ \boldsymbol{\sigma}_{dev} :
\dot{\boldsymbol{\epsilon}} > 0 \\ 0 & {\rm otherwise} ,
\end{array}\right. \end{equation}
is solved, where  $\hat {\boldsymbol {\sigma }}_{dev} = \boldsymbol {\sigma }_{dev}/|\boldsymbol {\sigma }_{dev}|$,
 $D = [1 + K_{H}/(3\mu _{S} ) ]$ and the strain rate is
 $\dot {\boldsymbol {\epsilon }} = ( {\nabla _{\boldsymbol {x}} \dot {\boldsymbol {r}} + \nabla _{\boldsymbol {x}} \dot {\boldsymbol {r}}^T} )/2$. The symbol
 $\otimes$ denotes the tensor product and
 $K_{H}$ is the hardening modulus (Lubliner Reference Lubliner1972). The yield stress dictates the hardening. It is constant except under plastic loading when
 \begin{equation} {\dot \sigma}_Y = \sqrt{2/3} K_{H} | \hat{\boldsymbol{\sigma}}_{dev} : \dot{\boldsymbol{\epsilon}} | /D. \end{equation}
Strictly speaking, the system of ((4.2)–(4.4)) suffice to determine the elastoplastic evolution, once appropriate material parameters, boundary conditions on the fluid–solid interface and radiation conditions for the outward-propagating waves are prescribed. The accumulated plastic deformation,  $\alpha _p\propto \int _0^t |\dot {\boldsymbol {\epsilon }}_p | \,{\rm d}t$, is recovered from the yield stress,
 $\alpha _p = (\sigma _Y - \sigma _Y^0)/K_{H}$. The plastic dissipation differs from zero only under plastic loading where it is given by
 $\sqrt {2/3} \sigma _Y^0 |\hat {\boldsymbol {\sigma }}_{dev} : \dot {\boldsymbol {\epsilon }}|/D$.
Together with the capillary Navier–Stokes equations of § 3, this system is the basis for the simulations of the elastoplastic response to bubble collapse discussed in the forthcoming sections. Before proceeding, we take the chance to emphasise that all the relevant quantities are continuous across the plastic deformation boundary since they are linear in the distortional stress power that, together with the distortional free energy, demarcates the different regimes.
The elastoplastic dynamics is governed by the following dimensionless parameters:
 \begin{equation} c_{L}^* = c_{L}/\sqrt{p_c/\rho_c} , \quad c_{T}^* = c_{T}/\sqrt{p_c/\rho_c} , \quad \sigma_Y^{0^*} = \sigma_Y^0/\mu_{S} , \quad K_{H}^* = K_{H}/(3 \mu_{S}) , \end{equation}
where  $c_{L}=\sqrt {(\lambda _{S}+2\mu _{S})/\rho _{S}}$ and
 $c_{T}=\sqrt {\mu _{S}/\rho _{S}}$.
4.1. Elastoplastic waves
Elastoplastic waves may develop within the material as a consequence of the loading exerted on the solid wall by the collapsing bubble. Considering for the moment the purely elastic case for which  $\boldsymbol {\sigma }^e = \boldsymbol {C}_e : \boldsymbol {\epsilon }$, the Helmholtz decomposition for the displacement field
 $\boldsymbol r(\boldsymbol x, t)=\boldsymbol {\nabla }\phi +\boldsymbol {\nabla }\times \boldsymbol {A}$ (a vector in the
 $r$–
 $z$ plane by axisymmetry) decouples (4.2) into two separate equations for the scalar,
 $\phi$, and the vector potential,
 $\boldsymbol {A} = \psi \hat {\boldsymbol {e}}_z \times \hat {\boldsymbol {e}}_r$ (
 $\psi$ is the analogous of the Stokes stream function),
 $$\begin{gather} \frac{\partial^2 }{\partial {t}^2}(\nabla^2\phi)=c_{L}^2\nabla^2(\nabla^2\phi), \end{gather}$$
 $$\begin{gather}\frac{\partial^2 }{\partial {t}^2}(\nabla^2 \boldsymbol{A})=c_{T}^2\nabla^2(\nabla^2 \boldsymbol{A}), \end{gather}$$
where  $c_{L}$ and
 $c_{T}$ are identified as the longitudinal and transverse wave propagation speeds, respectively. Equations (4.6) and (4.7) are, in fact, wave equations for the divergence and (the only non-vanishing component of) the curl of the displacement field (
 $\nabla ^2\phi =\boldsymbol {\nabla }\boldsymbol {\cdot }\boldsymbol {r},\ -\nabla ^2 \boldsymbol {A}=\boldsymbol {\nabla }\times \boldsymbol {r}$). These two fields, which in isolation would describe purely longitudinal and transverse waves, respectively, interact with the wall and the moving load to generate a complex wave field (figure 2). In fact, the boundary condition on the wall,
 $$\begin{gather} \sigma_{zz}^e = \lambda_{S} \left[\frac{1}{r} \frac{\partial}{\partial r}( r r_r) + \frac{\partial r_z}{\partial z} \right] + 2 \mu_{S} \frac{\partial r_z}{\partial z} = T_{zz}(r,t), \end{gather}$$
 $$\begin{gather}\sigma_{rz}^e = \mu_{S} \left(\frac{\partial r_r}{ \partial z} + \frac{\partial r_z}{\partial r}\right) = T_{rz}(r,t), \end{gather}$$
where  $\sigma ^e_{zz}$ (
 $T_{zz}$) and
 $\sigma ^e_{rz}$ (
 $T_{rz}$) are the normal and shear components of the elastic stress
 $\boldsymbol {\sigma }^e$ (fluid stress
 $\boldsymbol {T}$, § 3), respectively, once expressed in terms of scalar and vector potential (
 $r_r = \partial \phi /\partial r - \partial \psi /\partial z$,
 $r_z = \partial \phi /\partial z + 1/r\, \partial (r \psi )/\partial r$) couple together the two fields.
A compact, axisymmetric pressure disturbance is suddenly applied at time  $t=0$ to the wall at the origin and spreads radially out. The elastic solid occupies the
 $z < 0$ half-space and the sketch concerns the case with a disturbance velocity intermediate between the faster longitudinal waves and the slower transversal waves. The disturbance (green), by moving faster than the transverse waves, gives rise to a conical wavefront (green line, D). The longitudinal waves move faster and are enveloped by their hemispherical wavefront impulsively generated at time
 $t = 0$ (blue line, L). The interaction of the longitudinal wavefront with the unloaded wall (ahead of the disturbance) causes the head wave (purple line, H). Behind the disturbance, the transversal wavefront produced at time
 $t=0$, moves slower than the disturbance and is represented by the red line (T), followed by the Rayleigh wave, just behind, which is confined to the surface layer (yellow line, R).

The sketch of figure 2 illustrates the elastic wavefronts generated by an axisymmetric compact pressure load,  $T_{zz} = f(r - v_D t)$,
 $T_{rz} = 0$, suddenly applied to the wall at time
 $t =0$ which travels radially outwards with velocity
 $v_D$ intermediate between the speed of the longitudinal and the transversal elastic waves. At
 $t=0$ longitudinal and transversal waves start being generated and are confined by hemispherical wavefronts whose configuration is depicted in the sketch at a later time
 $t$ (blue and red circles, respectively). In the meanwhile, the disturbance moves and is found at time
 $t$ somewhere between the traces on the wall of the longitudinal and transversal fronts. While the load moves, further waves are generated. Since it moves faster than the transversal wave system and slower than the longitudinal one, at variance with the latter, the former cannot be radiated ahead of the disturbance. It remains confined to a cone whose generatrix is shown by the green oblique straight line tangent to the red circle forming the angle
 $\theta _{D}=\sin ^{-1}(c_{T}/v_{D})$ with the wall. The construction is the same as supersonic small disturbance theory in gas dynamics where one would talk of a Mach cone. Meanwhile, the longitudinal waves propagate ahead, where the wall is not yet perturbed by the pressure load. However, the field associated with the longitudinal waves alone cannot satisfy the load-free boundary conditions and, through the coupling implied by (4.8a), excites the transversal field. The corresponding wave system, being longitudinal waves supersonic with respect to transversal waves, must be confined within a second cone. This is called a head (or von Schmidt) (Von Schmidt Reference Von Schmidt1938) wave and is shown by the oblique straight line in purple, which originates at the trace on the wall of the longitudinal front, is tangent to the red circle, and forms with the wall the angle
 $\theta _{H}=\sin ^{-1}(c_{T}/c_{L})$. Longitudinal and transverse systems are not the only free waves supported in this configuration. Actually, the unloaded wall sustains a third kind confined to the surface layer, the so-called Rayleigh waves. Their dispersion relationship, worked out as
 $(2-c_{R}^2/c_{T}^2)^2-4(1-c_{R}^2/c_{L}^2)^{1/2}(1-c_{R}^2/c_{T}^2)^{1/2}=0$ (Rayleigh Reference Rayleigh1885) and, for ductile metals, approximated by
 $c_{R}=0.9194 c_{T}$ (Graff Reference Graff2012), shows that the Rayleigh wave is slower than all the others and localised in the region highlighted in yellow in the sketch. Other waves that could exist in principle (namely transverse wave and Love surface wave with polarisation normal to the axial plane shown in the sketch) are ruled out by the assumed symmetry of the problem. Once the general principle is laid down, it is easy to realise what to expect depending on the relative velocity of the load with respect to characteristic elastic speeds. Three cases are identified, (i)
 $v_{D}< c_{T}$, (ii)
 $c_{L}>v_{D}>c_{T}$ and (iii)
 $v_{D}>c_{L}$, as discussed in a series of beautiful papers in the late 1960s (Gakenheimer & Miklowitz Reference Gakenheimer and Miklowitz1969; Gakenheimer Reference Gakenheimer1971); see also the book (Miklowitz Reference Miklowitz2012), where analytic function and integral transform theories are cleverly exploited.
Let us now turn our attention to the elastoplastic case. For an elastoplastic material, Appendix A, (4.6) and (4.7) take the form
 $$\begin{gather} \left( \frac{\partial^2 }{\partial {t}^2} - c_{L}^2\boldsymbol{\nabla}^2 \right)\boldsymbol{\nabla}^2\phi ={-} 2 c_{T}^2(\boldsymbol{\nabla}\otimes\boldsymbol{\nabla}):\boldsymbol{\epsilon}_p, \end{gather}$$
 $$\begin{gather}\left( \frac{\partial^2 }{\partial {t}^2} - c_{T}^2\boldsymbol{\nabla}^2 \right) \boldsymbol{\nabla}^2\boldsymbol A = 2c_{T}^2\boldsymbol{\nabla}\times(\boldsymbol{\nabla}\boldsymbol{\cdot}\boldsymbol{\epsilon}_p), \end{gather}$$
where the plastic deformation, time-dependent in general,  $\boldsymbol {\epsilon }_p(\boldsymbol {x},t)$, follows by solving (4.3), where the strain rate in terms of the time derivative of the potentials is
 $\dot {\boldsymbol {\epsilon }} = \boldsymbol {\nabla } \otimes \boldsymbol {\nabla }{\dot \phi } + [ {\boldsymbol {\nabla } \otimes ( \boldsymbol {\nabla } \times \dot {\boldsymbol {A}}) + \boldsymbol {\nabla } \otimes (\boldsymbol {\nabla } \times \dot {\boldsymbol {A}})^{\rm T}}]/{2}$, with
 ${\dot \phi }$ and
 $\dot {\boldsymbol {A}}$ the corresponding velocity potentials,
 ${\boldsymbol v} = {\dot {\boldsymbol r}} = \boldsymbol {\nabla } {\dot \phi } + \boldsymbol {\nabla } \times \dot {\boldsymbol {A}}$. Equations (4.9), (4.10) involve wave operators on the left-hand side and memory terms on the right-hand side which come from the time-integration of (4.3). Note that the right-hand side of (4.3) is nonlinear in the fields, given the dependency of
 ${\boldsymbol \sigma }_{dev}$ on the solution.
To qualitatively describe the rich phenomenology implied by the elastoplastic model, we may consider two limiting conditions, one concerning a system remaining in the elastic range,  $\dot {\boldsymbol {\epsilon }}_p = 0$, with preexistent plastic deformation, the other a system undergoing plastic loading,
 $\dot {\boldsymbol {\epsilon }}_p \ne 0$. In the first case, the plastic strain is time-independent,
 ${\boldsymbol \epsilon }_p({\boldsymbol x})$, and the potentials can be split into time-independent and transient components,
 $\phi = \phi ^p({\boldsymbol x}) + \phi _{w}^e({\boldsymbol x},t)$,
 ${\boldsymbol A} = {\boldsymbol A}^p({\boldsymbol x}) + {\boldsymbol A}^e_w({\boldsymbol x},t)$, where the equations
 $$\begin{gather} c_{L}^2\boldsymbol{\nabla}^4 \phi^p = 2 c_{T}^2(\boldsymbol{\nabla}\otimes\boldsymbol{\nabla}):\boldsymbol{\epsilon}_p, \end{gather}$$
 $$\begin{gather}c_{T}^2\boldsymbol{\nabla}^4 {\boldsymbol A}^p ={-} 2c_{T}^2\boldsymbol{\nabla}\times(\boldsymbol{\nabla}\boldsymbol{\cdot}\boldsymbol{\epsilon}_p), \end{gather}$$
completed with load-free boundary conditions account for the deformation induced in the solid by the preexistent plastic region with the residual stress given by  $\boldsymbol {\sigma }_{R} = \boldsymbol {C}^e :({\boldsymbol \epsilon - \boldsymbol {\epsilon }_p})$. The transient contributions,
 $\phi ^e_w$,
 ${\boldsymbol A}^e_w$, obey the very same equations and boundary conditions of the previously considered purely elastic case, implying that the wave propagation is not altered.
The second case can be addressed in the same spirit, after assuming, for the purpose of the present analysis, the plastic strain field  ${\boldsymbol \epsilon }_p({\boldsymbol x},t)$ to be known. Now the splittings read
 $\phi =\phi ^p({\boldsymbol x},t) + \phi ^e_w({\boldsymbol x},t)$ and
 ${\boldsymbol A} ={\boldsymbol A}^p({\boldsymbol x},t) + {\boldsymbol A}^e_w({\boldsymbol x},t)$, where the elastic wave components behave as before and take care of the load at the interface, whereas the potentials
 $\phi ^p$ and
 ${\boldsymbol A}^p$ obey the forced wave equations
 $$\begin{gather} \left( \frac{\partial^2 }{\partial {t}^2} - c_{L}^2\boldsymbol{\nabla}^2 \right) \boldsymbol{\nabla}^2 \phi^p ={-} 2 c_{T}^2(\boldsymbol{\nabla}\otimes\boldsymbol{\nabla}):\boldsymbol{\epsilon}_p, \end{gather}$$
 $$\begin{gather}\left( \frac{\partial^2 }{\partial {t}^2} - c_{T}^2\boldsymbol{\nabla}^2 \right) \boldsymbol{\nabla}^2 {\boldsymbol A}^p = 2c_{T}^2\boldsymbol{\nabla}\times(\boldsymbol{\nabla}\boldsymbol{\cdot}\boldsymbol{\epsilon}_p), \end{gather}$$
with load-free boundary conditions. The nature of the solutions to the above equations depends on the behaviour of the plastic strain field. In fact, it is known that, under suitable conditions, elastoplastic waves can develop (Antman & Szymczak Reference Antman and Szymczak1989; Lubliner Reference Lubliner2008). In this case, the potentials inherit the propagative nature of the plastic strain field plus a system of purely elastic waves. Combining the partial solutions together, we arrive at a displacement field that possesses wave characteristics, in part purely elastic and in part associated with the envisaged elastoplastic propagation.
5. Numerical methods
The Navier–Stokes equations with capillarity (3.1) with constitutive equations (3.2), (3.3), and the elastoplasticity equations (4.2), (4.3) are solved adopting the finite-element method, implemented using the deal.II library (Arndt et al. Reference Arndt2023).
Concerning the fluid, an auxiliary field  $g=\nabla ^2\rho$ is added to take into account higher-order derivatives in the stress tensor (3.2). Piecewise linear shape functions have been selected for the spatial discretisation, and the fluid domain
 $\varOmega _f$ is subdivided in two regions with different spatial resolution. A finer grid is adopted around the bubble initial position and in proximity to the wall, extending radially to follow the propagation of the shock wave at the wall, whereas a coarser grid is used far from the bubble. The grid size in the former region is
 $\varDelta =20R_0/2^{11}$, with
 $R_0$ the initial bubble radius (
 $20R_0$ being the domain extension in both directions), whereas in the latter the grid size is
 $\varDelta =20R_0/2^{6}$. To properly resolve the gradients at the interface, at the shock wave fronts, and near the solid wall an automatic grid refinement based on the Kelly error estimator (Kelly et al. Reference Kelly, De SR Gago, Zienkiewicz and Babuska1983; Ainsworth & Oden Reference Ainsworth and Oden2011) is employed, using the density gradients as indicator and setting the minimum allowed grid size to
 $\varDelta =20R_0/2^{15}$. For time discretisation, the second-order Crank–Nicolson scheme is adopted, with timestep
 $\Delta t$ in the range
 $10^{-5}$–
 $10^{-3}\,t_{ref}$, depending on the collapse dynamics. System nonlinearities are treated with a Newton–Raphson iterative method.
Regarding the elastoplastic solid, the domain  $\varOmega _s$ (here the extension is reduced to
 $10R_0$ in both directions, exploiting an absorbing layer to prevent spurious reflections, to focus on the local wave structure) is discretised with a uniform grid with grid size
 $\varDelta =10R_0/2^{11}$. The second-order Newmark-beta method (Newmark Reference Newmark1959) is used for time discretisation with parameters
 $\beta =0.49$ and
 $\gamma =0.9$, and timestep
 $\Delta t\leq 0.9\varDelta /\max (c_{L},v_{D})$, with
 $c_{L}$ and
 $v_{D}$ the longitudinal waves speed and the distrurbance speed at the wall, respectively. The nonlinearities arising due to plasticity effects are treated with the Newton–Raphson iterative method, and the local plastic equilibrium is ensured with a classical return mapping algorithm (Simo & Taylor Reference Simo and Taylor1985; Simo & Hughes Reference Simo and Hughes2006). As anticipated, viscous layers are used to dampen outward-propagating waves and avoid spurious reflections at the artificial boundaries.
The code was validated against finite-difference codes already used in a previous work (Magaletti et al. Reference Magaletti, Gallo, Marino and Casciola2016), and a convergence analysis has been carried out to ensure the results are grid-independent, by increasing the maximum resolution of the fluid grid in the interfacial region setting  $\varDelta =20R_0/2^{16}$.
Additional details regarding the numerical methods are provided in the see supplementary material available at https://doi.org/10.1017/jfm.2024.925.
6. Bubble dynamics
In experiments on single bubbles, the bubble is usually generated by a spark or laser (Lauterborn & Bolle Reference Lauterborn and Bolle1975; Sinibaldi et al. Reference Sinibaldi, Occhicone, Alves Pereira, Caprini, Marino, Michelotti and Casciola2019), that is, it is formed due to intense electric fields that induce the dielectrics breakdown in the form of hot plasma. This leads to the localised vaporisation of the water and ultimately initiates the bubble. After its formation, the bubble expands up to a maximum radius, collapses back, rebounds and is finally reabsorbed. Although the energy deposition process can be simulated (Abbondanza, Gallo & Casciola Reference Abbondanza, Gallo and Casciola2023b), the cases analysed here consider instead a preexisting bubble of a given radius and let it collapse as a result of an overpressure in the liquid.
6.1. Simulation set-up
All the simulations are performed using cylindrical coordinates  $r$,
 $\theta$ and
 $z$, in the truncated domain
 $\varOmega _f=[0,\,R] \times [0, 2 \pi ]\times [0,\,H]$, assuming axisymmetry. On the solid wall, located at
 $z = 0$, the boundary conditions prescribe
 \begin{equation} \boldsymbol{u}=0 , \quad \boldsymbol{q}_f\boldsymbol{\cdot}\hat{\boldsymbol{e}}_z=0 , \quad - \lambda \frac{\partial \rho}{\partial z} + \frac{\partial f_{w}}{\partial \rho} = 0 \quad\text{on}\ z =0 , \end{equation}
with  $-\hat {\boldsymbol {e}}_z$ the outward normal at the adiabatic wall, where no-slip is assumed and the last equation determines the contact angle (3.8). The remaining part of the domain boundary is assumed sufficiently far from the bubble to allow the boundary conditions,
 \begin{equation} \boldsymbol{u}=0 , \quad \boldsymbol{q}_f\boldsymbol{\cdot}\hat{\boldsymbol{n}}=0 , \quad \frac{\partial \rho}{\partial n} = 0 \quad\text{on}\ z = H \ {\rm or} \ r = R. \end{equation}
The initial conditions are
 $$\begin{gather} \rho(r,z,0)=\rho_v^{eq}+\frac{1}{2}\left(1+\tanh\left(\frac{\sqrt{r^2+(z-Z_c)^2}-R_0}{\ell}\right) (\rho_l-\rho_v^{eq})\right), \end{gather}$$
 $$\begin{gather}\boldsymbol{u}(r,z,0)=\boldsymbol{0}, \end{gather}$$
 $$\begin{gather}\theta(r,z,0)=\theta_0, \end{gather}$$
with  $\rho _v^{eq}$ and
 $\rho _l$ the initial vapour and liquid density, respectively. The initial condition describes a still vapour bubble of radius
 $R_0$, at the external liquid temperature
 $\theta _0$, with the centre on the symmetry axis and standoff distance
 $Z_c$ with respect to the wall, see the sketch in figure 3(a). Here
 $\ell \simeq \ell _{LV}$, (3.4), is the initial width of the liquid–vapour interface. As is well known (Debenedetti Reference Debenedetti2021), a bubble in an unbound domain cannot exist in a stable equilibrium state. In fact, the thermal, mechanical and chemical equilibria,
 \begin{equation} \theta=\theta_0,\quad p_v^{eq}(\rho_v^{eq},\theta_0)-p_l^{eq}(\rho_l^{eq},\theta_0)=\frac{2\sigma}{R_0},\quad \mu_f^b(\rho_l^{eq},\theta_0)=\mu_f^b(\rho_v^{eq},\theta_0) , \end{equation}
lead to a critical bubble that would either spontaneously shrink (be reabsorbed into the liquid) or expand. Starting from the unstable state described by (6.6), the increase of the liquid density to  $\rho _l > \rho _l^{eq}$ invariably leads to collapse of the bubble.
(a) Initial two-dimensional cylindrical configuration in the fluid domain. The bubble is initially located on the axis, at height  $Z_c$. The pressure in the liquid is
 $p_{L}$, whereas the pressure in the bubble is
 $p_{V}$. (b) Initial overpressure conditions in the liquid represented on a normalised
 $p$–
 $\rho$ plane, with the corresponding van der Waals equation of state at the initial temperature of the system. Colours correspond to the three different conditions explored, increasing overpressure from red to blue. The saturation pressure, very similar to the equilibrium pressure in these conditions, is represented with a dashed line. Here
 $p_c=22$ MPa and
 $\rho _c=322$ kg m
 $^{-3}$ are the critical pressure and density.

Figure 4 shows the equilibrium liquid pressure at temperature  $\theta _0$ as a function of the bubble radius. It is substantially independent of the bubble size as soon as the bubble radius is 10
 $\mathrm {\mu }$m or larger. According to the Rayleigh–Plesset dynamics (Brennen Reference Brennen2014), in free space, the collapse time of a vapour bubble of radius
 $R_0$ is approximately given by
 \begin{equation} T_c(R_0) = R_0 \sqrt{\frac{3 \rho_l}{2 (p_l - p_v^{eq})}} \int_{0}^1 {\rm d}{\kern0.8pt}x \sqrt{\frac{x^3}{1 - x^3 + \alpha (1-x^2)}}, \end{equation}
where  $x = R/R_0$,
 $\alpha (R_0) = 3 \sigma /[R_0(p_l - p_v^{eq})]$,
 $p_l = p_l^{eq}(1 + \beta )$ and
 $\rho _l = \rho _l(\theta _0,p_l)$, with
 $\beta = (p_l-p_l^{eq})/p_l^{eq}$ the overpressure parameter quantifying the liquid pressure increase over the equilibrium value given by (6.6). The approximation consists of assuming that the liquid state, that is pressure and density, is not affected by the bubble collapse and the vapour pressure remains at the equilibrium value. It is worth stressing that the above prediction accounts for the presence of surface tension which becomes significant for microbubbles. From the collapse time, one may define a typical collapse speed,
 $V_c = R_0/T_c$ that is also found to be substantially independent of the bubble radius above
 $R_0 = 10$
 $\mathrm {\mu }$m (figure 4). With respect to this, one may assume 10
 $\mathrm {\mu }$m as the size below which the vapour cavity can be considered a microbubble.
(a) Equilibrium liquid pressure,  $p_{l}^{eq}$, blue symbols, vs initial bubble radius
 $R_0$. Inset: bubble collapse velocity
 $V_c$ vs
 $R_0$ for different overpressure parameter
 $\beta$ and two values of the standoff distance parameter (
 $s = 1.2$ and
 $1.5$, solid and dashed lines, respectively). (b) Collapse time (left axis) and collapse velocity (right axis) vs
 $\beta$ for two standoff distances, for the case with
 $R_0=1$
 $\mathrm {\mu }$m. The (partially superimposed in twos) symbols denote the conditions for the six simulations analysed in the following. The corresponding collapse times for
 $s = 1.2$ are
 $T_c^W/t_{ref} = 2.17$, 1.77 and 1.53 for
 $\beta = 28.5$, 42.8 and 58.0, respectively. The three figures change to
 $T_c^W/t_{ref} = 2.10$, 1.72 and 1.48 for
 $s = 1.5$.

For future convenience, we anticipate that the collapse time for a bubble close to a solid surface may be obtained by multiplying (6.7) by the factor  $1 + 0.205/s$,
 $T_c^w(R_0,s) = T_c(R_0) (1 + 0.205/s)$ where
 $s=Z_c/R_0$ (Rattray Reference Rattray1951; Plesset & Chapman Reference Plesset and Chapman1971).
Dealing with microbubbles, in the simulations, the initial radius and equilibrium temperature are set to  $R_0= 1\ \mathrm {\mu }\text {m}$ and
 $\theta _0=0.5\,\theta _c$, whereas the equilibrium densities follow from (6.6) which, for a van der Waals fluid (3.6), provide
 $\rho _v^{eq}\approx \rho _v^{sat}=0.022\,\rho _c$ and
 $\rho _l^{eq}=2.458\rho _c$. For such a bubble, the vapour is practically at saturation conditions, whereas the liquid is slightly metastable. Six configurations were examined with
 $Re=83.5$,
 $Cn=1.1 \times 10^{-3}$ and
 $Pe=14.9$ at changing the overpressure,
 $\beta \approx 28.5$, 42.8 and 58.0, and the standoff distance
 $s =1.2$ and 1.5; see figure 3(b).
In the following, all quantities are made dimensionless with respect to the reference values  $\theta _c=647$ K,
 $p_c=22$ MPa,
 $\rho _c=322$ kg m
 $^{-3}$,
 $v_{ref}=\sqrt {{p_c}/{\rho _c}}$ m s
 $^{-1}$ and
 $t_{ref}={R_0}/{v_{ref}}$ s.
6.2. Bubble topology, liquid jet and shock waves
It is known that although a bubble in free space could, in principle, keep the spherical symmetry while shrinking, strong instabilities arise that prevent achieving perfectly symmetric collapse (Brenner, Hilgenfeldt & Lohse Reference Brenner, Hilgenfeldt and Lohse2002). In fact, the solid wall breaks the spherical symmetry from the collapse outset, leading to a fast liquid jet that pierces the bubble, as confirmed by several experimental and numerical works (Lauterborn & Bolle Reference Lauterborn and Bolle1975; Johnsen & Colonius Reference Johnsen and Colonius2009; Magaletti et al. Reference Magaletti, Gallo, Marino and Casciola2016; Zeng et al. Reference Zeng, Gonzalez-Avila, Dijkink, Koukouvinis, Gavaises and Ohl2018; Lechner et al. Reference Lechner, Lauterborn, Koch and Mettin2020; Saade, Lohse & Fuster Reference Saade, Lohse and Fuster2023), and produces the rearrangement from spherical to toroidal topology; see figures 5 and 6 where the bubble shape is conventionally identified by the critical density isocontour. As discussed later, during the collapse, the fluid locally overcomes the critical temperature, whereas the density progressively becomes supercritical. The two simulations at different standoff distance confirm (Philipp & Lauterborn Reference Philipp and Lauterborn1998) that this parameter strongly influences the collapse. Indeed, the topology change, which is hardly achieved for  $s= 1.5$, see figure 6(a), is apparent in figure 5(a) for
 $s= 1.2$.
(a) Bubble topology during the collapse ( $\beta =42.8$,
 $s=1.2$). Snapshots are taken at different times, and the solid line is the critical density isocontour. (b) Early bubble deformation stage modelled by potential flow theory and method of images.

Bubble topology evolution ( $\beta =42.8$,
 $s=1.5$) and early bubble deformation stage modelled by potential flow theory and method of images, as in figure 5.

During the early stages of the collapse, while shrinking, the bubble becomes egg-shaped. As shown in figures 5(b) and 6(b), this behaviour is largely explained by the blockage effect of the wall that, in essence, can be described using potential flow theory combined with the method of images (Plesset & Chapman Reference Plesset and Chapman1971). The evolution of bubble volume, as identified by the critical density contour, is reported in figure 7 which shows that the first collapse time almost perfectly coincides with the estimate  $T_c^w$.
Bubble volume vs time for different overpressure  $\beta$ and standoff distance
 $s$ (solid and dashed lines correspond to
 $s = 1.2$ and
 $1.5$, respectively).

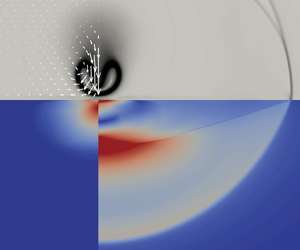
Figure 8 illustrates the events occurring during the early collapse stage and reports density and temperature isocontours with superimposed velocity field (arrows) and the critical density and temperature isolevels (solid lines). The process is initiated by the asymmetric velocity distribution generated by the blockage of the solid wall that leads to faster speed on the bubble distal part. The temperature progressively increases until, in figure 8(c), the vapour becomes supercritical, hence incondensable, in the bubble core. Due to the velocity difference between the distal and proximal parts of the bubble, the bubble overall translates toward the wall. It turns out that in the reference frame of the bubble centre-of-figure, the relative velocity compressing the bubble is larger on the sides than on the top and bottom. As a consequence, while the bubble shrinks, its overall shape is turned from an initial sphere into an ovoid with the major axis normal to the wall.
Early stages of the bubble collapse. Density and temperature are depicted as coloured isocontour lines in the left and right half of each panel, respectively,  $t/T_c^w =0$, 0.59 and 0.79 for panels (a), (b) and (c), respectively. The velocity field is shown by the vectors. The solid line in panel (c) is the critical temperature isoline, and the fields are expressed dimensionless with respect to the critical values
 $\rho _c=322$ kg m
 $^{-3}$ and
 $\theta _c=647$ K.

Figure 9 displays the pseudo-Schlieren field (the exponential of the density gradient magnitude that is the better-suited observable to identify the bubble boundary) at a sequence of selected instants along the collapse process for the case with  $\beta =58.0$ and
 $s=1.2$. Note that the time intervals between frames are not equispaced, with a much smaller time interval in the region between the end of the first collapse and the beginning of the first rebound where the bubble volume plateaus to zero in a small time interval around
 $t/T^w_c = 1$, hardly visible on the scale of figure 7. During the first phase, left column, the bubble volume shrinks, and a compression wave propagates inside the bubble towards the wall. The wavefront separates the bubble interior into two parts, with the lower part relatively still (
 $t/T_c^w=0.93$). Noticeably, the volume enclosed by the critical density isocontour shrinks much faster than the region enveloped by the sharp density gradients that in fact represent the boundary demarcating the region of lower density, inside, from the higher density, outside. This difference should be kept in mind while interpreting the result on the bubble volume. While the wave propagates, it starts interacting with the exterior fluid through the density interface (
 $t/T_c^w=0.95$). In fact, the pressure wave propagating in the bubble interior is refracted at the density interface exciting the exterior wave and the wave reflected towards the interior; see e.g. Henderson (Reference Henderson1989) for a related case of shock wave refraction across a sharp density interface and Ranjan, Oakley & Bonazza (Reference Ranjan, Oakley and Bonazza2011) for a comprehensive analysis on shock–bubble interactions. The vectors clearly indicate that all the configurations in the left column of the figure correspond to liquid moving towards the bubble, consistently with an implosive phase of the dynamics.
Collapse of a vapour bubble near a solid wall,  $\beta = 58.0$,
 $s = 1.2$. Schlieren-like representation of the density gradients with the superimposed velocity field. The red solid line is the density iso-contour
 $\rho = \rho _c$ used to evaluate the bubble volume in figure 7.

The series of events taking place when the incident wave reaches the bottom of the bubble is provided in detail in figure 10, for the same case with  $\beta =58.0$ and
 $s=1.2$. While the wave is refracted across the density interface at the bottom of the bubble, the reflected wave focuses on the axis (
 $t/T_c^w=0.962$). This leads to a further reflection that produces the spherical wave emerging from the bottom interface and expanding within the bubble. Simultaneously, the refracted wave in the bubble exterior is also focused on the axis to generate the spherical compression wave expanding under the bubble interface (
 $t/T_c^w=0.97$). This wave is responsible for the liquid velocity diverging from the bubble, initiating the rebound phase apparent in the centre column of figure 9 (
 $t/T_c^w=1.0$–
 $1.25$). During this phase, a jet pierces the bubble changing its topology from spheroidal to toroidal to eventually impinge the wall, as shown in the right column of the figure.
Schlieren-like representation of the density gradients, showing the density interface across the bubble boundary and the primary shock wave propagating inside the bubble with refracted and reflected shock waves,  $\beta = 58.0$,
 $s = 1.2$. From left to right:
 $t/T^w_c = 0.950$, 0.959, 0.962 and 0.965.

During the collapse, the volume enclosed by the critical density shrinks to zero, but a region of incondensable fluid survives. Figure 11 shows the evolution of the volume where  $\theta \ge \theta _c$ compared with that where
 $\rho \le \rho _c$. Around the collapse time, the region of supercritical temperature encloses that where the density is subcritical. It turns out that, for most of the evolution, the critical density isoline is a good representative of the bubble. However, when the fluid gets supercritical, this correspondence is lost, confirming that the results are more precisely represented in terms of the numerical Schlieren, which better corresponds to optics experiments.
History of the volume enclosed by the critical density isoline (solid line, volume where  $\rho \le \rho _c$) and by the temperature isoline (dash-dotted line, volume where
 $\theta \ge \theta _c$). The dashed line is the volume of the region where either
 $\rho \le \rho _c$ or
 $\theta \ge \theta _c$. Here
 $\beta = 58.0$,
 $s = 1.2$.

6.3. Bubble vorticity
The change in the bubble topology from spherical to toroidal is accompanied by the formation of a jet and circulatory motions clearly seen in the vector velocity fields in figure 9. They are the clear signature of vorticity that is generated during the collapse phase. For the present van der Waals equation of state, the baroclinic vorticity generation term derived from the capillary Navier–Stokes equation in § 3.1 is given by
 \begin{equation} B ={-}\frac{1}{\rho}\boldsymbol{\nabla}\left(\frac{s_f}{\rho}\right)\times\boldsymbol{\nabla}\theta ={-}\frac{1}{\rho}\frac{\partial s_f^b/\rho}{\partial \rho}\boldsymbol{\nabla}\rho\times\boldsymbol{\nabla}\theta = \frac{8}{\rho^2 (3 - \rho )} \boldsymbol{\nabla}\rho\times\boldsymbol{\nabla}\theta , \end{equation}
where the expression in the middle exploits a constant capillary coefficient. We recall that the above expression is dimensionless, with the corresponding dimensional quantity obtained after multiplying by  $p_c/(\rho _c^2 R_0^2)$. Many physical mechanisms may contribute to vorticity generation as described in the context of a sharp interface model; see e.g. Magnaudet & Mercier (Reference Magnaudet and Mercier2020); Terrington et al. (Reference Terrington, Hourigan and Thompson2022) for a detailed discussion and Appendix B for the derivation of the sharp interface limit from the present formulation). For constant viscosity, all of them are included in the diffuse interface form of the baroclinic term.
Figure 12(a) shows spatial distribution of  $B$ at a particular instant, for the case with
 $\beta = 58.0$ and
 $s = 1.2$. It is expressed as the vector product of the two vector fields,
 $\sqrt {{8}/{\rho ^2 (3 - \rho )}} \boldsymbol {\nabla }\rho$ and
 $\sqrt {{8}/{\rho ^2 (3 - \rho )}} \boldsymbol {\nabla }\theta$, shown as arrows in the figure. Apparently, where
 $|B|$ is large the two local vectors are large (intensity is coloured from red to white) and form a finite angle with each other (see the inset). Elsewhere, either the fields have small intensity, or they are perfectly parallel/antiparallel. By comparing with figure 9, the region of intense baroclinic vorticity production occurs where the compression wave propagating within the bubble interacts with the bubble interface and its intense density gradients (
 $t/T_c^w=0.95,\ 0.96$). Although this may not be the general interpretation (indeed vorticity is generated also assuming the liquid is incompressible), the analysis of our data shows that, in the present specific conditions, the main vorticity production mechanism is associated with the interaction of pressure waves and interfacial density gradients.
Vorticity production and transport,  $t/T_c^w = 0.94$,
 $\beta = 58.0$ and
 $s = 1.2$. (a) Isolines of the baroclinic term
 $B$, (6.8) (blue negative, green positive). The two vector fields, with arrows coloured according to the intensity from red to white, correspond to
 $\sqrt {{8}/{\rho ^2 (3 - \rho )}} \boldsymbol {\nabla }\rho$ and
 $\sqrt {{8}/{\rho ^2 (3 - \rho )}} \boldsymbol {\nabla }\theta$. In the inset, the region of strongest baroclinic production. (b) Vorticity (flood) with superimposed
 $B$-isolines and fluid relative velocity with respect to the bubble centre of mass (arrows).

Figure 12(b) shows the corresponding vorticity (flood), with the superimposed  $B$-isolines and velocity field in the reference frame translating with the (instantaneous) bubble centre mass velocity. The vorticity generated by the baroclinic term is transported by the fluid velocity and is advected upwards with respect to the translating bubble. The eddying motion associated with the generated vorticity is apparent from the (relative) velocity field. Figure 13 shows different snapshots along the bubble evolution, depicting the same quantities as in figure 12(b). The vorticity survives up to the last frames shown in the figure, despite the considerable diffusion due to viscosity,
 $1/\rho \boldsymbol {\nabla } \times (1/\rho \, \boldsymbol {\nabla } \boldsymbol {\cdot } \boldsymbol {\varSigma } )$. This is due to the competing effect of stretching, which tends to intensify the vorticity through the stretching term
 $(\boldsymbol {\zeta }/\rho ) \boldsymbol {\cdot } \boldsymbol {\nabla } \boldsymbol {u}$, related to the increase of the toroid radius since, when approaching the wall, the ring vortex expands radially. As the vortex approaches the wall, secondary vorticity with opposite sign forms right at the wall due to the no-slip condition.


6.4. Wall pressure
The pressure waves emitted during collapse propagate with the liquid speed of sound  $c=\sqrt {40\theta /(3-\rho )^2-6\rho }$ (see Zhao et al. Reference Zhao, Mentrelli, Ruggeri and Sugiyama2011) and impact the solid surface as shown in figure 14, transferring energy to it. The wave front is oriented obliquely with respect to the solid surface, hence its trace generates a disturbance that moves on the wall faster than
 $c$, with a velocity
 $v_{D}$ that decreases asymptotically to
 $c$, as the front becomes normal to the surface, see figure 15 for a qualitative comparison at different
 $\beta$ values, where the density gradient intensity increase is apparent for larger
 $\beta$, and figure 16, showing
 $v_{D}$ as a function of the radial coordinate. Simple geometric considerations based on the assumption of spherical propagation lead to
 $v_{D}(r)=\sqrt {1+Z_c^2/r_{D}^2}$. The load distribution transmitted to the solid is a function of the initial conditions, in terms of overpressure
 $\beta$ and relative distance to the wall
 $s$, see figure 17, where the wall load envelope is represented for different overpressures (a) and distances (b). The normal stress
 \begin{align} T_{zz}&={-}p_0(\rho,\theta)+\frac{Cn}{2}\left[\left(\frac{\partial \rho}{\partial r}\right)^2 -\left(\frac{\partial \rho}{\partial z}\right)^2\right] +\frac{\rho\,Cn}{r}\left[\frac{\partial }{\partial r}\left(r\frac{\partial \rho}{\partial r}\right)+r\frac{\partial^2 \rho}{\partial {z}^2}\right]\nonumber\\ &\quad -\frac{2}{3Re}\boldsymbol{\nabla}\boldsymbol{\cdot}\boldsymbol{u}+\frac{2}{Re}\frac{\partial u_z}{\partial z}, \end{align}
is by far the largest contribution to the stress transmitted to the material ( $T_{zz}\gg T_{rz}$) and is responsible for subsequent plastic deformations.
Snapshots of the first time the pressure wave hits the wall: (a)  $\beta =28.5$,
 $s=1.2$,
 $t/T_c^w=1.01$; (b)
 $\beta =58.0$,
 $s=1.2$,
 $t/T_c^w=0.98$. Schlieren-like visualisation of the density gradients, dimensionless pressure field (flood,
 $p_c=22$ MPa), and absolute velocity vectors.

Schlieren-like visualisation of the shock wave travelling in the liquid: (a)  $\beta = 28.5$,
 $s=1.2$ (
 $t/T_c^w=0.97,\ 1.01,\ 1.02,\ 1.06$); (b)
 $\beta = 58.0$,
 $s=1.2$ (
 $t/T_c^w=0.95,\ 0.98,\ 0.99,\ 1.05$).

Propagation velocity of the load at the wall as a function of the radial distance from the axis of symmetry ( $R_0=1$
 $\mathrm {\mu }$m). The velocity at the impact is very high due to the wave front orientation, and progressively converges to the speed of sound in the liquid
 $c$. The coloured arrows correspond to the transverse (
 $c^\ast _{T}$) and longitudinal (
 $c^\ast _{L}$) wave speeds in the solid for three different scenarios analysed in the simulations.

Envelopes of the maximum normal stresses  $T_{zz}$ transmitted to the solid surface during loading (
 $p_c=22$ MPa,
 $R_0=1$
 $\mathrm {\mu }$m). (a) The envelope amplitude is proportional to the overpressure parameter
 $\beta$. In the inset, five different load profiles are shown in red, for
 $\beta =58.0$ and
 $s=1.2$. (b) The shape of the envelopes is influenced by the initial distance of the bubble centre to the solid. As the distance decreases, the impact becomes more concentrated and the maximum pressure increases. In the inset, five different load profiles are shown in red, for
 $\beta =42.8$ and
 $s=1.2$.

7. Wave propagation in the solid
The solid simulations are performed assuming axisymmetry, with cylindrical coordinates  $r$,
 $\theta$ and
 $z$ in the domain
 $\varOmega _s=[0,\ R] \times [0, 2 \pi ]\times [-H_s,\ 0]$. The boundary conditions on the solid wall
 $z = 0$ prescribe continuity of stresses
 \begin{equation} \boldsymbol{\sigma}\hat{\boldsymbol{e}}_z=T_{zz}\hat{\boldsymbol{e}}_z, \end{equation}
where  $T_{zz}$ comes from the fluid simulation (6.9). The remaining parts of the domain boundary at
 $z=-H_s$ and
 $r=R$ consist of viscous absorbing layers to dampen outward going waves (Hughes Reference Hughes2012). Initially the material is assumed to be completely undeformed and still,
 $\boldsymbol {r}(\boldsymbol {x}, 0) = \boldsymbol 0$,
 $\boldsymbol {v}(\boldsymbol {x}, 0) = \boldsymbol 0$.
For the moment, we restrict our analysis to a perfectly plastic material, i.e. with  $K_{H}=0$. In such conditions, the elastic behaviour of the material is fully determined once the two Lamé parameters are prescribed (or, alternatively, one of them plus Poisson's ratio
 $\nu$), and the plastic behaviour is characterised by the constant yield stress
 $\sigma _Y(\chi )=\sigma _Y^0$. All the results presented in this section are obtained taking
 $T_{zz}(r,t)$ data from the fluid simulation with
 $\beta =42.8$ and
 $s=1.2$.
As stated in § 2, the solid dynamics is assumed not to influence the fluid dynamics, hence the coupling is obtained by just providing the appropriate  $T_{zz}$ history to the solid boundary. This assumption is motivated by the high solid/fluid impedance ratio
 $Z_s/Z_f=\sqrt {2\rho _{S}\mu _{S}(1-\nu )/(1-2\nu )}/\rho _l c_l$. A thorough analysis on the effects of the impedance ratio on the bubble dynamics has been recently presented in Cao et al. (Reference Cao, Wang, Coutier-Delgosha and Wang2021) (see also Brekhovskikh & Godin (Reference Brekhovskikh and Godin2012) for a more general discussion on impedances and waves in layered media) where three different regimes,
 $Z_s/Z_f\approx 1$, >1 or <1 have been identified. The overall fluid dynamics may change a lot, in particular for what concerns the shock wave reflection, with the results approaching those of the interaction with a rigid wall in the limit
 $Z_s/Z_f\rightarrow \infty$. In the results presented here, we limit our attention to solid materials such that
 $Z_s/Z_f\geq 10.5$, thus resembling the interaction with a rigid wall, making it unnecessary to fully couple the two systems.
As a consequence of the fluid shock wave impact, elastoplastic waves develop within the material, as introduced in § 4.1. By varying the solid material properties at fixed  $T_{zz}(r,t)$ history, three different behaviours of the elastoplastic material are observed and analysed here, corresponding to the arrows in figure 16, which identify the transverse and longitudinal waves speed (
 $c_{T}^\ast < c_{L}^\ast < c$ green,
 $c_{T}^\ast < c< c_{L}^\ast$ red and
 $c< c_{T}^\ast < c_{L}^\ast$ blue). The intermediate red case (
 $c_{T}^\ast =5.42$,
 $c_{L}^\ast =10.83$,
 $\nu =0.33$), referred here as the transonic case, following the naming convention adopted in solid mechanics, is reported in figure 18 (compare with the sketch in figure 2 for a reference) whose columns include the Von Mises equivalent stress
 $\sqrt {3/2}|\boldsymbol {\sigma }_{dev}|$, the divergence and the curl of the displacement field, respectively. In the elastic reference solution (first row of figure 18) the whole complex system of waves outlined in § 4.1 is apparent in the first column. The hemispherical wavefronts located at
 $r\approx 8$ and
 $r\approx 4$ enclose longitudinal and transversal waves, respectively, that are decoupled and individually represented in the second and third columns in the form of the divergence and curl fields. The fluid disturbance, located at
 $r\approx 6$, generates the transonic elastic conical wave that connects to the transverse wavefront, first column. The head or Von Schmidt conical wavefront, of weaker intensity, generated at the solid boundary in correspondence with the longitudinal wavefront, is noticeable in the first column. Finally, the Rayleigh waves are visible in the narrow zone located under the solid surface at
 $r\approx 4$, in columns 2 and 3. The plastic solutions, second and third rows of figure 18,
 $\sigma _Y^0=1\times 10^{-2}$ and
 $5\times 10^{-3}$, respectively, appear to be similar to the elastic solution in the wave propagation, but different in a subsuperficial zone below the bubble (
 $R_0=1$), where the stress intensity is higher and the divergence and curl fields are non-negligible, meaning that some non-elastic mechanism is at play. By comparing the intensities in the three figures it is clear how, in the plastic materials, some of the energy transmitted to the solid is dissipated by permanently deforming the narrow zone below the bubble, thus resulting in weaker energies transported by the elastic waves. The difference between the elastic and the corresponding plastic solutions is presented in the third and fourth rows. This visualisation highlights how not only the subsuperficial zone below the bubble is influenced by plasticity, but also the propagation of the elastic waves, whose wavefront is less pronounced. This effect is also more evident in the second plastic case, with a smaller yield stress
 $\sigma _Y^0$, thus attaining larger plastic deformations. This fact was already introduced in § 4.1, where the nonlinearity of the problem was discussed and the possibility of a permanent plastic deformation having an influence on the underlying elastic dynamics was assessed.
Von Mises stress, divergence and curl of the displacement field organised by columns, at dimensionless time  $t/T_c^W=1.39$ (unit length corresponding to 1
 $\mathrm {\mu }$m). Cases organised by rows: (1) elastic case, (2) plastic case with
 $\sigma _Y^0=1\times 10^{-2}$, (3) plastic case with
 $\sigma _Y^0=5\times 10^{-3}$, (4) row 2–row 1 and (5) row 3–row 1. The nonlinearity of the dynamic elastoplastic problem affects not only the subsuperficial area corresponding to the bubble position, but also the propagation of the elastic wave front.

The resulting plastic deformation, that evolves according to (4.3), is shown in the sequence of figure 19 for the case with  $\sigma _Y^0=5\times 10^{-3}$ (similar results are obtained for
 $\sigma _Y^0=1\times 10^{-2}$). The hemispherical front of plastic deformation clearly expands during time, up until a point where the energy transmitted by the fluid shock wave is below the distortional energy needed to plastically deform the material. As a result, a finite region is permanently deformed in those places where the stresses were maximal.
Plastic strain norm  $|\boldsymbol {\epsilon }_p|$ propagation in time for the transonic plastic case with
 $\sigma _Y^0=5\times 10^{-3}$. The elastoplastic wave propagating in the solid is apparent. From left to right, dimensionless times
 $t/T_c^w=0.99$, 1.01, 1.04, 1.08, 1.10 and 1.61.

A different qualitative picture can be obtained by varying  $c_{L}$ and
 $c_{T}$ in such a way that the wave propagation on the solid surface is completely supersonic or subsonic with respect to the wave speeds in the solid, green and blue arrows in figure 16, respectively. In the former case, figure 20 (see panel a for the elastic reference solution), since
 $c>c_{L}$, a new conical wavefront emerges, originating at the solid–liquid interface in correspondence with the moving load (
 $r \approx 8$) and connecting to the hemispherical wavefront of the longitudinal waves (
 $r=z\approx 3.5$). In these conditions, the Von Schmidt wavefront and the Rayleigh waves are invisible. Looking at the elastoplastic solutions in figure 20(b–d), ordered for decreasing
 $\sigma _Y^0$, it should be noted how the maximum attained stress in the material obviously decreases and the wavefronts become progressively more diffused, and interact with each other giving rise to different structures. Significant differences are also found in the subsuperficial region below the bubble, where the material is permanently deformed. The resulting plastic deformation is shown in figure 21 for the same three cases ordered by decreasing
 $\sigma _Y^0$, where it is clearly visible how the region interested by plasticity spreads and attains larger deformations for decreasing
 $\sigma _Y^0$.
Von Mises stress at  $t/T_c^w=1.50$ for the supersonic case and for three different yield stresses: (a) elastic, (b) plastic,
 $\sigma _Y^0=5\times 10^{-3}$, (c)
 $\sigma _Y^0=2.5\times 10^{-3}$ and (d)
 $\sigma _Y^0=1\times 10^{-3}$.

Permanent plastic deformation norm  $|\boldsymbol {\epsilon }_p|$ for the supersonic case in figure 20: (a)
 $\sigma _Y^0=5\times 10^{-3}$, (b)
 $\sigma _Y^0=2.5\times 10^{-3}$ and (c)
 $\sigma _Y^0=1\times 10^{-3}$.

Finally, the subsonic case (blue arrows in figure 16) is shown in figure 22, where the Von Mises stress for the purely elastic (a) and the plastic (b) cases is reported. The main difference with previous cases is the absence of conical wavefronts induced by the fluid disturbance, the only one being the already mentioned Von Schmidt conical wavefront generated at the solid–fluid interface. The only discrepancy between the elastic and plastic solutions is in the region enclosed by the transversal wavefront ( $r<3$), where the disturbance excites the solid material. Comparing this case with the previous cases, it is interesting to note how the plastically deformed region is particularly significant and spreads more in the radial direction. This is a direct effect of the load being applied, over time, in roughly the same region where the transversal and Rayleigh waves are located.
Von Mises stress for the subsonic case at  $t/T_c^w=1.13$: (a) elastic and (b) plastic with
 $\sigma _Y^0=8\times 10^{-3}$. The load excites the solid roughly at the Rayleigh wave location over time, thus resulting in a permanent plastic deformation norm
 $|\boldsymbol {\epsilon }_p|$ that spreads also radially, as shown in panel (c).

7.1. Plastic dissipation in the solid
The dissipation in the solid material due to plasticity can be evaluated using the relation  $\mathcal {D}(r,z,t)=\sqrt {2/3}\sigma _Y^0|\dot {\boldsymbol {\epsilon }}_p(r,z,t)|$, which, by recalling that
 $\alpha _p(t)=\sqrt {2/3}\int _0^t|\dot {\boldsymbol {\epsilon }}_p(r,z,\tau ) |\,{\rm d}\tau$, can be integrated over time and space to obtain the energy dissipated as permanent plastic deformation in the material,
 \begin{equation} E_{\mathcal{D}} =\int_0^t\int_V \mathcal{D}(r,z,\tau)\,\mathrm{d} V\,\mathrm{d}\tau =\sigma_Y^0\int_V \alpha_p(r,z,t)2\pi r\,\mathrm{d} r\,\mathrm{d} z. \end{equation}
On the other hand, the energy transferred to the solid by the fluid load on the wall is
 \begin{equation} E_{wall}=\int_0^t\mathcal{P}_{wall}(\tau)\,\mathrm{d}\tau =\int_0^t\int_0^R T_{zz}(r,0)\boldsymbol{v}(r,0)2\pi r\,\mathrm{d} r\,\mathrm{d}\tau. \end{equation}
The evolution of the power and energy transmitted to the wall, and the percentage of energy that is dissipated in plastic deformation are shown in figure 23 for five different plastic cases. As expected, at fixed elastic parameters, the materials with lower  $\sigma _Y^0$ dissipate more.
(a–c) Power transmitted to the solid wall, energy transmitted to the solid wall (with total energy dissipated in plastic deformation in the inset) and percentage of energy dissipated in plastic deformation vs dimensionless time, for five different plastic materials. The time scale is shifted by  $T_c^w$ to start at collapse time. The two cases labelled with (a) are for the transonic case (red arrows in figure 16), whereas (b) refers to three supersonic cases (green arrows in figure 16).

8. Conclusions and perspectives
The collapse of a vapour microbubble over an elastoplastic solid wall, caused by an external high-pressure liquid, has been investigated by adopting a diffuse interface model for the fluid and a dynamic elastoplastic model for the solid. At the same time, inertial effects, typical of the macroscale, remain crucial at these scales. In particular, jet formation and topological transitions are observed for microbubble collapse triggered by an initial overpressure in the liquid. A complex system of shock waves, emerging from the bubble interior during collapse, is reflected and refracted at the bubble interface, and then propagates in the liquid to later impact the solid wall and transfer energy to it. We have shown that the interaction of the fluid shock wave with the bubble interface produces baroclinic vorticity, inducing the typical circulatory motion associated with microjetting.
The fluid stress on the elastoplastic wall transfers energy to the solid. Part of this energy is transported outwards by elastic waves, part is dissipated by plasticity in the permanent deformation of the material. The radiated waves consist of longitudinal, transversal, Rayleigh and conical head waves. In the meanwhile, plastic deformation occurs in the form of expanding plasticity waves. The permanent deformation of the solid accumulates in a subsuperficial region below the bubble, which extends to at least half of the initial bubble volume in the solid. The two wave components are coupled and, depending on conditions, elastic propagation can be influenced by the plastic deformation. It is found that the permanent deformation is particularly significant in the case of a disturbance moving close to the velocity of Rayleigh and transverse (shear) waves ( $v_{D}\simeq c_{R}\simeq c_{T}$). This sounds natural after noting that the adopted plasticity criterion (Von Mises) neglects volumetric deformations and plasticity occurs when distortional (shear) energy exceeds the critical thresholds.
Throughout the paper, we assumed axisymmetry of the collapse and elastoplastic wave propagation. Reuter, Deiter & Ohl (Reference Reuter, Deiter and Ohl2022) recently showed that the non-axisymmetric self-focusing mechanism may contribute significantly to erosion for single-bubble cavitation, in particular in extreme vicinity of metallic surfaces. These recent experimental findings call for three-dimensional non-axisymmetric simulations, which, given the significant computational demand, are reserved for future work, together with the possible extension to real fluids (Benilov Reference Benilov2020; Magaletti et al. Reference Magaletti, Gallo and Casciola2021) and to binary mixtures (Liu, Amberg & Do-Quang Reference Liu, Amberg and Do-Quang2016; Mukherjee & Gomez Reference Mukherjee and Gomez2022; Benilov Reference Benilov2023).
As a final comment concerning the plasticity model, we focused here on perfectly plastic materials with hardening modulus  $K_H= 0$. Hardening,
 $K_H>0$, would only affect the behaviour in the plastic regime, requiring an increasingly larger threshold to be exceeded to plastically deform the material, without changing the overall qualitative picture. The model can be further extended to account for rate-dependency and damage effects, also generalising the yield criterion to describe non-metal (e.g. soft) materials.
Supplementary material
Supplementary material is available at https://doi.org/10.1017/jfm.2024.925.
Acknowledgements
The research has received financial support from ICSC – Centro Nazionale di Ricerca in ‘High-Performance Computing, Big Data and Quantum Computing’, funded by the European Union – NextGenerationEU. We acknowledge the CINECA award under the ISCRA initiative, for the availability of high-performance computing resources and support (ISCRA-B CAMAGE3D and ISCRA-B D-RESIN). CMC has been partially supported by the Sapienza 2022 Funding Scheme, project no. RG1221815884CB65.
Declaration of interests
The authors report no conflict of interest.
Appendix A. Elastoplasticity modelling
The purpose of the present appendix is to briefly recapitulate basic notions of continuum mechanics and plasticity theory and introduce the plasticity model used in the simulations. Mainly, this appendix is added to the main text for the convenience of readers not acquainted with this class of theories. Most of the material is classical and can be found in the specialised literature, even though a few elements of novelty may be found in our attempt to provide a concise, but self-contained treatment. A review of nonlinear plasticity theory may be found, for example, in Antman & Szymczak (Reference Antman and Szymczak1989) and Antman (Reference Antman2005), whereas the linearised model we actually employ and rederive from the nonlinear theory is described in Lubliner (Reference Lubliner2008). The formulation we use belongs to the class of rate-independent, isothermal plasticity models with isotropic hardening, even though it can be readily extended in several respects, e.g. by considering thermal effects and including rate-dependency.
A.1. Plasticity model
The configuration of a body is defined in terms of the map from the reference configuration (Lagrangian variables) to the current one,  $\boldsymbol {x} = \boldsymbol {\chi }(\boldsymbol {X},t ) = \boldsymbol {X} + \boldsymbol {r}(\boldsymbol {X},t )$ (Eulerian variables), where
 $\boldsymbol {r}$ is the displacement. The deformation gradient
 $\boldsymbol {F} = \partial \boldsymbol {x}/\partial \boldsymbol {X}$ and the (nonlinear) strain
 $\boldsymbol {E} = ( \boldsymbol {F}^T \boldsymbol {\cdot } \boldsymbol {F} - \boldsymbol {I} )/2$ are central elements of the theory (Gurtin Reference Gurtin1982). Classically, momentum conservation in Lagrangian variables reads
 \begin{equation} \rho_0 \ddot{\boldsymbol{r}} = \nabla_{\boldsymbol{X}} \boldsymbol{\cdot} (\boldsymbol{F} \boldsymbol{\cdot} \boldsymbol{S}) + \rho_0 \boldsymbol{f}_0, \end{equation}
where  $\rho _0$ is the (possibly space-dependent) constant-in-time mass density in the Lagrangian description,
 $\boldsymbol {f}_0$ is the body force per unit mass and the (symmetric) second Piola–Kirchhoff stress tensor is
 $\boldsymbol {S} = J \boldsymbol {F}^{-1}\boldsymbol {\varSigma }_{S} \boldsymbol {F}^{-T}$, with
 $\boldsymbol {\varSigma }_{S}$ the solid's Cauchy stress,
 $J = | \boldsymbol {F} |$ the Jacobian determinant and the superscripts
 $T$ and
 $-1$ denote matrix transposition and inversion, respectively (Gurtin et al. Reference Gurtin, Fried and Anand2010).
It is well known that, when the elastoplastic solid undergoes deformation, the displacement cannot be split into elastic and plastic components. However, the deformation gradient can always be multiplicatively decomposed as the product of elastic and plastic parts,  $\boldsymbol {F} = \boldsymbol {F}_e \boldsymbol {\cdot } \boldsymbol {F}_p$, allowing the introduction of the plastic strain
 $\boldsymbol {E}_p = ( \boldsymbol {F}_p^T \boldsymbol {\cdot } \boldsymbol {F}_p - \boldsymbol {I} )/2$ (Lubliner Reference Lubliner2008).
We assume the plastic strain and an additional scalar object,  $\alpha _p$, as internal variables defining the plastic state. The Helmholtz free energy (per unit reference volume) in a (locally) relaxed state where
 $\boldsymbol {F}_e = 0$ is taken to depend on the internal variable
 $\alpha _p$, such that, under loading, it takes the form
 ${\hat f} = {\hat f}(\boldsymbol {E} - \boldsymbol {E}_p; \alpha _p )$, providing the stress tensor as
 $\boldsymbol {S} = \partial {\hat f}(\boldsymbol {E} - \boldsymbol {E}_p ; \alpha _p )/\partial \boldsymbol {E}$. In the unloaded material,
 $\boldsymbol {S} = 0$ and the stress should, in general, behave linearly in the strain difference when
 $\boldsymbol {E} \simeq \boldsymbol {E}_p$,
 \begin{equation} {\hat f} = {\hat f}_0(\alpha_p ) + \tfrac 12 (\boldsymbol{E} - \boldsymbol{E}_p) : \boldsymbol{C}_e ( \alpha_p ) : (\boldsymbol{E} - \boldsymbol{E}_p) + {{O}}(|\boldsymbol{E} - \boldsymbol{E}_p|^3) , \end{equation}
where the (fourth-order) elastic tensor is  $\boldsymbol {C}_e(\alpha _p )$.
The Clausius–Duhem inequality,  $\boldsymbol {S}:\dot {\boldsymbol {E}} - \dot {\hat {f}} \ge 0$, expresses the second principle of thermodynamics and defines the positive-definite dissipation function (Gurtin et al. Reference Gurtin, Fried and Anand2010)
 \begin{equation} {\mathcal{D}} = \boldsymbol{S}:\dot{\boldsymbol{E}}_p + \chi {\dot \alpha}_p \ge 0 , \end{equation}
where the hardening variable  $\chi = - \partial {\hat f}/\partial \alpha _p$ is conjugate to
 $\alpha _p$. For the model used in the simulations, the physical interpretation of both variables will become clear at the end of the next appendix, where the formulation is specified in every detail.
A crucial ingredient in plasticity theory is the yield function, expressed here in terms of  $\boldsymbol {S}$ and
 $\chi$, that defines the admissible states by the inequality
 \begin{equation} \varPhi = \varPhi(\boldsymbol{S}, \chi ) \le 0. \end{equation}
Material plasticisation occurs only on the yield surface during plastic loading, i.e. for  $\varPhi = 0$ and
 $\partial \varPhi /\partial \boldsymbol {S} : \boldsymbol {\dot S} > 0$, requiring the state to remain on the yield surface,
 ${\dot \varPhi } = \boldsymbol {\dot S}:{\partial \varPhi }/{\partial \boldsymbol {S}} + {\dot \chi } {\partial \varPhi }/{\partial \chi } = 0$ (Lubliner Reference Lubliner2008).
We shall assume a maximum dissipation principle (Mises Reference Mises1928; Taylor Reference Taylor1947; Simo & Hughes Reference Simo and Hughes2006), namely the stress  $\boldsymbol {S}$ and the dual internal variable
 $\chi$ to be realised should maximise the dissipation (A3) for given
 $\dot {\boldsymbol {E}}_p$ and
 ${\dot \alpha _p}$ given the constraint (A4),
 \begin{equation} \dot{\boldsymbol{E}}_p = \frac{\partial {\mathcal{D}}}{\partial \boldsymbol{S}} = \gamma \frac{\partial \varPhi}{\partial \boldsymbol{S}} ,\quad {\dot \alpha}_p = \frac{\partial {\mathcal{D}}}{\partial \chi} = \gamma \frac{\partial \varPhi}{\partial \chi}, \end{equation}
where  $\gamma$ is the (Lagrange) plastic multiplier different from zero only during plastic loading. The equations of
 $\boldsymbol {E}_p$ and
 $\alpha _p$ are then completely defined after
 $\gamma$ is evaluated explicitly by requiring the state to remain on the yield surface under plastic loading. Taking
 $\dot {\boldsymbol {S}}$ and
 ${\dot \chi }$ from their definitions in terms of free energy and substituting into the equation
 ${\dot \varPhi } = 0$, a bit of algebra leads to the cumbersome but eventually simple expression
 \begin{equation} \gamma = \dot{\boldsymbol{E}} : \left[\frac{\partial }{\partial \boldsymbol{E}} \left(\frac{\partial {\hat f}}{\partial \boldsymbol{E}} \right) : \frac{\partial \varPhi}{\partial \boldsymbol{S}} - \frac{\partial }{\partial \boldsymbol{E}} \left(\frac{\partial {\hat f}}{\partial \alpha_p} \right) \frac{\partial \varPhi}{\partial \chi} \right] \frac{1}{D}, \end{equation}
where the denominator is
 \begin{align} D &= \left[ \frac{\partial \varPhi}{\partial \boldsymbol{S}}: \frac{\partial }{\partial \boldsymbol{E}} \left(\frac{\partial {\hat f}}{\partial \boldsymbol{E}} \right) - \frac{\partial \varPhi}{\partial \chi} \frac{\partial}{\partial \alpha_p} \left(\frac{\partial {\hat f}}{\partial \boldsymbol{E}} \right) \right] : \frac{\partial \varPhi}{\partial \boldsymbol{S}}\nonumber\\ &\quad + \left[ -\frac{\partial \varPhi}{\partial \boldsymbol{S}}: \frac{\partial }{\partial \boldsymbol{E}} \left(\frac{\partial {\hat f}}{\partial \alpha_p} \right) + \frac{\partial \varPhi}{\partial \chi} \frac{\partial}{\partial \alpha_p} \left(\frac{\partial {\hat f}}{\partial \alpha_p} \right) \right] \frac{\partial \varPhi}{\partial \chi}. \end{align}
Substitution into (A5) yields
 \begin{equation} \dot{\boldsymbol{E}}_p = \boldsymbol{M}_{\boldsymbol{E}_p} : \dot{\boldsymbol{E}} , \quad {\dot \alpha}_p = \boldsymbol{M}_{\alpha_p} : \dot{\boldsymbol{E}} \end{equation}
for suitable tensors  $\boldsymbol {M}_{\boldsymbol {E}_p}$ and
 $\boldsymbol {M}_{\alpha _p}$ whose explicit form is easily evaluated. Concerning stress, from its definition as the partial derivative of the free energy with respect to the strain, its time derivative is readily arranged as
 \begin{equation} \dot{\boldsymbol{S}} = \left[ \frac{\partial }{\partial \boldsymbol{E}} \left(\frac{\partial {\hat f}}{\partial \boldsymbol{E}} \right) - \boldsymbol{M}_{\boldsymbol{S}} \right] : \dot{\boldsymbol{E}} , \end{equation}
where the explicit expression of  $\boldsymbol {M}_{\boldsymbol {S}}$ is straightforwardly worked out using the second equation in (A8).
A.2. Linearisation of the plasticity model
The above model can be readily linearised under the assumption of small elastoplastic displacements,  $|\boldsymbol {r} | = O(\epsilon )$ together with its derivatives. It readily follows that
 $\boldsymbol {r}(\boldsymbol {X},t) = \boldsymbol {r}(\boldsymbol {x},t) + O(\epsilon ^2 )$,
 $\ddot {\boldsymbol {r}}(\boldsymbol {X},t) = {\partial ^2 \boldsymbol {r}(\boldsymbol {x},t)}/{\partial t^2} + O(\epsilon ^2 )$ and
 $\boldsymbol {E}(\boldsymbol {X},t ) = \boldsymbol {\epsilon }(\boldsymbol {x}, t ) + O(\epsilon ^2 )$, with
 $\boldsymbol {\epsilon } = ({\nabla _{\boldsymbol {x}} \boldsymbol {r} + \nabla _{\boldsymbol {x}} \boldsymbol {r}^T })/{2}$ the infinitesimal strain.
From the assumption of small displacements, one also finds  $|\boldsymbol {G}_p | = |\boldsymbol {G}_e | = O(\epsilon )$, where
 $\boldsymbol {G}_{p/e} = \boldsymbol {I} - \boldsymbol {F}_{p/e}$, which immediately leads to the additive decomposition of the (infinitesimal) strain in terms of plastic and elastic contributions,
 $\boldsymbol {\epsilon } = \boldsymbol {\epsilon }_p + \boldsymbol {\epsilon }_e$ where
 $\boldsymbol {\epsilon }_{p/e} = (\boldsymbol {G}_{p/e} + \boldsymbol {G}_{p/e}^T)/2$.
Concerning mass, one readily finds  $\rho (\boldsymbol {x},t ) = \rho _0 (\boldsymbol {x} ) + O(\epsilon )$, whereas momentum conservation eventually becomes
 \begin{equation} \rho_{0} \frac{\partial^2 \boldsymbol{r}}{\partial t^2} = \nabla_{\boldsymbol{x}} \boldsymbol{\cdot} \boldsymbol{\sigma} + \rho_0 \boldsymbol{f} , \end{equation}
once the asymptotic identity of Cauchy and second Piola–Kirchhoff stresses,  $\boldsymbol {\sigma } = \boldsymbol {\varSigma _{S}} + O(\epsilon ^2 ) = \boldsymbol {S} + O(\epsilon ^2 )$, is realised.
The Helmholtz free energy, in its quadratic approximation for small strains (A2), reads
 \begin{equation} {\hat f} = {\hat f}_0(\alpha_p ) + \tfrac 12 (\boldsymbol{\epsilon} - \boldsymbol{\epsilon}_p) : \boldsymbol{C}_e (\alpha_p ) : (\boldsymbol{\epsilon} - \boldsymbol{\epsilon}_p) + {{O}}(\epsilon^3 ) , \end{equation}
where the fourth-order elastic tensor  $\boldsymbol {C}_e$, the second derivative of the free energy with respect to strain, expresses the stress as
 $\boldsymbol {\sigma } = \boldsymbol {C}_e(\alpha _p ) : \boldsymbol {\epsilon }_e + O(\epsilon ^2 )$. For future reference, we note that
 $\partial /\partial \alpha _p (\partial {\hat f}/\partial \boldsymbol {E}) = O(\epsilon )$. In the simulations described in the main text,
 ${\hat f}_0(\alpha _p ) = 1/2 K _{H}\alpha _p^2$ where
 $K _{H}$ is the hardening modulus and the elastic tensor takes the usual isotropic form in terms of the two sole Lamé coefficients, the shear modulus
 $\mu _{S}(\alpha _p)$ and
 $\lambda _{S}(\alpha _p ) = K\ -2/3 \mu _{S}$ where
 $K(\alpha _p )$ is the bulk modulus, respectively (Gurtin Reference Gurtin1982).
To completely define the model, the yield function needs being specified, and is here taken to be of the Von Mises form (Mises Reference Mises1913),
 \begin{equation} \varPhi(\boldsymbol{\sigma},\chi ) = f^e_{dev}(\boldsymbol{\sigma}) - f^c_{dev}[\sigma_Y(\chi)]. \end{equation}
Here  $f^e_{dev}=\boldsymbol {\sigma }_{dev}:\boldsymbol {\sigma }_{dev}/(4\mu _{S})$ is the distortional contribution to the elastic free energy, with
 $\boldsymbol {\sigma }_{dev}=\boldsymbol {\sigma }-1/3\,\text {tr}(\boldsymbol {\sigma })\boldsymbol {I}$ the deviatoric stress. We use
 $f^c_{dev} = [\sigma _Y(\chi )]^2/(6\mu _{S})$ to denote its critical value after which the material yields. Finally,
 $\sigma _Y(\chi )=\sigma _Y^0 - \chi$ is the (state-dependent, uniaxial) yield stress with value
 $\sigma _Y(0)=\sigma _Y^0$ before plasticisation where
 $\chi = 0$. In other words, the hardening variable is physically identified with (minus) the difference of current and pristine yield stress,
 $-\chi = \sigma _Y - \sigma _Y^0>0$.
The tensors in (A8) are identically zero unless the material is under plastic loading. On the other hand, since, based on the yield function (A12)  $\partial \varPhi /\partial \boldsymbol {\sigma } = \boldsymbol {\sigma }_{dev}/(2 \mu _{S})$,
 $\partial \varPhi /\partial \chi = \sigma _Y/(3 \mu _{S})$, their explicit, linearised expressions under plastic loading, to accuracy
 $O(\epsilon )$, read
 $$\begin{gather} \boldsymbol{M}_{\boldsymbol{E}_p}^{Lin} = \frac{\partial \varPhi}{\partial \boldsymbol{\sigma}} : \boldsymbol{C}_e(\alpha_p ) \otimes \frac{\partial \varPhi}{\partial \boldsymbol{\sigma}} \frac{1}{D^{Lin}} = \frac{ \boldsymbol{\sigma}_{dev} : \boldsymbol{C}_e(\alpha_p) \otimes \boldsymbol{\sigma}_{dev}}{4 \mu_{S}^2 D^{Lin}}, \end{gather}$$
 $$\begin{gather}\boldsymbol{M}_{\alpha_p}^{Lin} = \boldsymbol{C}_e(\alpha_p ) : \frac{\partial \varPhi}{\partial \boldsymbol{\sigma}} \frac{\partial \varPhi}{\partial \chi} \frac{1}{D^{Lin}} = \frac{\sigma_Y \boldsymbol{C}_e(\alpha_p ) : \boldsymbol{\sigma}_{dev}}{6 \mu_{S}^2 D^{Lin}}, \end{gather}$$
where  $D^{Lin} = {\partial \varPhi }/{\partial \boldsymbol {\sigma }} : \boldsymbol {C}_e(\alpha _p ) : {\partial \varPhi }/{\partial \boldsymbol {\sigma }} + {\partial \varPhi }/{\partial \chi } {\hat f}'' _0 {\partial \varPhi }/{\partial \chi }$, leading to the evolution equations
 \begin{equation} \dot{\boldsymbol{\epsilon}}_p = \boldsymbol{M}_{\boldsymbol{E}_p}^{Lin} : \dot{\boldsymbol{\epsilon}} , \quad {\dot \alpha}_p = \boldsymbol{M}_{\alpha_p}^{Lin} : \dot{\boldsymbol{\epsilon}}. \end{equation}
Finally, (A9), the linearised stress evolution equation under plastic loading, is
 \begin{equation} \boldsymbol{M}_{\boldsymbol{S}}^{Lin} = \left[\boldsymbol{C}_e(\alpha_p ) : \frac{\partial \varPhi}{\partial \boldsymbol{\sigma}}\right] \otimes \left[\frac{\partial \varPhi}{\partial \boldsymbol{\sigma}} : \boldsymbol{C}_e(\alpha_p ) \frac{1}{D^{Lin}}\right] , \end{equation}
where  $\otimes$ is the tensor product of the two tensors within square brackets.
From (A14), it is an easy, though laborious, matter to identify the physical meaning of the internal variable  $\alpha _p$ as (proportional to) the accumulated plastic strain
 $\alpha _p(t) = \sqrt {2/3}\int _0^t | {\dot \epsilon }_p|\, {\rm d}t$ and to recast its evolution equation into an equivalent form for the yield stress, after exploiting the chain of identities
 ${\dot \sigma }_Y = - {\dot \chi } = K_{H} {\dot \alpha }_p$. Moreover, the condition for plastic loading is readily found equivalent to
 $|\boldsymbol {\sigma }_{dev}| = \sqrt {2/3} \sigma _Y$ together with
 $\boldsymbol {\sigma }_{dev} : \dot {\boldsymbol {\epsilon }} > 0$.
Using the explicit form of the derivatives  $\partial \varPhi /\partial \boldsymbol {\sigma }$,
 $\partial \varPhi /\partial \chi$ and realising that
 $\partial \varPhi /\partial \boldsymbol {\sigma }: \boldsymbol {C}_e(\alpha _p) = \boldsymbol {\sigma }_{dev}$ one eventually obtains the model compendium given in the main text (see § 4).
Appendix B. The sharp limit of the diffuse interface equations
The purpose of the present appendix is to show how the traditional equations of the sharp interface model are exactly recovered from the present diffuse interface description. The starting point is the diffuse interface form of the momentum equation
 \begin{equation} \frac{\partial{\rho\boldsymbol{u}}}{\partial t}+\boldsymbol{\nabla}\boldsymbol{\cdot}(\rho\boldsymbol{u}\otimes\boldsymbol{u}) =\boldsymbol{\nabla}\boldsymbol{\cdot} (\boldsymbol{T}_{rev} + \boldsymbol{\varSigma} ) , \end{equation}
with the reversible component of the stress tensor given by
 \begin{equation} \boldsymbol{T}_{rev}={-}\left(p_0-\frac{\lambda}{2}|\boldsymbol{\nabla}\rho|^2 -\rho\boldsymbol{\nabla}\boldsymbol{\cdot}(\lambda\boldsymbol{\nabla}\rho)\right)\boldsymbol{I} -\lambda\boldsymbol{\nabla}\rho\otimes\boldsymbol{\nabla}\rho , \end{equation}
and
 \begin{equation} \boldsymbol{\varSigma} = \eta(\boldsymbol{\nabla}\boldsymbol{u}+(\boldsymbol{\nabla}\boldsymbol{u})^{\rm T})-\tilde{\eta}(\boldsymbol{\nabla}\boldsymbol{\cdot}\boldsymbol{u})\boldsymbol{I} \end{equation}
the standard Newtonian part. The divergence of the reversible part of the stress tensor can be rearranged as
 \begin{equation} \boldsymbol{\nabla}\boldsymbol{\cdot}\boldsymbol{T}_{rev}={-} \boldsymbol{\nabla} \hat{p} + \boldsymbol{\nabla}\boldsymbol{\cdot} \boldsymbol{K} , \end{equation}
with a suitably modified pressure  $\hat {p} = p_0 + {\lambda }/{2}|\boldsymbol {\nabla }\rho |^2 -\rho \boldsymbol {\nabla }\boldsymbol {\cdot }(\lambda \boldsymbol {\nabla }\rho )$ and a symmetric second-order tensor
 $\boldsymbol {K} = \lambda |\boldsymbol {\nabla }\rho |^2 \boldsymbol {I} -\lambda \boldsymbol {\nabla }\rho \otimes \boldsymbol {\nabla }\rho$.
In the diffuse interface model, the interfacial layer has a small, but finite thickness  $\ell _{lv}$, (3.4). To recover the sharp interface description we have to assume that the ratio of interface thickness and external scale
 $\epsilon = \ell _{lv}/R_0$ tends to zero. In the following, spatial distances are made dimensionless with the outer scale
 $R_0$ such that the interfacial layer more or less extends in the range
 $-\epsilon /2 \le n \le \epsilon /2$.
We describe a neighbourhood of the interface using a local system of curvilinear coordinates, with  $n$ the coordinate in the normal direction and
 $\xi ^{1/2}$ tangential coordinates, such that
 $\boldsymbol {r} = \boldsymbol {g}_\alpha \xi ^\alpha + n \boldsymbol {n}= \boldsymbol {r}_\pi + n \boldsymbol {n}$,
 $\boldsymbol {\nabla } = \boldsymbol {g}^\alpha {\partial }/{\partial \xi ^\alpha } + \boldsymbol {n} {\partial }/{\partial n} = \nabla _\pi + \boldsymbol {n} \, {\partial }/{\partial n}$, with
 $\boldsymbol {g}_\alpha = \partial \boldsymbol {r}/\partial \xi ^\alpha$ the covariant base vectors (
 $\alpha = 1,2$) and
 $\boldsymbol {g}^\beta$ the corresponding contravariant base elements on the tangent plane.
The inner region of the field, corresponding to the interfacial layer, is better described using the inner variable  $\nu = n/\epsilon$, such that, in the spirit of matched asymptotic expansion,
 $-\infty \le \nu \le \infty$. The gradient operator reads
 $\boldsymbol {\nabla } = \boldsymbol {n}/\epsilon \partial /\partial \nu + \nabla _\pi$ in the inner variable, e.g.
 $$\begin{gather} \boldsymbol{\nabla}\rho = \boldsymbol{n} \frac{1}{\epsilon} \frac{\partial \rho}{\partial \nu} + \nabla_\pi \rho , \end{gather}$$
 $$\begin{gather}\boldsymbol{K} \,{=}\,
\frac{\lambda}{\epsilon}\! \left(\!\frac{1}{\epsilon} \left(\!
\frac{\partial \rho}{\partial \nu}\!\right)^2\!
({\boldsymbol{I}} \,{-}\, \boldsymbol{n} \otimes \boldsymbol{n} )
\,{+}\, \frac{\partial \rho}{\partial \nu} ( \boldsymbol{n}
\otimes \nabla_\pi \rho \,{+}\, \nabla_\pi \rho \otimes
\boldsymbol{n}) \,{+}\, \epsilon (| \nabla_\pi \rho|^2
\boldsymbol{I} \,{-}\, \nabla_\pi \rho \otimes \nabla_\pi
\rho)\!\right)\!, \end{gather}$$
 $$\begin{gather}{\hat p} = p_0 + \frac{\lambda}{2 \epsilon} \left(\frac{1}{\epsilon} \left( \frac{\partial \rho}{\partial \nu}\right)^2 + \epsilon |\nabla_\pi \rho |^2\right) - \frac{\lambda}{\epsilon} \rho \left(\frac{1}{\epsilon} \frac{\partial^2 \rho}{\partial \nu^2} + \frac{\partial \rho}{\partial \nu} \nabla_\pi \boldsymbol{\cdot} \boldsymbol{n} + \epsilon \nabla_\pi^2 \rho\right) . \end{gather}$$
The surface tension (3.5) reads
 \begin{equation} \sigma = \int_{-\infty}^{+\infty}\lambda\left(\frac{\partial \rho}{\partial n}\right)^2 \, {\rm d}n = \frac{\lambda}{\epsilon} \int_{-\infty}^{+\infty}\left(\frac{\partial \rho}{\partial \nu}\right)^2 \, {\rm d}\nu , \end{equation}
which shows that, in the limit of vanishing interfacial thickness, the ratio  $\gamma = \lambda /\epsilon$ and the integral
 $\int (\partial \rho /\partial \nu )^2 \,{\rm d} \nu$ both remain finite and positive.
In the sharp interface limit, the forces exchanged across the two sides of the interface appear as concentrated effects, with intensity given by the integral across the interfacial layer of  $\boldsymbol {\nabla } \boldsymbol {\cdot } \boldsymbol {T}_{rev}$. Straightforward calculations show that
 \begin{align} \boldsymbol{\nabla}\boldsymbol{\cdot}\boldsymbol{K}&= \boldsymbol{n} \boldsymbol{\cdot} \frac{1}{\epsilon} \gamma \frac{\partial}{\partial \nu}\left( \frac{1}{\epsilon} \left(\frac{\partial \rho}{\partial \nu} \right)^2 (\boldsymbol{I} - \boldsymbol{n} \otimes \boldsymbol{n}) + \frac{\partial \rho}{\partial \nu} (\boldsymbol{n} \otimes \nabla_\pi \rho + \nabla_\pi \rho \otimes \boldsymbol{n} ) \right.\nonumber\\ &\quad +\left.\epsilon (|\nabla_\pi \rho |^2 \boldsymbol{I} + \nabla_\pi \rho \otimes \nabla_\pi \rho ) \vphantom{\left(\frac{\partial \rho}{\partial \nu} \right)^2}\right) + \nabla_\pi \boldsymbol{\cdot} \gamma \left( \frac{1}{\epsilon} \left(\frac{\partial \rho}{\partial \nu} \right)^2 (\boldsymbol{I} - \boldsymbol{n} \otimes \boldsymbol{n} ) \right. \nonumber\\ &\quad +\left. \frac{\partial \rho}{\partial \nu} \left(\boldsymbol{n} \otimes \nabla_\pi \rho + \nabla_\pi \rho \otimes \boldsymbol{n} \right) + \epsilon (|\nabla_\pi \rho |^2 \boldsymbol{I} + \nabla_\pi \rho \otimes \nabla_\pi \rho ) \vphantom{\left(\frac{\partial \rho}{\partial \nu} \right)^2}\right) , \end{align}
that is,
 \begin{align} \boldsymbol{\nabla}\boldsymbol{\cdot}\boldsymbol{K} &= \frac{\gamma}{\epsilon} \boldsymbol{n} \boldsymbol{\cdot} \frac{\partial }{\partial \nu}\left( \frac{\partial \rho}{\partial \nu} (\boldsymbol{n} \otimes \nabla_\pi \rho + \nabla_\pi \rho \otimes \boldsymbol{n} ) \right) \nonumber\\ &\quad+ \frac{\gamma}{\epsilon} \nabla_\pi \boldsymbol{\cdot}\left( \left(\frac{\partial \rho}{\partial \nu} \right)^2 (\boldsymbol{I} - \boldsymbol{n} \otimes \boldsymbol{n} ) \right) + {{O}}(1 ). \end{align}
After a few manipulations, one finds
 \begin{align} &\int \boldsymbol{\nabla} \boldsymbol{\cdot} \boldsymbol{K} \,{\rm d}n \nonumber\\ &\quad = \gamma \int_{-\infty}^\infty {\rm d} \nu , \left( \frac{\partial}{\partial \nu} \left(\frac{\partial \rho}{\partial \nu} \nabla_\pi \rho \right) + \frac{\partial \rho}{\partial \nu} \boldsymbol{n} \boldsymbol{\cdot} \nabla_\pi \frac{\partial \rho}{\partial \nu} \boldsymbol{n} + \nabla_\pi \left(\frac{\partial \rho}{\partial \nu} \right)^2 - \kappa \left(\frac{\partial \rho}{\partial \nu} \right)^2 \boldsymbol{n} \right) \nonumber\\ &\quad =\nabla_\pi \int_{-\infty}^\infty {\rm d} \nu \, \gamma \left(\frac{\partial \rho}{\partial \nu} \right)^2 - \boldsymbol{n} \kappa \int_{-\infty}^\infty {\rm d} \nu \, \gamma \left(\frac{\partial \rho}{\partial \nu} \right)^2 = \nabla_\pi \sigma - \kappa \sigma \boldsymbol{n} , \end{align}
that is,
 \begin{equation} \int \boldsymbol{\nabla} \boldsymbol{\cdot} \boldsymbol{K} \,{\rm d}n = \nabla_\pi \sigma - \kappa \sigma \boldsymbol{n} , \end{equation}
with  $\kappa = \nabla _\pi \boldsymbol {\cdot }\boldsymbol {n}$ the mean curvature of the sharp interface.
Concerning the integral of the modified pressure gradient
 \begin{equation} \boldsymbol{\nabla} {\hat p} = \frac{1}{\epsilon} \boldsymbol{n} \frac{\partial {\hat p}}{\partial \nu} + \nabla_\pi {\hat p}, \end{equation}
one obtains
 \begin{equation} \int \boldsymbol{\nabla} {\hat p} \,{\rm d}n = \boldsymbol{n} \int_{-\infty}^\infty \frac{\partial {\hat p}}{\partial \nu} \,{\rm d} \nu + \epsilon \nabla_\pi \int_{-\infty}^\infty {\hat p} \,{\rm d} \nu = \boldsymbol{n} [ {\hat p}]_{-\infty}^\infty + \epsilon \nabla_\pi \int_{-\infty}^\infty {\hat p} \,{\rm d} \nu . \end{equation}
Writing  ${\hat p}$ in terms of derivatives with respect to
 $n$, as appropriate for the external solution, we find
 \begin{equation} [{\hat p}]_{-\infty}^\infty = [ p_0 ]_{-\infty}^\infty + \epsilon \left[ \frac{\gamma}{2} \left( \left( \frac{\partial \rho}{\partial n}\right)^2 + |\nabla_\pi \rho |^2\right) - \gamma \rho \left( \frac{\partial^2 \rho}{\partial n^2} + \frac{\partial \rho}{\partial n} \nabla_\pi \boldsymbol{\cdot} \boldsymbol{n} + \nabla_\pi^2 \rho\right) \right]_{-\infty}^\infty , \end{equation}
that is,
 \begin{equation} [{\hat p}]_{-\infty}^\infty = [ p_0 ]_{-\infty}^\infty. \end{equation}
Concerning the surface gradient, to leading order,
 \begin{equation} \epsilon \nabla_\pi \int_{-\infty}^\infty {\rm d} \nu \, \left(p_0 + \frac{\gamma}{2 \epsilon} \left( \frac{\partial \rho}{\partial \nu} \right)^2 - \gamma \rho \frac{1}{\epsilon} \frac{\partial^2 \rho}{\partial \nu^2} \right). \end{equation}
Assuming local thermodynamic equilibrium across the interface, from the uniformity of the (generalised) chemical potential (Magaletti et al. Reference Magaletti, Gallo, Marino and Casciola2016, Reference Magaletti, Gallo and Casciola2021),
 \begin{equation} \mu_f = \mu_{f}^b - \lambda \nabla^2 \rho = {\mu_f}_{eq}^b , \end{equation}
using the thin layer approximation  $\nabla ^2 \rho = {1}/{\epsilon ^2} \partial ^2 \rho /\partial \nu ^2$, it follows
 \begin{equation} \frac{\lambda}{\epsilon} \frac{\partial^2 \rho}{\partial \nu^2} = \epsilon (\mu_f^b - {\mu_f}_{eq}^b). \end{equation}
After multiplying by  $1/\epsilon \partial \rho /\partial \nu$,
 \begin{equation} \frac{\lambda}{\epsilon^2} \frac{\partial \rho}{\partial \nu}\frac{\partial^2 \rho}{\partial \nu^2} = (\mu_f^b - {\mu_f}_{eq}^b) \frac{\partial \rho}{\partial\nu} , \end{equation}
and realising that the left-hand side is  $\lambda /(2 \epsilon ^2) \partial /\partial \nu ((\partial \rho /\partial \nu )^2)$, rearranging the right-hand side as
 \begin{equation} (\mu_f^b - {\mu_f}_{eq}^b) \frac{\partial \rho}{\partial \nu} = \frac{\partial}{\partial \nu} (f_f^b - {\mu_f}_{eq}^b \rho ) = \frac{\partial w_0}{\partial \nu} , \end{equation}
where  $w_0 = f_f^b - {\mu _f}_{eq}^b \rho$, integration yields
 \begin{equation} \frac{\lambda}{2 \epsilon^2} \left(\frac{\partial \rho}{\partial \nu}\right)^2 = w_0 - {\bar w}_0, \end{equation}
where  ${\bar w}_0$ is a suitable integration constant to be identified. Inserting (B19) and (B22) in (B17) leads to
 \begin{align} &\nabla_\pi \int_{-\infty}^\infty {\rm d} \nu \, \left(\epsilon p_0 + \frac{\gamma}{2} \left(\frac{\partial \rho}{\partial \nu} \right)^2 - \gamma \rho \frac{\partial^2 \rho}{\partial \nu^2} \right) \nonumber\\ &\quad =\epsilon \nabla_\pi \int_{-\infty}^\infty {\rm d} \nu \, (p_0 + (w_0 - {\bar w}_0 ) - \rho (\mu_f^b - {\mu_f}_{eq}^b )) = {{O}}(\epsilon). \end{align}
Combining together the partial results, one finally obtains
 \begin{equation} \int \boldsymbol{\nabla} {\hat p} \,{\rm d}n = [p_0]_{-\infty}^\infty \boldsymbol{n}. \end{equation}
In conclusion, in the sharp interface limit,
 \begin{equation} \int \boldsymbol{\nabla} \boldsymbol{\cdot} \boldsymbol{T}_{rev} \,{\rm d}n ={-} [p_0]_{-\infty}^\infty \boldsymbol{n} + \nabla_\pi \sigma - \kappa \sigma \boldsymbol{n}. \end{equation}
Thus, the interfacial layer, as seen by the external solution, appears as the locus of a concentrated force, leading to the well-known sharp interface form of the momentum conservation equation
 \begin{equation} \frac{\partial{\rho\boldsymbol{u}}}{\partial t}+\boldsymbol{\nabla}\boldsymbol{\cdot}(\rho\boldsymbol{u}\otimes\boldsymbol{u}) =\boldsymbol{\nabla}\boldsymbol{\cdot} \boldsymbol{T}_{visc} - \boldsymbol{\nabla} p_0 + \nabla_\pi \sigma \delta(n) - \kappa \delta(n) \sigma \boldsymbol{n} . \end{equation}
It is worth stressing that this result was reported in a slightly different derivation in Anderson et al. (Reference Anderson, McFadden and Wheeler1998). From the above equation, neglecting the Marangoni term  $\nabla _\pi \sigma$, the evolution of vorticity is found to be described by the equation (Magnaudet & Mercier Reference Magnaudet and Mercier2020)
 \begin{align} \frac{{\rm D}}{{\rm D}t}\left(\frac{\boldsymbol{\zeta}}{\rho}\right)&= \left(\frac{\boldsymbol{\zeta}}{\rho}\boldsymbol{\cdot}\boldsymbol{\nabla}\right)\boldsymbol{u} +\frac{1}{\rho^3}\boldsymbol{\nabla} p_0\times\boldsymbol{\nabla}\rho - \frac{1}{\rho}\boldsymbol{\nabla}\left(\frac{\sigma \kappa}{\rho}\right) \nonumber\\ &\quad \times \delta(n)\boldsymbol{n} +\frac{1}{\rho}\boldsymbol{\nabla}\times\left(\frac{1}{\rho}\boldsymbol{\nabla}\boldsymbol{\cdot} \boldsymbol{\varSigma}\right). \end{align}
It should be stressed, however, that some of the terms appearing in the vorticity equation above cancel out exactly when obtaining the vorticity equation in the diffuse interface context. The reason is that the effect of capillarity can be expressed in terms of the gradient of the (generalised) chemical potential,  $\boldsymbol {\nabla } \boldsymbol {\cdot } \boldsymbol {T}_{rev} = - \rho \boldsymbol {\nabla } \mu _f - s_f \boldsymbol {\nabla } \theta \boldsymbol {\nabla }$, as shown in § 3.1, an aspect discussed also in a recent paper by Chen, Wang & Liu (Reference Chen, Wang and Liu2024).


 Open access

