


Impact Statement
Desalination of seawater is a large and growing source of potable water on which many communities in arid regions are dependent. Maintaining the total dissolved solids (TDS) content of this water within regulated levels is important for maintaining public confidence in the quality of the water supply. Water with low TDS is corrosive to transmission and distribution systems and has an undesirable taste. The Saudi Water Authority is committed to meeting the regulated lower bound for TDS in the most cost-effective manner possible, and this work outlines several case studies of different strategies employed at desalination plants within the Kingdom of Saudi Arabia in order to make this information publicly available for the assistance of operators of desalination plants worldwide.
1. Introduction
While provision of clean water for drinking, hygiene, and other purposes is a critical part of modern civilisation, removal of 100% of dissolved solids from water is undesirable. Pure water with a low mineral content has an unpalatable ‘flat’ taste and has potentially negative impacts on human health, with reported associations with cardiovascular disease and other disorders for water deficient in calcium and magnesium [Reference Wang, Qiu and Zeng1]. The specific mechanisms of these associations remain unclear. Pure water is also highly corrosive to concrete and many metals [Reference Cotruvo and Bartram2, Reference Catling, Abubakar, Lake, Swift and Hunter3]. For these reasons, most jurisdictions mandate a minimum concentration of total dissolved solids (TDS) in potable water. In the Kingdom of Saudi Arabia, for example, the minimum guideline concentration for TDS in potable water mandated by the Saudi Arabian Standards Organisation (SASO) is 100 ppm [Reference Al-Hamzah and Fellows4].
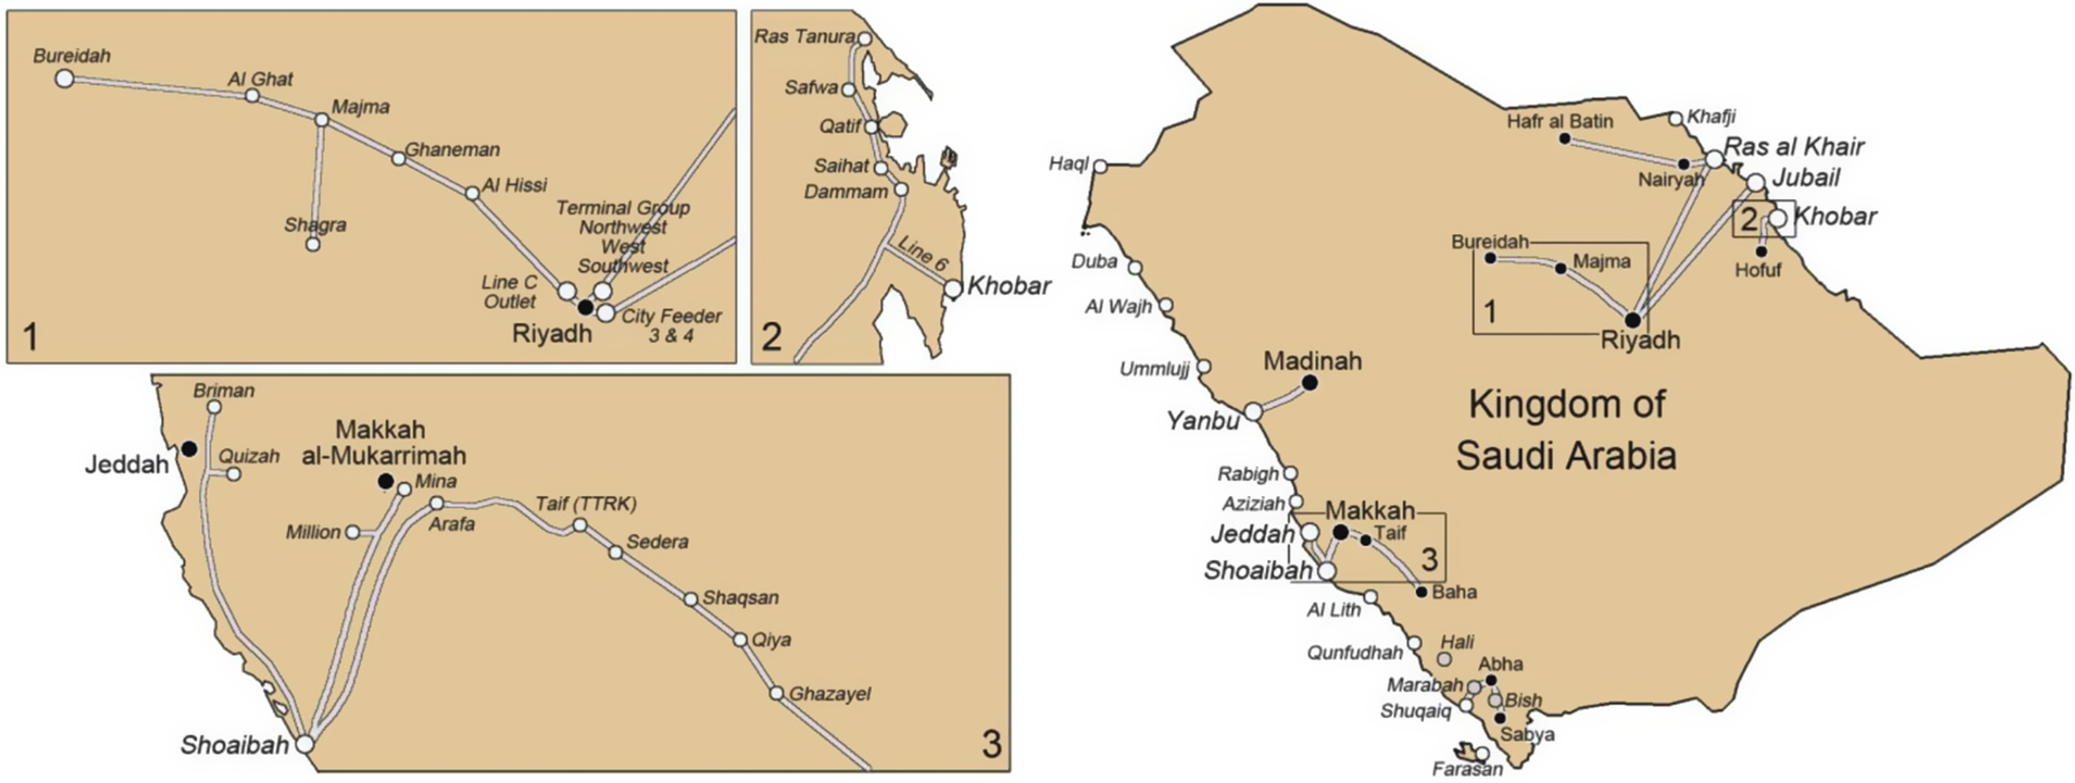
Seawater desalination is the main source of potable water in the Kingdom of Saudi Arabia, and if operating according to design, produces water with very low TDS. Approximately 10 million m3 of potable water are produced daily, with a large proportion of the production being transported hundreds of kilometres to inland population centres (Figure 1). This combination of large production volumes from seawater desalination and long transmission distances is unique in the world. Before transmission, calcium and hydrogen carbonate ions are added in post-treatment to raise calcium and alkalinity in the produced water, with the quantity added adjusted to give an appropriate Langelier Saturation Index (LSI) to avoid corrosion of transmission and distribution pipelines [Reference Bajahlan and Wie5, Reference Asrar, Al Sahari, Al Enazi, Al Radhi and Al Ghamdi6]. The LSI model is currently used in transportation systems to estimate the ability of transported water to form a layer of calcium carbonate deposits, which helps protect the cement lining of the pipelines from corrosion during water transport [Reference Langelier7]. This model is easy to apply, requiring only five variables to calculate the LSI value: pH, TDS, temperature, calcium concentration, and total alkalinity. However, this model only considers the thermodynamic favourability of calcium carbonate formation and does not consider any other chemical reactions potentially relevant to pipeline corrosion. A useful complement to the LSI is the Larson–Skold index, which is the molar ratio of the anionic charge of chloride and sulfate (ions potentially involved in corrosion) to the anionic charge of carbonate and hydrogen carbonate [Reference Larson and Skold8].
Water production and transmission system in the Kingdom of Saudi Arabia indicating locations mentioned in this report. Reproduced with permission from Al-Hamzah and Fellows, ‘Drinking water quality in the Kingdom of Saudi Arabia’, Water, 2024, 16, (13), pp. 1810 [Reference Al-Hamzah and Fellows4].

Figure 1. Long description
The image consists of four panels. The main panel on the right shows a map of the Kingdom of Saudi Arabia with water pipelines connecting coastal desalination plants to inland cities. Major hubs include Yanbu and Jeddah on the West coast, and Ras al Khair, Jubail, and Khobar on the East coast. Pipelines lead inland to Madinah, Makkah, and Riyadh. Three rectangular areas are numbered 1, 2, and 3, corresponding to the detailed inset panels on the left.
Panel 1, at the top-left, shows the network around Riyadh. A main line runs from Bureidah in the Northwest through Al Ghat, Majma, Ghaneman, and Al Hissi to Riyadh. A branch from Majma leads South to Shagra. Riyadh serves as a central hub with connections to Terminal Group Northwest, West, Southwest, Line C Outlet, and City Feeder 3 and 4.
Panel 2, at the top-center, details the Eastern coastal line near Khobar. The pipeline runs North to South through Ras Tanura, Safwa, Qatif, Saihat, Dammam, and Line 6, ending at Khobar.
Panel 3, at the bottom-left, details the Western network. A major line originates at Shoaibah on the coast, branching North to Jeddah, Briman, and Quizah. Another branch goes Northeast to Makkah al-Mukarrimah, Mina, Million, Arafa, and Taif (T T R K). From Taif, the line continues Southeast through Sedera, Shaqsan, Qiya, and Ghazayel.
Typically, thermal methods of desalination (Multiple Effect Distillation, MED, and Multi-Stage Flash, MSF) produce water with a lower TDS than membrane-based desalination methods (Seawater Reverse Osmosis, SWRO). In general, low TDS values are an issue primarily with water produced from thermal desalination; as the operation of SWRO plants in the Kingdom of Saudi Arabia tends to produce water with relatively high TDS, exceeding upper TDS values is the more significant issue for water produced by SWRO desalination [Reference Al-Hamzah and Fellows4]. However, optimised SWRO systems may also produce water that fails to meet minimum TDS levels, especially if a second pass is carried out to reduce boron levels below regulatory limits.
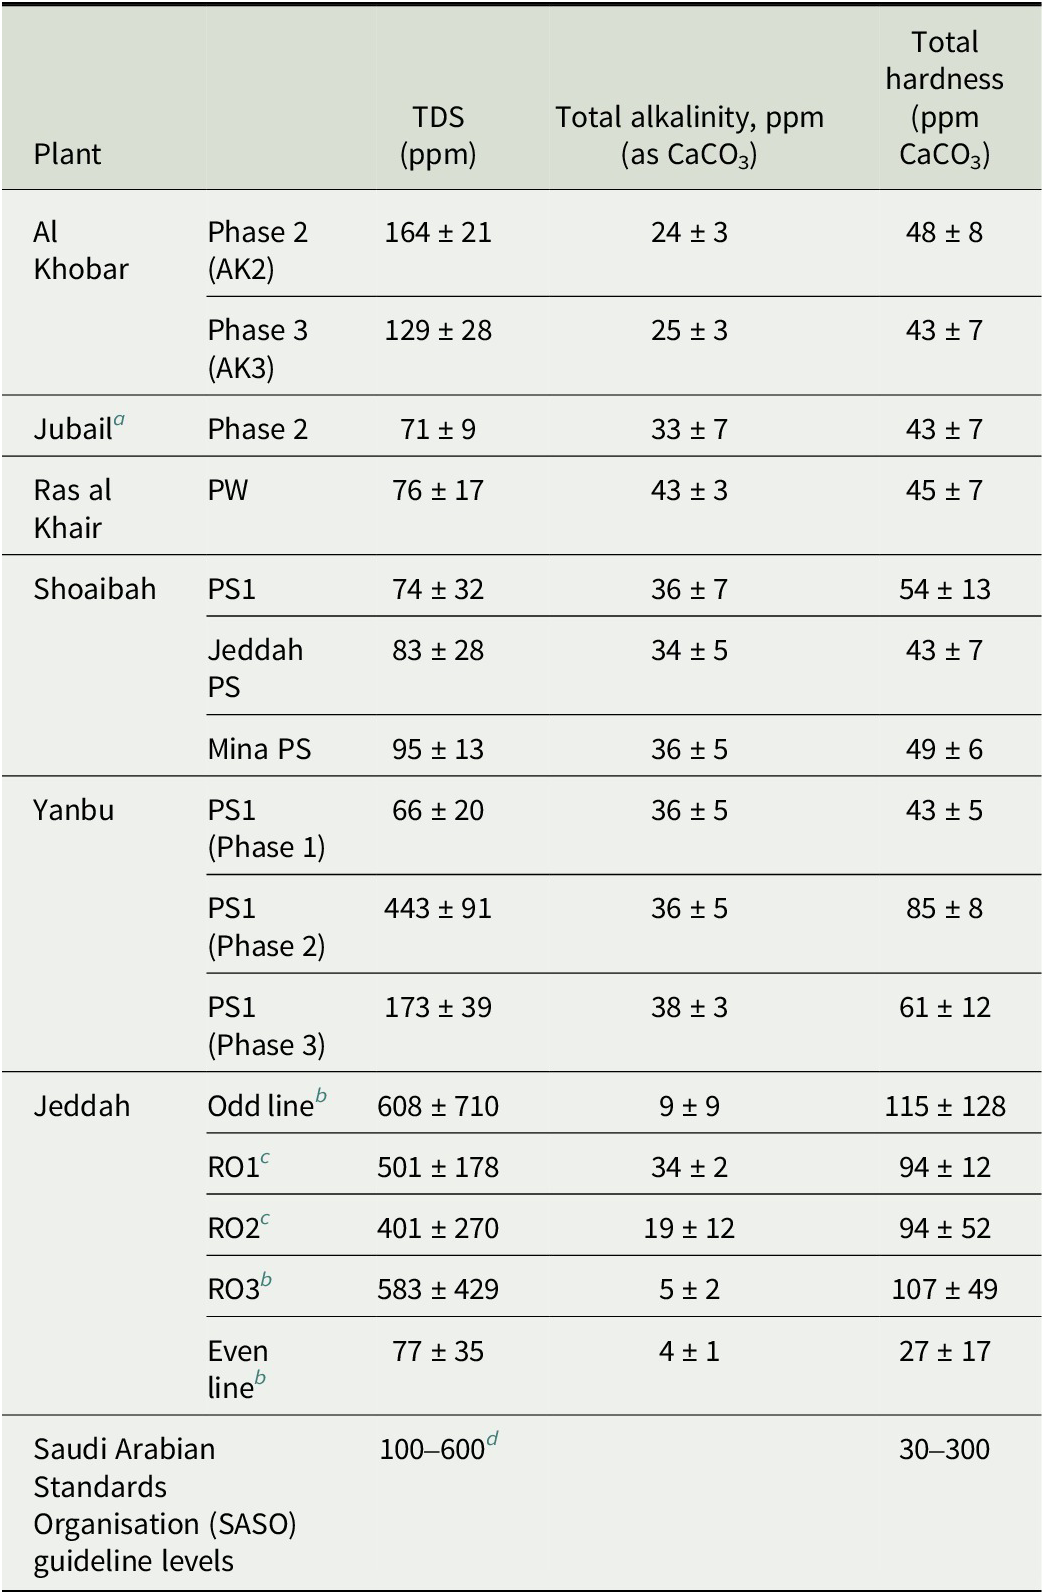
Representative values for the water produced at a number of desalination plants and locations in the transmission system are given in Table 1. Unless otherwise noted, all values given are measured after remineralisation of the product water with carbon dioxide and calcium carbonate in limestone contactors. Several of the plants listed in Table 1 readily achieve TDS values exceeding the minimum. For example, the MSF plant Al Khobar Ph2, where TDS of produced water is higher than 100 ppm due to the high TDS of seawater in the intake area for the Al Khobar plant (54,300 ± 2300 ppm) compared with typical Arabian Gulf Seawater (TDS ~ 45,000 ppm) [Reference Al-Hamzah, Fellows and Fellows11]. At other locations, water from different sources with differing TDS is mixed so that the value in the final product exceeds the minimum. This includes sites such as Al Jubail, where desalination product water is mixed with groundwater before transmission, or Yanbu, where transmitted water is produced with a mix of SWRO and thermal desalination. However, there are also a number of sites where low TDS water production is dominant, and the water transmitted to consumers has not typically met the minimum TDS specifications. In Table 1, these are Ras al Khair and the pumping stations leading downline from the Shoaibah desalination plant campus. At Ras al Khair approximately 70% of production is MSF and 30% SWRO. At Shoaibah, there are a large number of plants feeding into a complex storage and transmission system, with an aggregate production that is approximately 80% MSF and 20% SWRO, with up to 90,000 m3 day−1 (an additional 5%) added seasonally from surface water (Hali dam). The Shoaibah pumping stations listed in Table 1 all draw primarily water produced by MSF.
Selected water quality parameters at selected sites in the Kingdom of Saudi Arabia, measured between 6th January and 17th February 2019.

Table 1. Long description
The table contains five columns: Plant, Phase/Station, T D S (p p m), Total alkalinity p p m (as C a C O sub 3), and Total hardness (p p m C a C O sub 3).
* Al Khobar: Phase 2 (A K 2) has T D S 164 plus or minus 21, alkalinity 24 plus or minus 3, hardness 48 plus or minus 8. Phase 3 (A K 3) has T D S 129 plus or minus 28, alkalinity 25 plus or minus 3, hardness 43 plus or minus 7.
* Jubail: Phase 2 has T D S 71 plus or minus 9, alkalinity 33 plus or minus 7, hardness 43 plus or minus 7.
* Ras al Khair: P W has T D S 76 plus or minus 17, alkalinity 43 plus or minus 3, hardness 45 plus or minus 7.
* Shoaibah: P S 1 has T D S 74 plus or minus 32, alkalinity 36 plus or minus 7, hardness 54 plus or minus 13. Jeddah P S has T D S 83 plus or minus 28, alkalinity 34 plus or minus 5, hardness 43 plus or minus 7. Mina P S has T D S 95 plus or minus 13, alkalinity 36 plus or minus 5, hardness 49 plus or minus 6.
* Yanbu: P S 1 (Phase 1) has T D S 66 plus or minus 20, alkalinity 36 plus or minus 5, hardness 43 plus or minus 5. P S 1 (Phase 2) has T D S 443 plus or minus 91, alkalinity 36 plus or minus 5, hardness 85 plus or minus 8. P S 1 (Phase 3) has T D S 173 plus or minus 39, alkalinity 38 plus or minus 3, hardness 61 plus or minus 12.
* Jeddah: Odd line has T D S 608 plus or minus 710, alkalinity 9 plus or minus 9, hardness 115 plus or minus 128. R O 1 has T D S 501 plus or minus 178, alkalinity 34 plus or minus 2, hardness 94 plus or minus 12. R O 2 has T D S 401 plus or minus 270, alkalinity 19 plus or minus 12, hardness 94 plus or minus 52. R O 3 has T D S 583 plus or minus 429, alkalinity 5 plus or minus 2, hardness 107 plus or minus 49. Even line has T D S 77 plus or minus 35, alkalinity 4 plus or minus 1, hardness 27 plus or minus 17.
* Saudi Arabian Standards Organisation (S A S O) guideline levels: T D S 100 to 600, Total hardness 30 to 300.
a Product water is mixed with spring water to increase TDS before transmission.
b Non-remineralised.
c Remineralised by addition of hydrated lime and carbon dioxide.
d Note that because of the high corrosivity of excessive chloride and sulfate ions, the Saudi Water Authority has a guideline of maximum TDS = 130 ppm and maximum Cl− = 25 ppm and maximum SO42− = 2 ppm [Reference Fellows, Al-Hamzah, Al-Naem, Benlamri and Filho9] and a mandated maximum of 200 ppm introduced in 2023 for produced and transmitted water from desalination plants [10]. These concentrations of individual ions are key to managing corrosion, but are not systematically reported by the plants and must in many cases be inferred from seawater composition, alkalinity, and TDS.
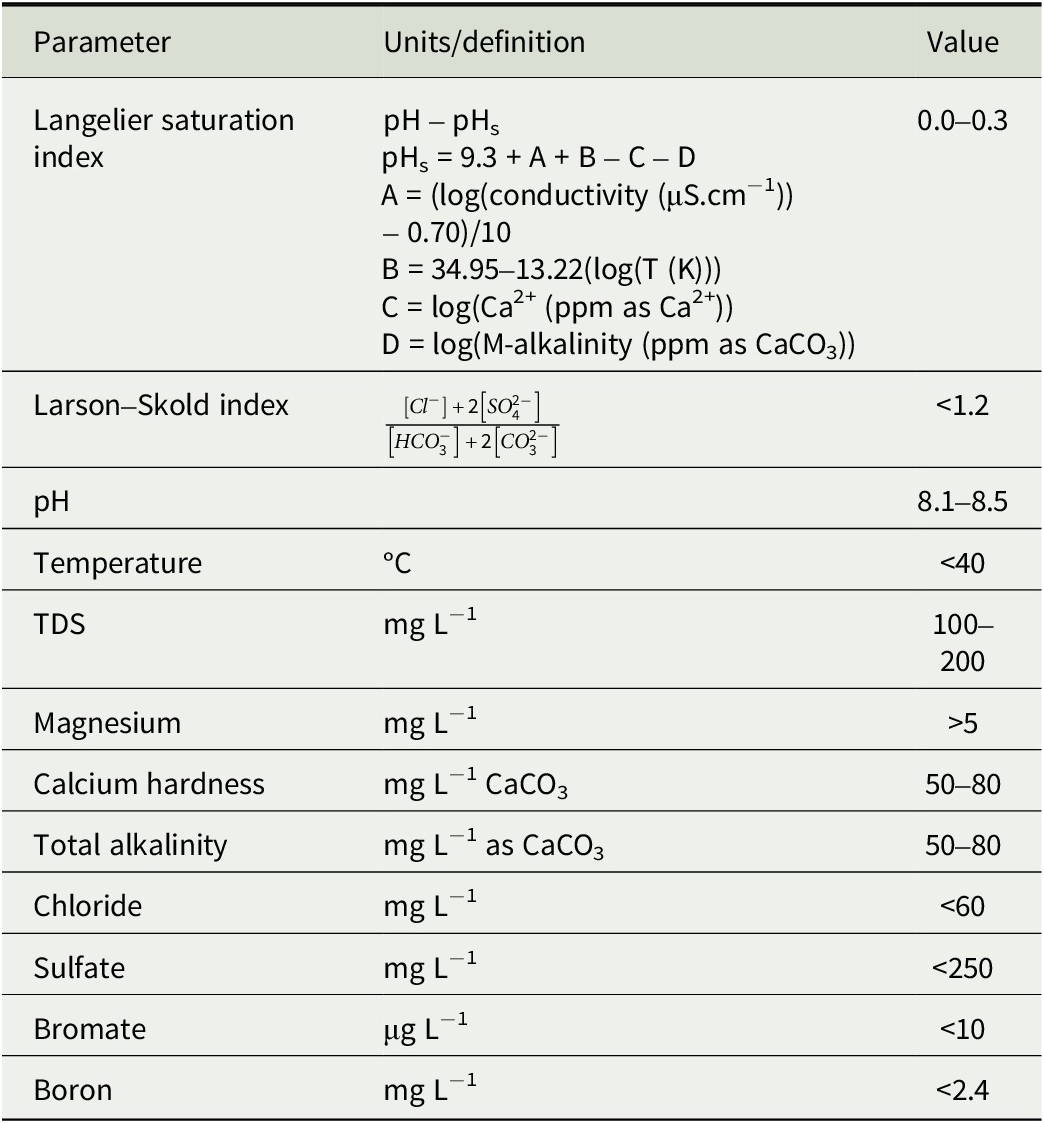
Increasing TDS in water produced from thermal desalination plants (MSF & MED) can be potentially achieved by a number of strategies. These are: (1) Adding seawater (typically 0.5–0.75 litres per cubic metre of produced water); (2) Addition of groundwater with a higher TDS (typically several hundred litres per cubic metre of produced water) [Reference Rudnik, Rabinovich and Katz13]; (3) Increasing the amount of carbon dioxide at a given residence time in the post-treatment, thus increasing the concentration of calcium and hydrogen carbonate ions; (4) Installing an alternative remineralisation method that gives more rapid dissolution, such as use of the micronised limestones produced by Omya International and Lhoist [Reference Hasson, Fine, Sagiv, Semiat and Shemer14, Reference Shih, Sutherland, Sessions, Mackey and Walker15]; (5) For increasing TDS in water produced from reverse osmosis and dual-use plants (reverse osmosis + thermal plants), the additional strategy of reduction of 2nd pass RO may be employed. In any particular case, combinations of these strategies may be advisable. Application of any method for increasing TDS is constrained by the need to simultaneously fulfil the other key quality parameters for water quality mandated by SASO and the Saudi Water Authority (SWA) code for the activity of transporting desalinated and purified water (Table 2).
Mandated water quality requirements for desalinated seawater [10].

Table 2. Long description
The table consists of three columns: Parameter, Units/definition, and Value.
* Langelier saturation index: Defined as pH minus pH sub s. pH sub s equals 9.3 plus A plus B minus C minus D. A equals (log(conductivity (mu S cm super -1)) minus 0.70)/10. B equals 34.95 minus 13.22(log(T (K))). C equals log(Ca super 2+ (ppm as Ca super 2+)). D equals log(M-alkalinity (ppm as CaCO sub 3)). Required value is 0.0 to 0.3.
* Larson-Skold index: Defined by the formula: Numerator [Cl super -] + 2[SO sub 4 super 2-] all over denominator [HCO sub 3 super -] + 2[CO sub 3 super 2-]. Required value is less than 1.2.
* pH: Required value is 8.1 to 8.5.
* Temperature: Units in degrees Celsius. Required value is less than 40.
* T D S: Units in mg L super -1. Required value is 100 to 200.
* Magnesium: Units in mg L super -1. Required value is greater than 5.
* Calcium hardness: Units in mg L super -1 CaCO sub 3. Required value is 50 to 80.
* Total alkalinity: Units in mg L super -1 as CaCO sub 3. Required value is 50 to 80.
* Chloride: Units in mg L super -1. Required value is less than 60.
* Sulfate: Units in mg L super -1. Required value is less than 250.
* Bromate: Units in mu g L super -1. Required value is less than 10.
* Boron: Units in mg L super -1. Required value is less than 2.4.
Note: Larson–Skold approximation is from Fellows and Al-Hamzah [12].
The goal of this work is to identify the most cost-effective means of meeting TDS targets in desalinated product water while maintaining all other quality parameters within acceptable levels. In this report, the implementation of various strategies for simultaneously meeting all water quality requirements at a number of sites within the water production, transmission, and distribution system overseen by the SWA is described, with discussion of the advantages and disadvantages of different strategies.
An ideal strategy for increasing TDS will balance the following criteria: human health, meeting lower limits for calcium and magnesium while maintaining bromate levels below 10 ppb and boron levels below 2.4 ppm; protection of existing water transport systems, giving an LSI in the range of 0.0 to 0.3 and Larson–Skold value below 1.2; technical feasibility; and economic feasibility.
2. Materials and Methods
Water samples were collected on dates between 2019 and 2025 at desalination plants operating in the Kingdom of Saudi Arabia (Figure 1): Khafji, Ras Al Khair, and Al Khobar on the Arabian Gulf coast and Shoaibah on the Red Sea coast. Different plants carried out different sample regimens at different times, with quality parameters typically measured between two and six times per day. Analysis of the parameters of interest for this study was carried out on site (pH, TDS, T, total hardness) or within three weeks of collection in the laboratories of the Water Technologies Innovation Institute and Research Advancement (WTIIRA) of the SWA in Al Jubail, Kingdom of Saudi Arabia. On site, total hardness was measured by Hach total hardness kits (HA-71A, Hach-MENA, Dubai, UAE) and TDS by conductivity using an empirical factor of 0.52 mg·cm L−1 μS−1 for waters of conductivity <300 μS cm−1 and 0.55 mg·cm L−1 μS−1 for waters of conductivity between 300 and 800 μS cm−1, based on over a hundred samples collected of product water at Ras al Khair, Shoiabah, Al Jubail, and Al Khobar desalination plants. At the WTIIRA laboratories, the on-site measurements were validated parameters were measured using standard methods as follows.
pH: AWWA Standard Method #4500-H+ B/ASTM D1293 (Potentiometry using a standard hydrogen electrode).
Total Dissolved Solids: ASTMD1193 (Gravimetry).
Total Hardness: AWWA Standard Method #2340/ASTM D1126 (EDTA titration).
Residual Chlorine: AWWA Standard Method #4500-Cl D/ASTM D1253-14 (Direct amperometric titration). Limit of detection 3 ppb.
Bromate and Sulfate: AWWA Standard Method #4110 B/ASTM D6581 (Ion chromatography with chemical suppression of eluent conductivity. Limits of detection: Bromate 2 ppb, sulfate 50 ppb.
Boron, Calcium, Sodium: AWWA Standard Method #3120B (Inductively coupled plasma optical emission spectroscopy, ICP-OES). Limits of detection: Boron 1 ppb, Calcium 6 ppb, sodium 6 ppb.
3. TDS Increase in SWRO Plants
The TDS concentration in water produced from SWRO plants operating a second stage (often referred to as Brackish Water Reverse Osmosis, BWRO) may be increased by only passing a portion of the water produced from the first stage through the second stage, or by eliminating the second stage entirely. This approach has been applied in recent years to two sites in the SWA system, the Phase 4 SWRO plant at Shoaibah (RO4), and the Khafji SWRO plant (Figure 1).
There are several positive impacts of this approach. Besides the possibility of raising TDS to the approved value, reducing the amount of BWRO reduces the operating expenditure of water production. Reducing or eliminating BWRO in construction could also reduce capital costs, but this is not advisable as it reduces operational flexibility and may make it impossible to meet other water quality parameters. In particular, for the high salinity waters of the Arabian Gulf and Red Sea, boron is an element of concern. At ocean pH, boron is present primarily as uncharged boric acid, H3BO3, which readily passes through SWRO membranes, Once buffering carbonate species are removed from seawater, the pH can be increased to give ionised borate species which are readily rejected in BWRO; however, making the same pH adjustment before initial SWRO to reduce boron levels in product water below the 2.4 ppm mandated limit will require prohibitively expensive quantities of alkali. A critical issue with boron is the sensitivity of many common crops to boron levels in excess of 0.5 ppm, which will limit the re-use of municipal wastewater in agricultural applications [Reference Navarro-Pérez, Simón and Cámara-Zapata16]. Another potential issue is the likelihood of bromide ion concentration in product water exceeding 600 ppb, which is in turn likely to lead to bromate formation exceeding the regulatory limit (10 ppb) when hypochlorite is used as a disinfectant [Reference Alhamzah, Alofi, Abid and Fellows17]. Bromate formation is more likely at higher temperatures and longer periods of time in transmission and storage, and bromate levels exceeding regulated norms are a recurring issue in summer in Saudi Arabia at sites relying on water pumped significant distances inland [Reference Alhamzah, Alofi, Abid and Fellows17].
3.1. Shoaibah RO4 Plant
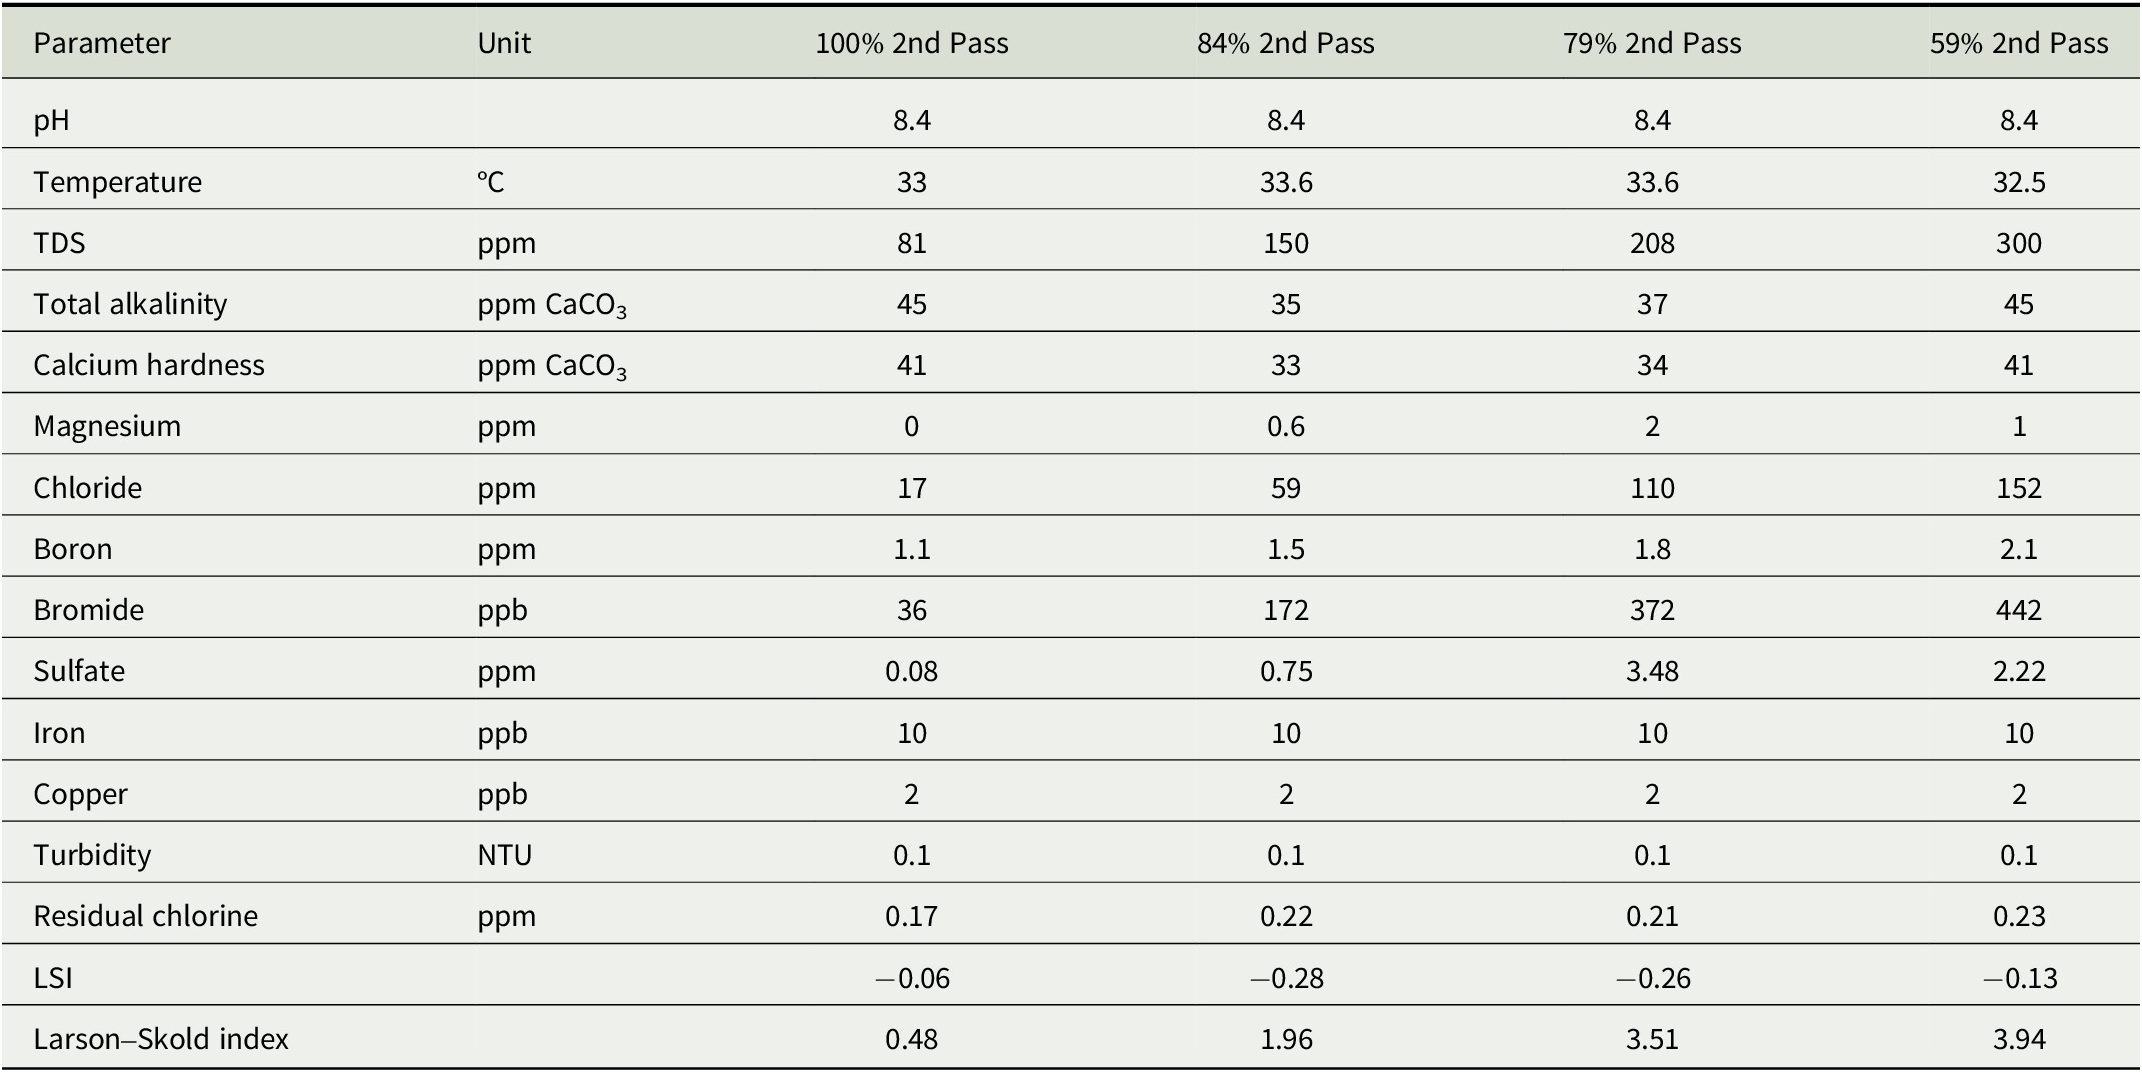
The Shoaibah RO4 plant began operation in 2020 with a total design capacity of 400,000 m3 per day and is one of the world’s largest SWRO plants. Between 26 and 30 November 2023, Shoaibah RO4 desalinated water plant was operated in turn with 100%, 84%, 79%, and 59% of the first-pass product water treated with BWRO (Table 3).
Values of key water quality parameters of remineralised product water at different operating ratios of the second stage of water produced from the Shoiabah RO4 SWRO plant.

Table 3. Long description
The table contains 16 parameters measured across four operating ratios: 100 percent 2nd Pass, 84 percent 2nd Pass, 79 percent 2nd Pass, and 59 percent 2nd Pass.
* p H: 8.4 across all ratios.
* Temperature in degrees Celsius: 33, 33.6, 33.6, and 32.5.
* T D S in p p m: 81, 150, 208, and 300.
* Total alkalinity in p p m C a C O sub 3: 45, 35, 37, and 45.
* Calcium hardness in p p m C a C O sub 3: 41, 33, 34, and 41.
* Magnesium in p p m: 0, 0.6, 2, and 1.
* Chloride in p p m: 17, 59, 110, and 152.
* Boron in p p m: 1.1, 1.5, 1.8, and 2.1.
* Bromide in p p b: 36, 172, 372, and 442.
* Sulfate in p p m: 0.08, 0.75, 3.48, and 2.22.
* Iron in p p b: 10 across all ratios.
* Copper in p p b: 2 across all ratios.
* Turbidity in N T U: 0.1 across all ratios.
* Residual chlorine in p p m: 0.17, 0.22, 0.21, and 0.23.
* L S I: minus 0.06, minus 0.28, minus 0.26, and minus 0.13.
* Larson-Skold index: 0.48, 1.96, 3.51, and 3.94.
Note that a relatively small reduction in the amount of first-pass water treated with BWRO is sufficient to bring TDS above the 100 ppm threshold value. At 84% second pass, a TDS of 150 ppm was obtained, with boron levels still far below the regulatory limit (1.5 cf. 2.4 ppm), chloride and sulfate levels also well below the recommended values, and a bromide level that is unlikely to give excessive bromate in properly managed transition lines. However, negative impacts are seen on both the LSI and Larson–Skold index, with values well outside the target ranges obtained. Provision of a larger fraction of first-pass product to the second pass (~95%) look likely to give TDS > 100 ppm and an acceptable Larson–Skold index, although the LSI will still fall below the acceptable range.
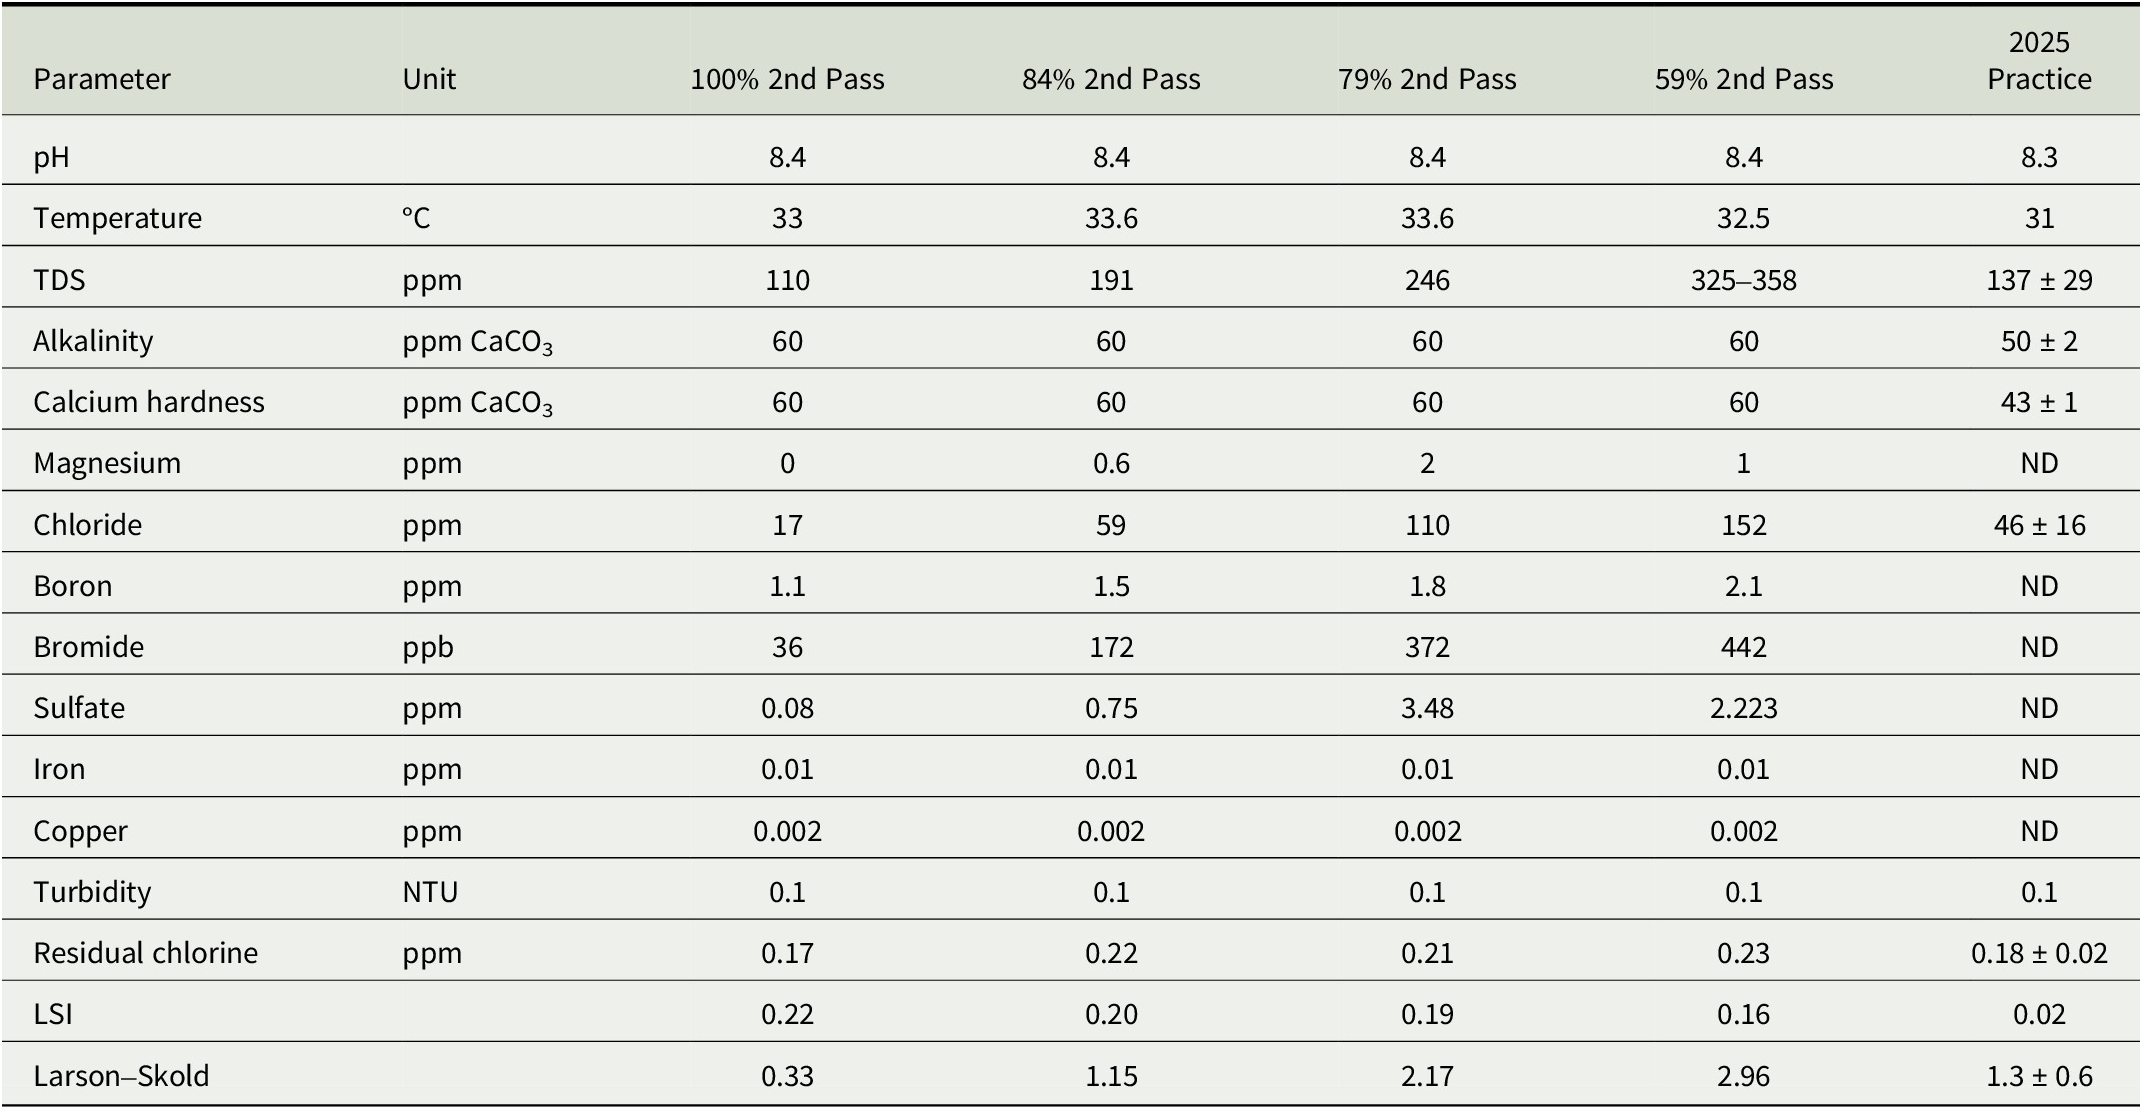
Increasing the extent of remineralisation is an alternative approach to achieve acceptable TDS, LSI, and Larson–Skold index values, with the predicted values of quality parameters with 60 ppm calcium hardness shown in Table 4. However, while reduction of BWRO will save costs, any increase in the extent of remineralisation will incur unavoidable increases in expenditure, either through increased use of carbon dioxide and sodium hydroxide, use of micronised limestone, or construction of additional limestone contactors. In the last column of Table 4, it can be seen how this has been balanced in practice at Shoaibah RO4 where a small reduction in the amount of second pass RO (to approximately 90%) is balanced with remineralisation to a lesser extent than 60 ppm CaCO3 equivalent, resulting in LSI and Larson–Skold index values that are just within acceptable limits.
Projected impact of reducing second pass RO combined with additional remineralisation at the Shoiabah RO4 plant. Data illustrating current practice at Shoaibah RO4 (November 2025) is shown in the last column of Table 4.

Table 4. Long description
The table consists of 7 columns: Parameter, Unit, 100% 2nd Pass, 84% 2nd Pass, 79% 2nd Pass, 59% 2nd Pass, and 2025 Practice.
Data rows include:
* p H: 8.4 for all R O passes; 8.3 for 2025 Practice.
* Temperature (degrees Celsius): 33, 33.6, 33.6, 32.5, and 31 respectively.
* T D S (p p m): 110, 191, 246, 325–358, and 137 plus or minus 29.
* Alkalinity (p p m C a C O sub 3): 60 for all R O passes; 50 plus or minus 2 for 2025 Practice.
* Calcium hardness (p p m C a C O sub 3): 60 for all R O passes; 43 plus or minus 1 for 2025 Practice.
* Magnesium (p p m): 0, 0.6, 2, 1, and N D.
* Chloride (p p m): 17, 59, 110, 152, and 46 plus or minus 16.
* Boron (p p m): 1.1, 1.5, 1.8, 2.1, and N D.
* Bromide (p p b): 36, 172, 372, 442, and N D.
* Sulfate (p p m): 0.08, 0.75, 3.48, 2.223, and N D.
* Iron (p p m): 0.01 for all columns; N D for 2025 Practice.
* Copper (p p m): 0.002 for all columns; N D for 2025 Practice.
* Turbidity (N T U): 0.1 for all columns.
* Residual chlorine (p p m): 0.17, 0.22, 0.21, 0.23, and 0.18 plus or minus 0.02.
* L S I: 0.22, 0.20, 0.19, 0.16, and 0.02.
* Larson–Skold: 0.33, 1.15, 2.17, 2.96, and 1.3 plus or minus 0.6.
Note: N D equals not determined.
Note: ND = not determined.
3.2. Khafji RO Plant
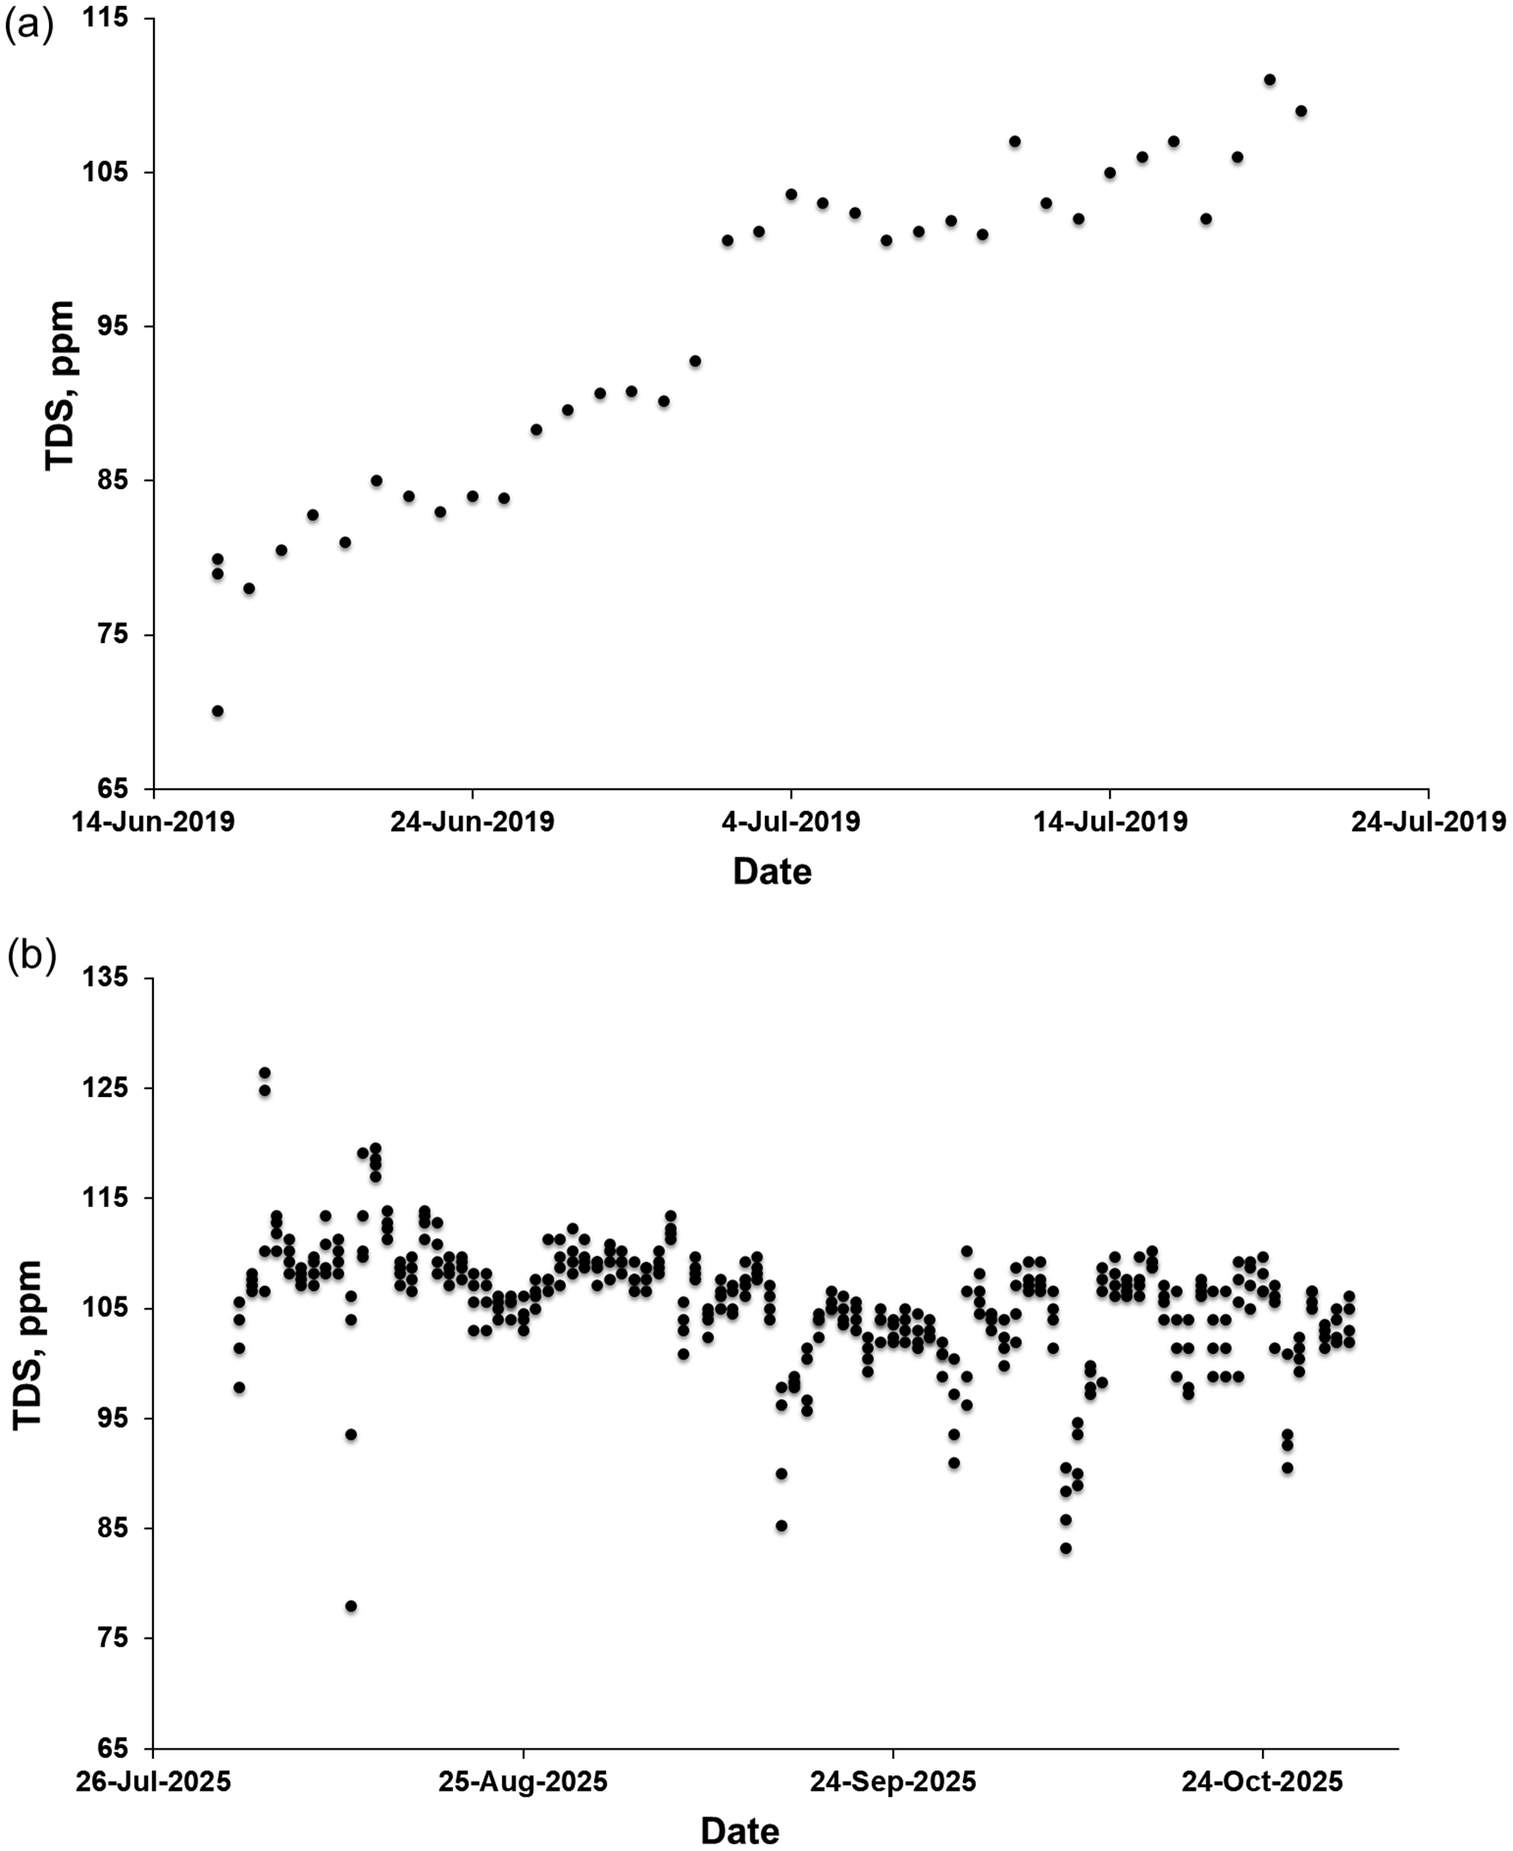
The SWRO plant at Khafji on the Arabian Gulf has a design capacity of 60,000 m3 day−1. It is not co-located with any thermal desalination plant and has no source of available groundwater. Historically, it has used efficient two-stage SWRO and BWRO to produce water with TDS below the 100 ppm guideline. In 2019, this plant reduced the fraction of permeate from SWRO going to BWRO by 25%, with a phased introduction over three weeks, increasing TDS from ~80 ppm to ~105 ppm (Figure 2). Current practice remains the same, giving a TDS of 105 ± 6 through August–October 2025.
(a) TDS increase at Khafji SWRO plant, 2019; (b) TDS values at Khafji SWRO plant, 2025.

Figure 2. Long description
The figure consists of two vertically stacked scatter plots labeled a and b.
Panel a: The X-axis is labeled Date, ranging from 14-Jun-2019 to 24-Jul-2019. The Y-axis is labeled T D S, p p m, ranging from 65 to 115. The data points show a clear linear increase over time. Starting at approximately 70 to 80 p p m in mid-June, the values rise steadily, reaching between 105 and 110 p p m by late July.
Panel b: The X-axis is labeled Date, ranging from 26-Jul-2025 to 24-Oct-2025. The Y-axis is labeled T D S, p p m, ranging from 65 to 135. The data points are much more densely packed and show high variability compared to panel a. While most values cluster between 100 and 115 p p m, there are significant fluctuations and outliers, including a sharp drop toward 78 p p m in early August and several dips below 95 p p m in September and October. Unlike the first plot, there is no clear upward or downward trend, but rather a sustained high concentration with frequent volatility.
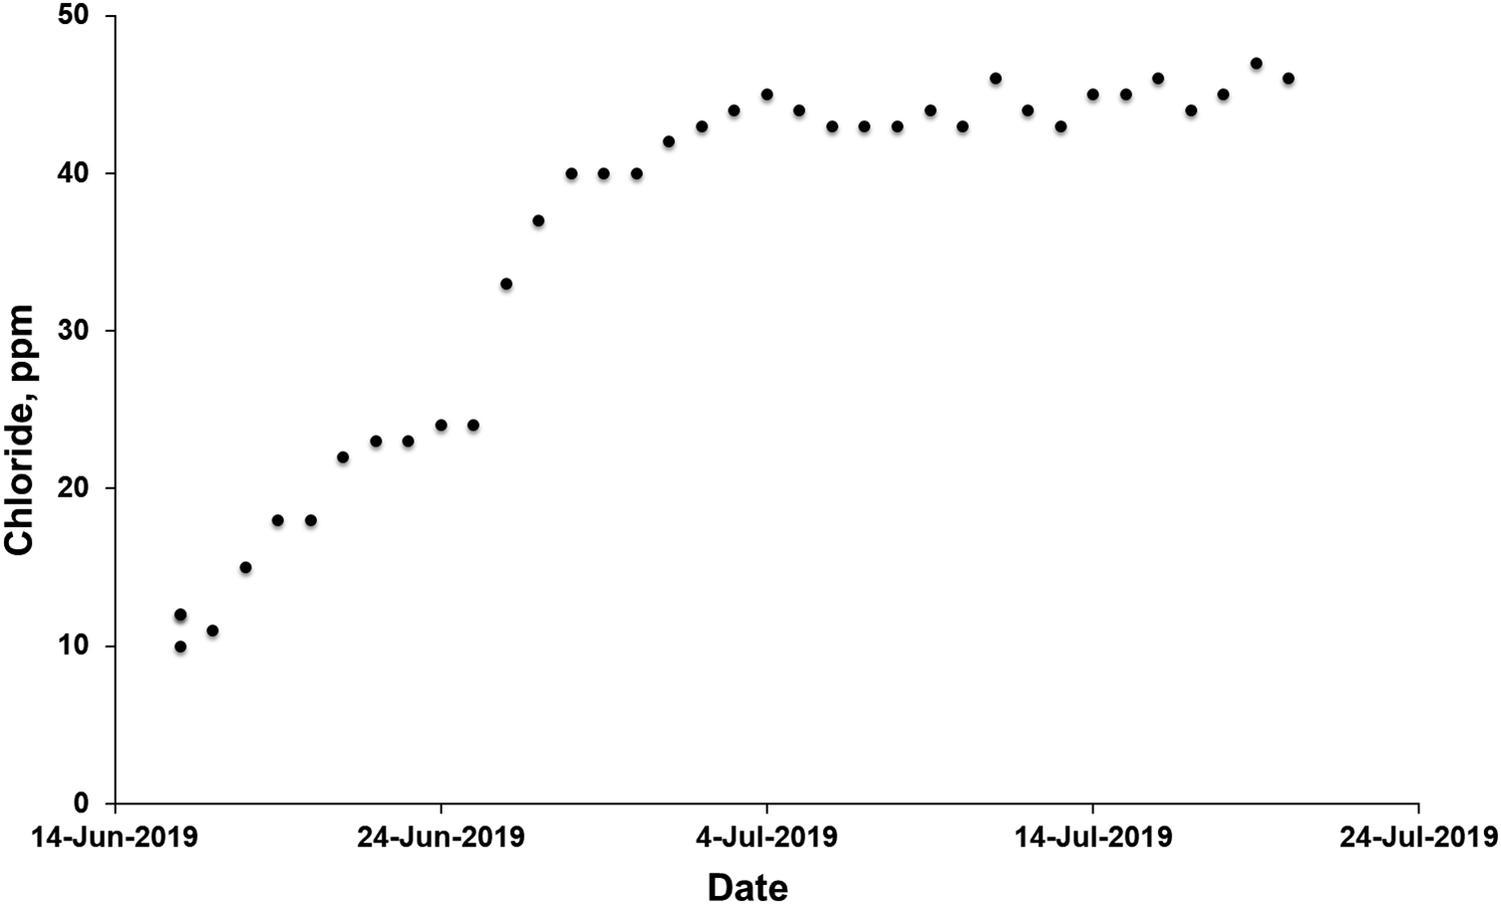
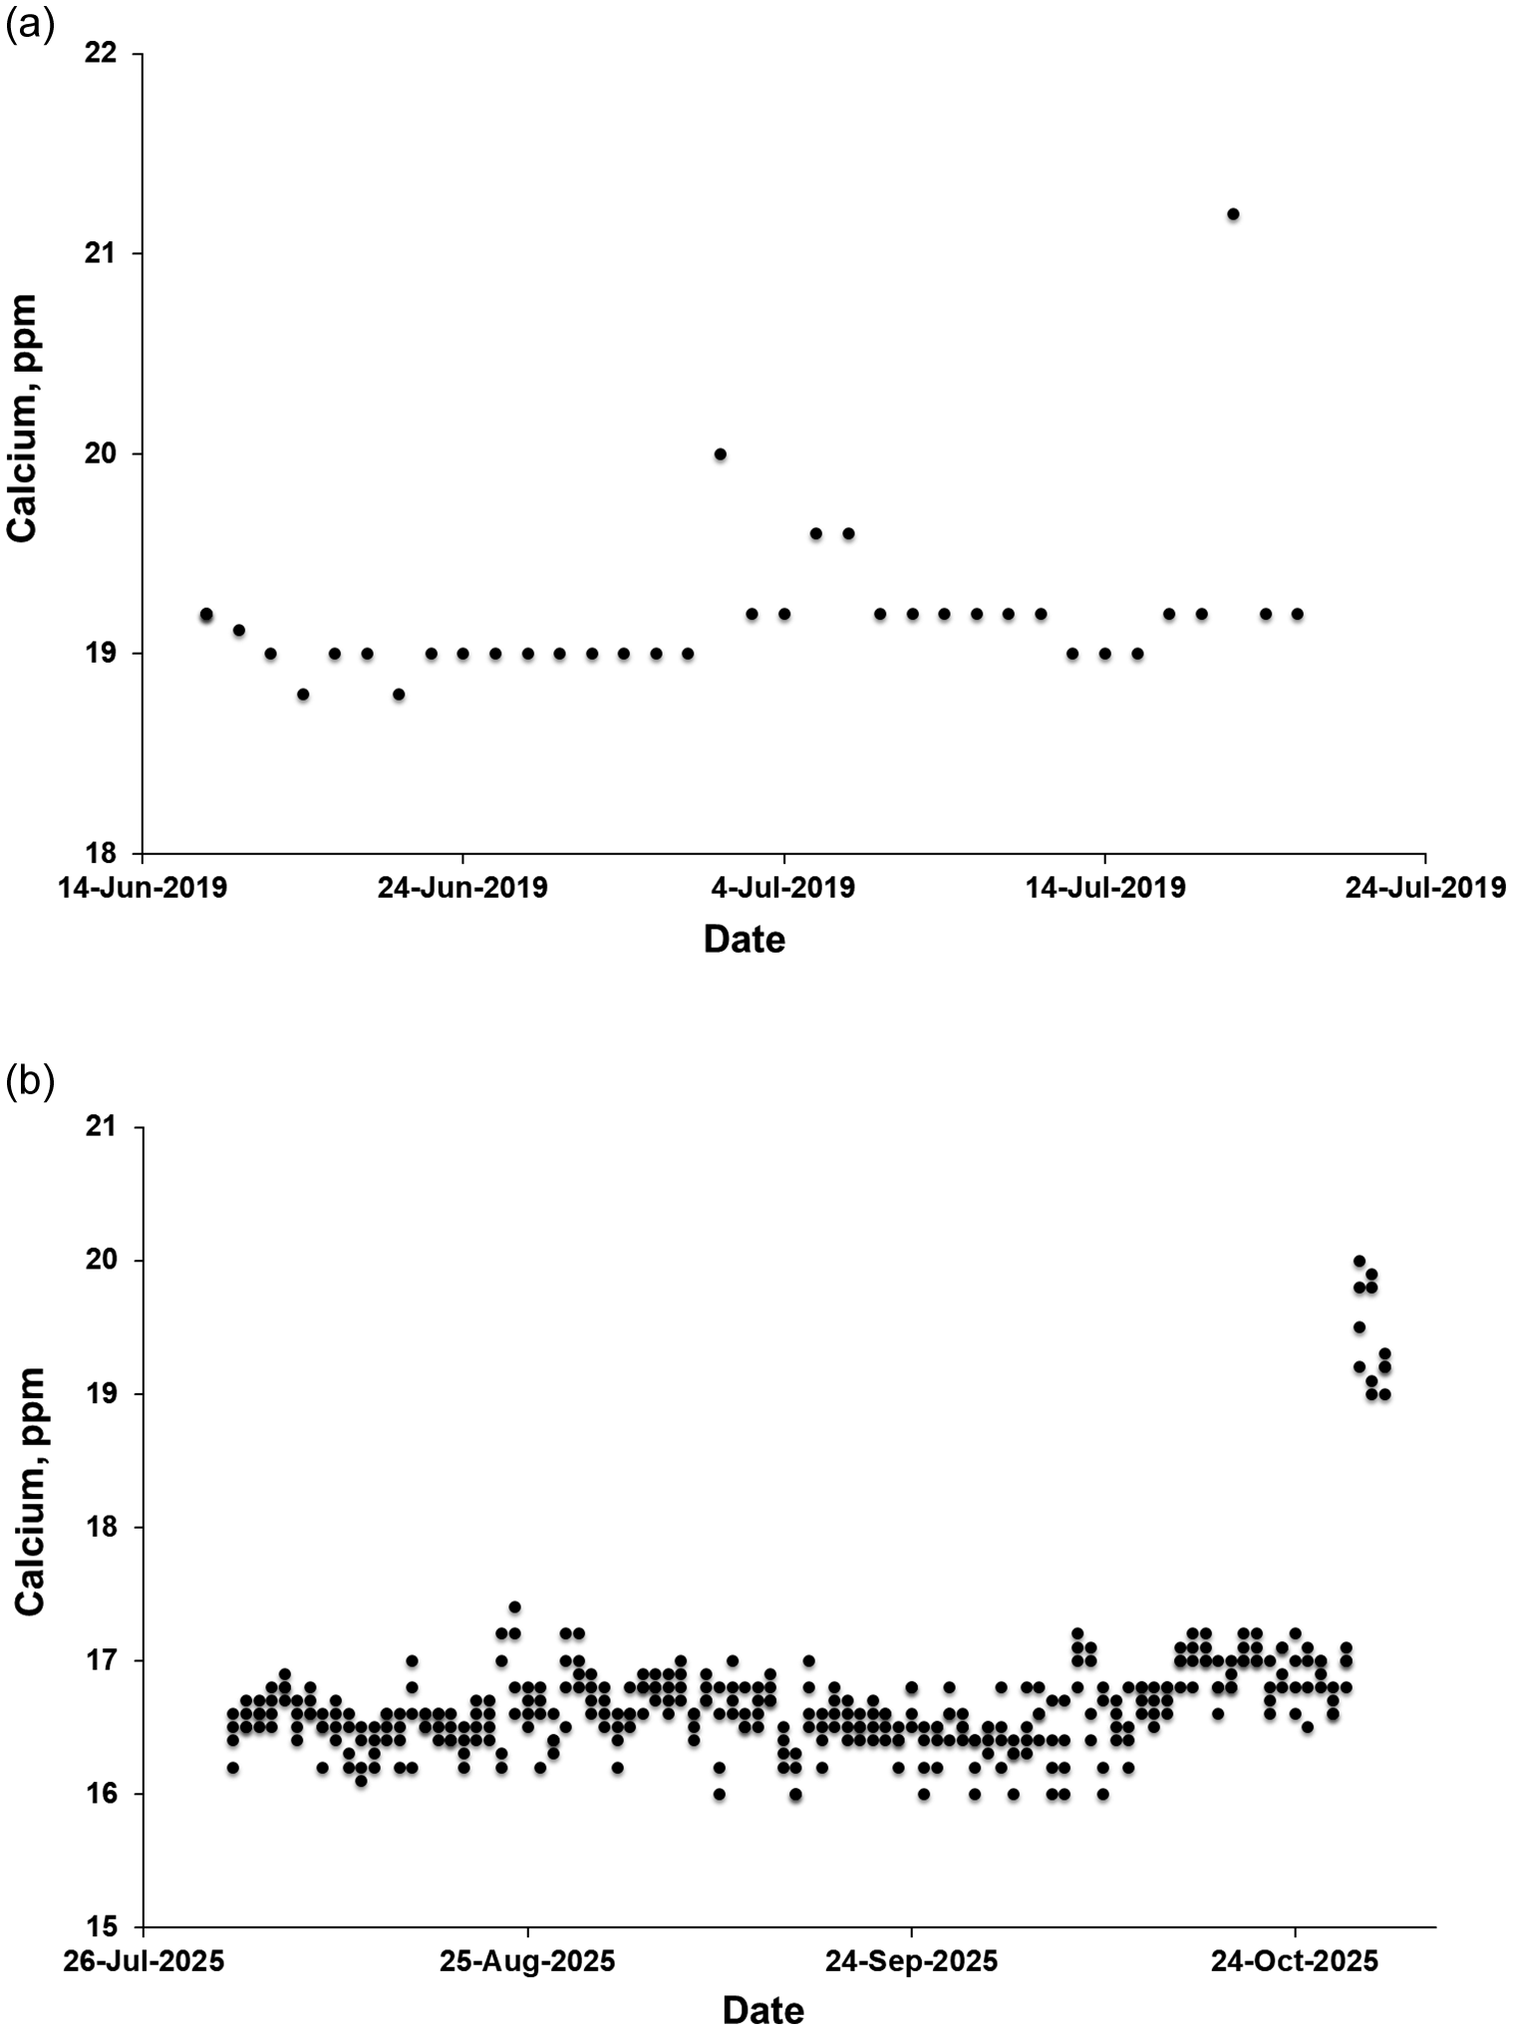
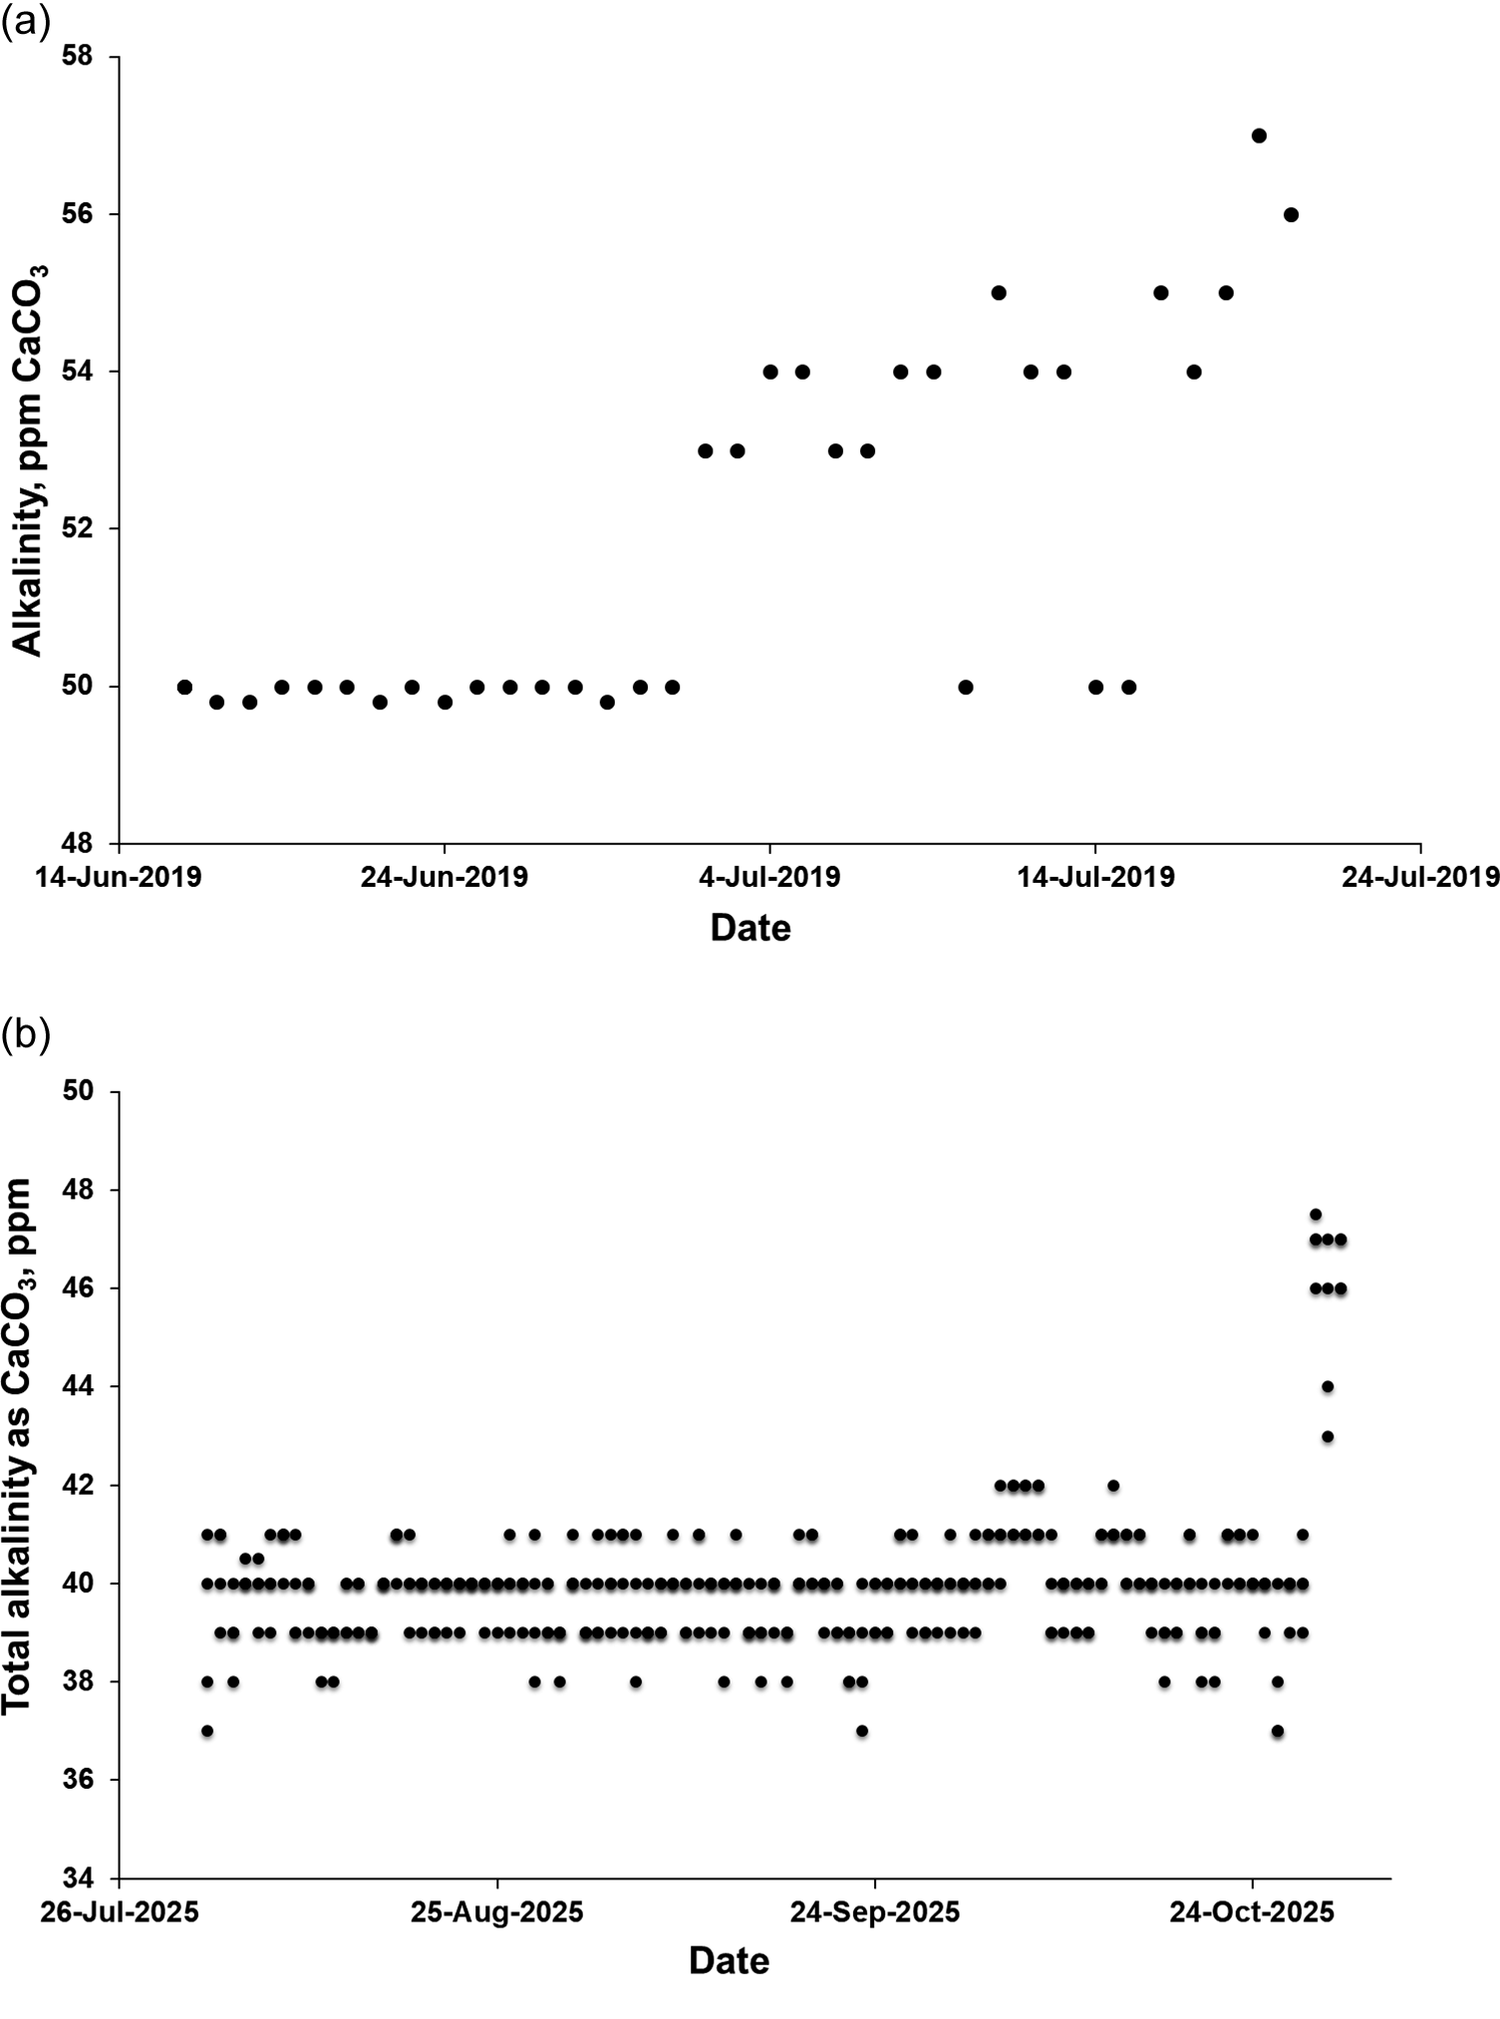
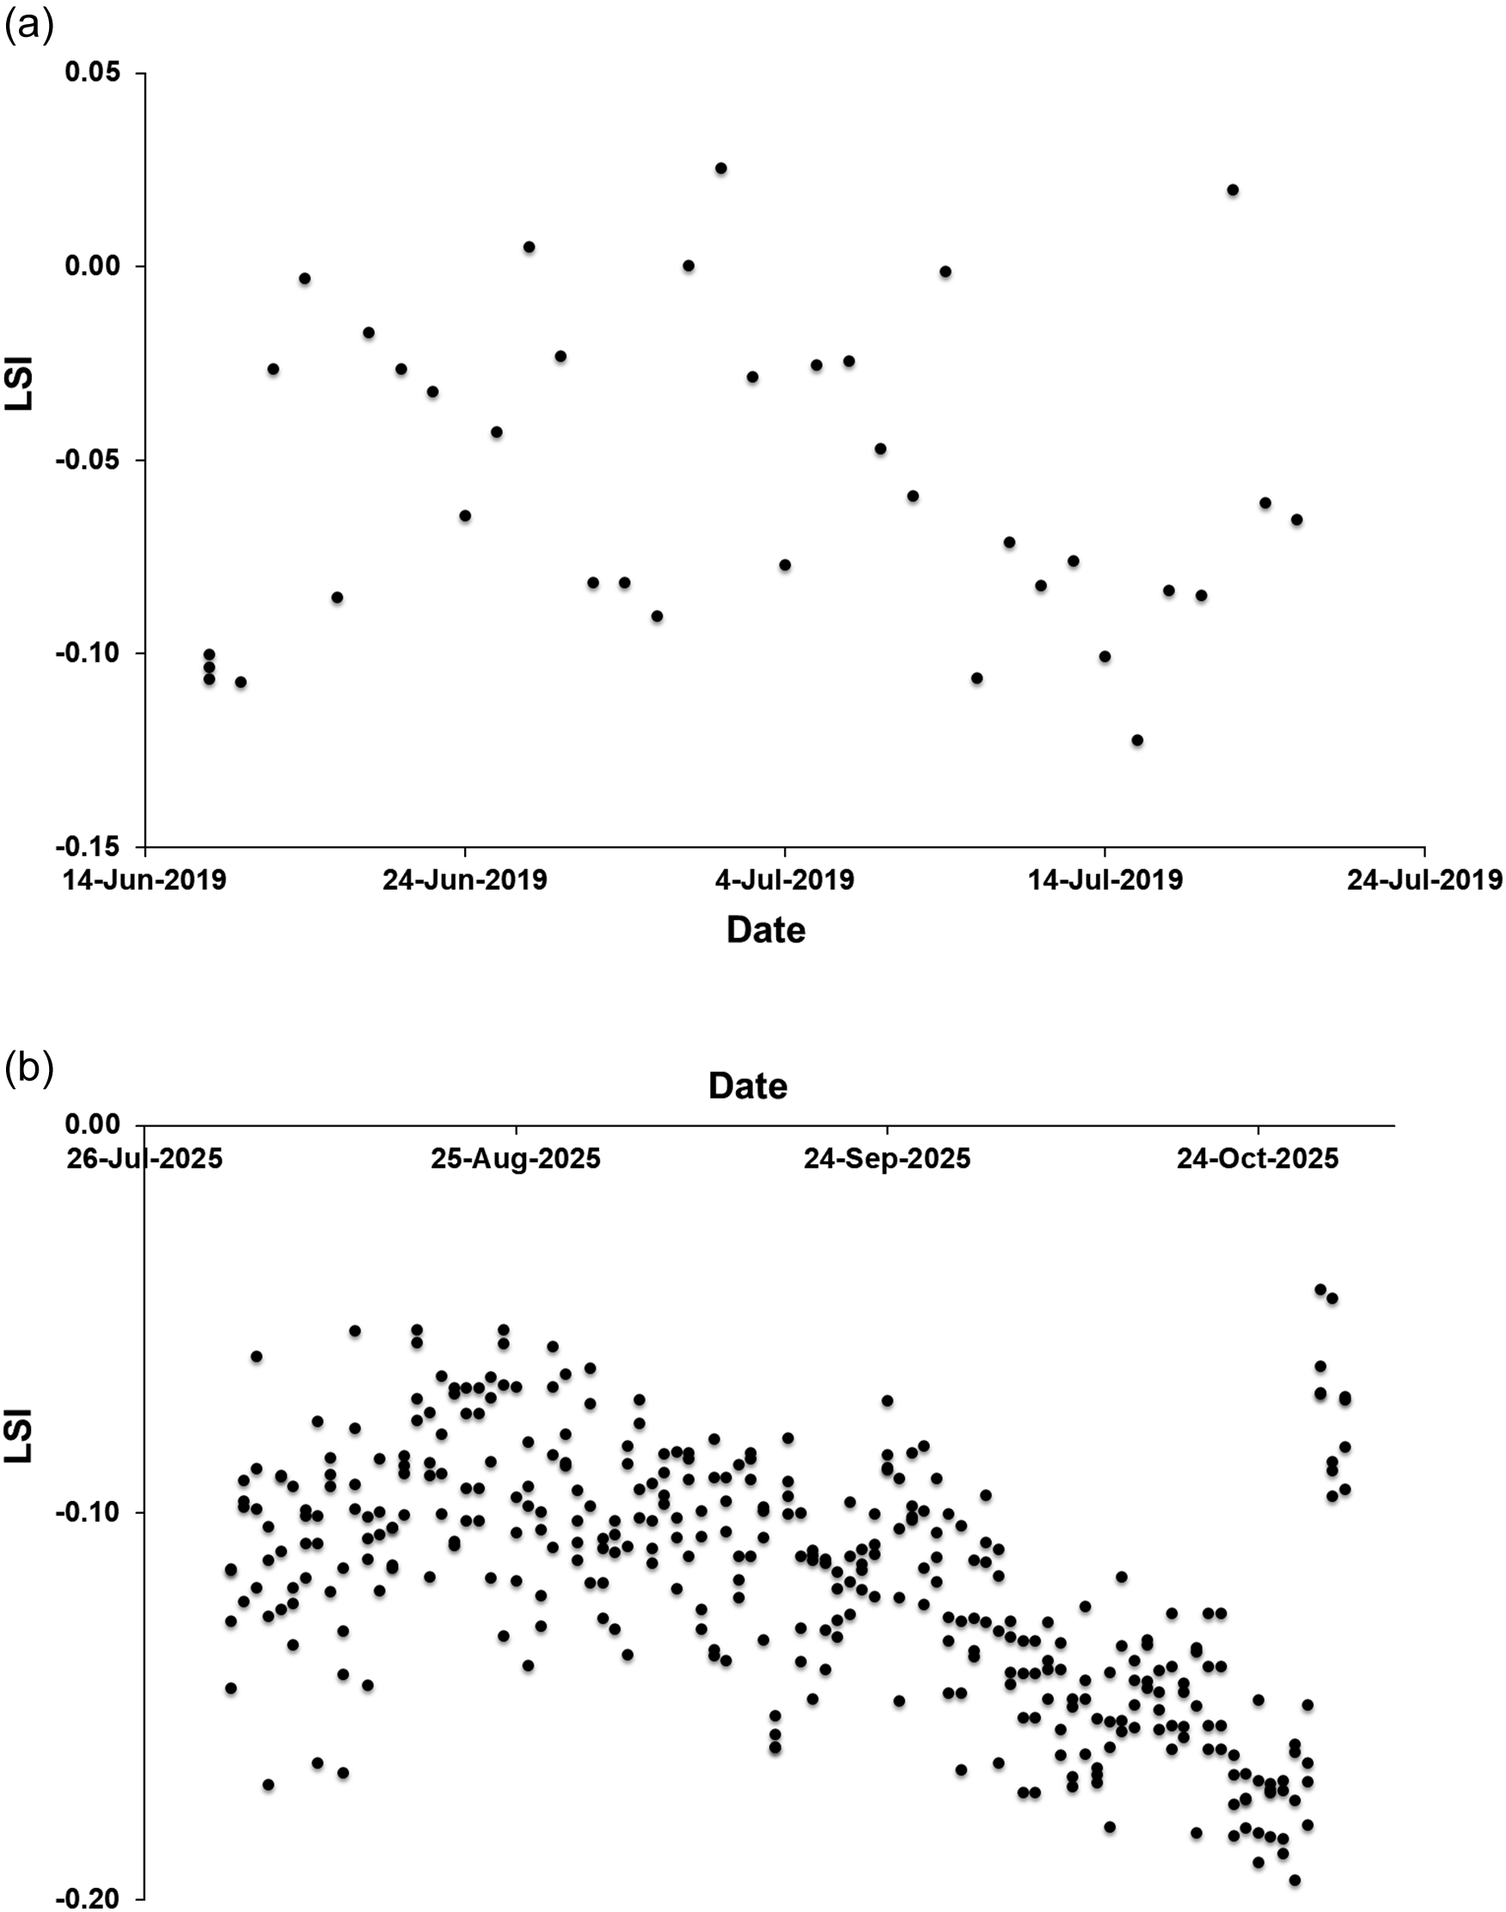
This increase in TDS was accompanied, as expected, by an increase in chloride concentration, which remained well below the maximum concentration guideline (Figure 3). Overall calcium concentration did not change significantly with the reduction of BWRO (Figure 4), but there was a small but significant increase in alkalinity (Figure 5). There was no significant overall change in LSI (Figure 6).
Chloride increase at Khafji SWRO plant.

Figure 3. Long description
The x-axis is labeled Date, ranging from 14-Jun-2019 to 24-Jul-2019 in ten-day increments. The y-axis is labeled Chloride, p p m, with a scale from 0 to 50 in increments of 10.
Data flow analysis:
* From June 14 to June 24, chloride levels show a steady linear increase from approximately 10 p p m to 24 p p m.
* Between June 24 and July 4, there is a sharp upward inflection point where values jump from 24 p p m to 40 p p m within a few days.
* From July 4 through July 24, the data enters a stabilization phase, fluctuating narrowly between 43 p p m and 47 p p m, forming a horizontal asymptotic trend at the higher concentration level.
Calcium concentration (mg L−1) for product water at Khafji SWRO plant; (a) period of introduction of reduced BWRO, 2019; (b) Values in August–December 2025.

Figure 4. Long description
Two vertically stacked scatter plots labeled a and b.
Panel a
The Y axis is Calcium, p p m ranging from 18 to 22. The X axis is Date from 14-Jun-2019 to 24-Jul-2019. Most data points are tightly clustered in a horizontal line at 19 p p m. There are three distinct outliers above the baseline: one at 20 p p m in early July, two at 19.6 p p m in mid-July, and one peak at 21.2 p p m in late July.
Panel b
The Y axis is Calcium, p p m ranging from 15 to 21. The X axis is Date from 26-Jul-2025 to 24-Oct-2025. The data shows a much higher density of measurements compared to panel a. The majority of points fluctuate between 16 and 17 p p m throughout August, September, and October. At the far right of the plot, corresponding to late October, there is a sudden vertical cluster of points rising sharply to between 19 and 20 p p m.
Alkalinity (mg L−1 as CaCO3) at Khafji SWRO plant for product water; (a) period of increase, 2019; (b) levels in August–October 2025.

Figure 5. Long description
Two scatter plots arranged vertically.
Panel a: Alkalinity, p p m C a C O sub 3 versus Date in 2019.
* The Y-axis ranges from 48 to 58 in increments of 2.
* The X-axis spans from 14-Jun-2019 to 24-Jul-2019.
* Data trend: From mid-June to early July, values are stable at approximately 50. Starting around 4-Jul-2019, there is a step-wise increase, with values rising to between 53 and 55, eventually peaking near 57 by late July.
Panel b: Total alkalinity as C a C O sub 3, p p m versus Date in 2025.
* The Y-axis ranges from 34 to 50 in increments of 2.
* The X-axis spans from 26-Jul-2025 to 24-Oct-2025.
* Data trend: For the majority of the period from late July through mid-October, the data points are densely clustered between 38 and 42 p p m, showing a highly stable horizontal band. In the final week of October, there is a sharp vertical spike where alkalinity levels jump abruptly to reach between 46 and 48 p p m.
LSI variation at Khafji SWRO plant (a) over the period of time of introduction of reduced BWRO; (b) in August–October 2025.

Figure 6. Long description
Panel a is a scatter plot with the y-axis labeled L S I ranging from minus 0.15 to 0.05 and the x-axis labeled Date from 14-Jun-2019 to 24-Jul-2019. The data points are sparse and fluctuate between minus 0.12 and 0.03 with no clear linear trend.
Panel b is a scatter plot with the y-axis labeled L S I ranging from minus 0.20 to 0.00 and the x-axis labeled Date from 26-Jul-2025 to 24-Oct-2025. The data density is much higher than in panel a. From late July to late August, the points cluster between minus 0.05 and minus 0.15. Starting in September, there is a visible downward trend, with L S I values decreasing toward minus 0.20 by late October, followed by a small cluster of higher values near minus 0.05 at the very end of the period.
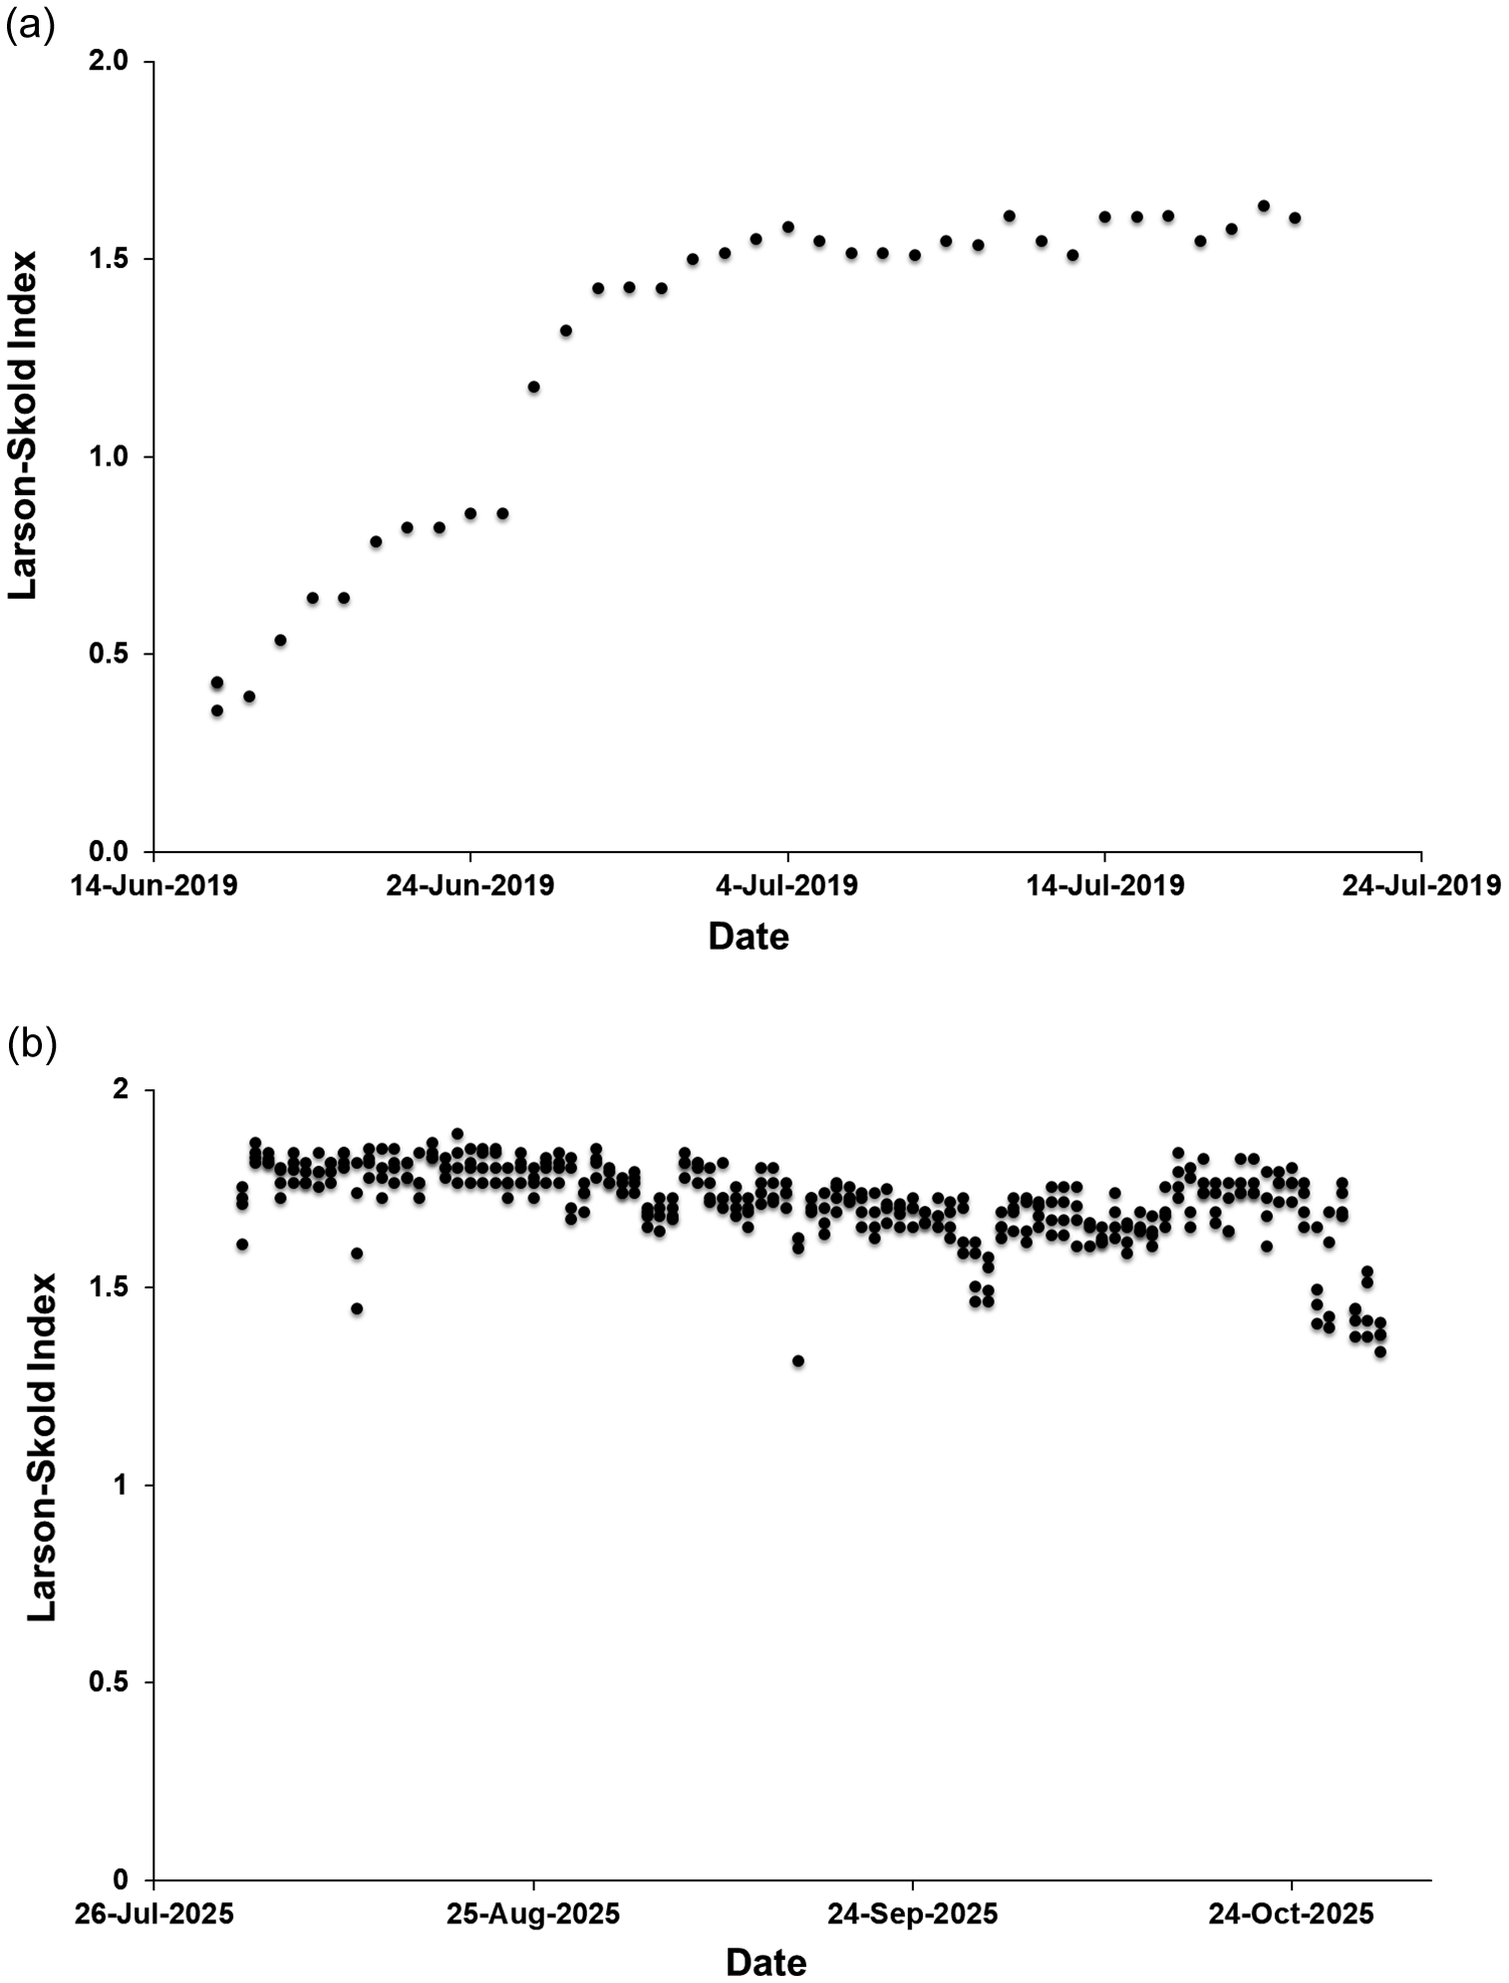
In 2025, a reduction in calcium (Figure 4b) and alkalinity (Figure 5b) is reflected in a reduced LSI (Figure 6b) and increased Larson–Skold index (Figure 7b), suggesting a potentially increased risk of corrosion after the reduction of the BWRO.
Estimated Larson–Skold index variation at Khafji SWRO plant (a) over the period of time of introduction of reduced BWRO and (b) in August–October 2025.

Figure 7. Long description
The image consists of two vertically stacked scatter plots labeled (a) and (b).
Panel (a) displays the Larson-Skold Index on the Y-axis ranging from 0.0 to 2.0 against Date on the X-axis from 14-Jun-2019 to 24-Jul-2019. The data points show a clear upward trend. Starting at approximately 0.4 in mid-June, the index rises steadily to about 0.8 by 24-Jun-2019. There is a sharp increase in late June, reaching a plateau around 1.5 by early July. For the remainder of July, the index fluctuates slightly but remains stable between 1.5 and 1.6.
Panel (b) displays the Larson-Skold Index on the Y-axis ranging from 0 to 2 against Date on the X-axis from 26-Jul-2025 to 24-Oct-2025. The data points are densely clustered, showing a relatively stable but slightly declining trend. Most values are concentrated between 1.6 and 1.9. There are a few outliers below 1.5. Towards the end of October 2025, there is a noticeable downward shift, with the index values dropping to between 1.3 and 1.5.
4. TDS Increase in Dual Stage Plants
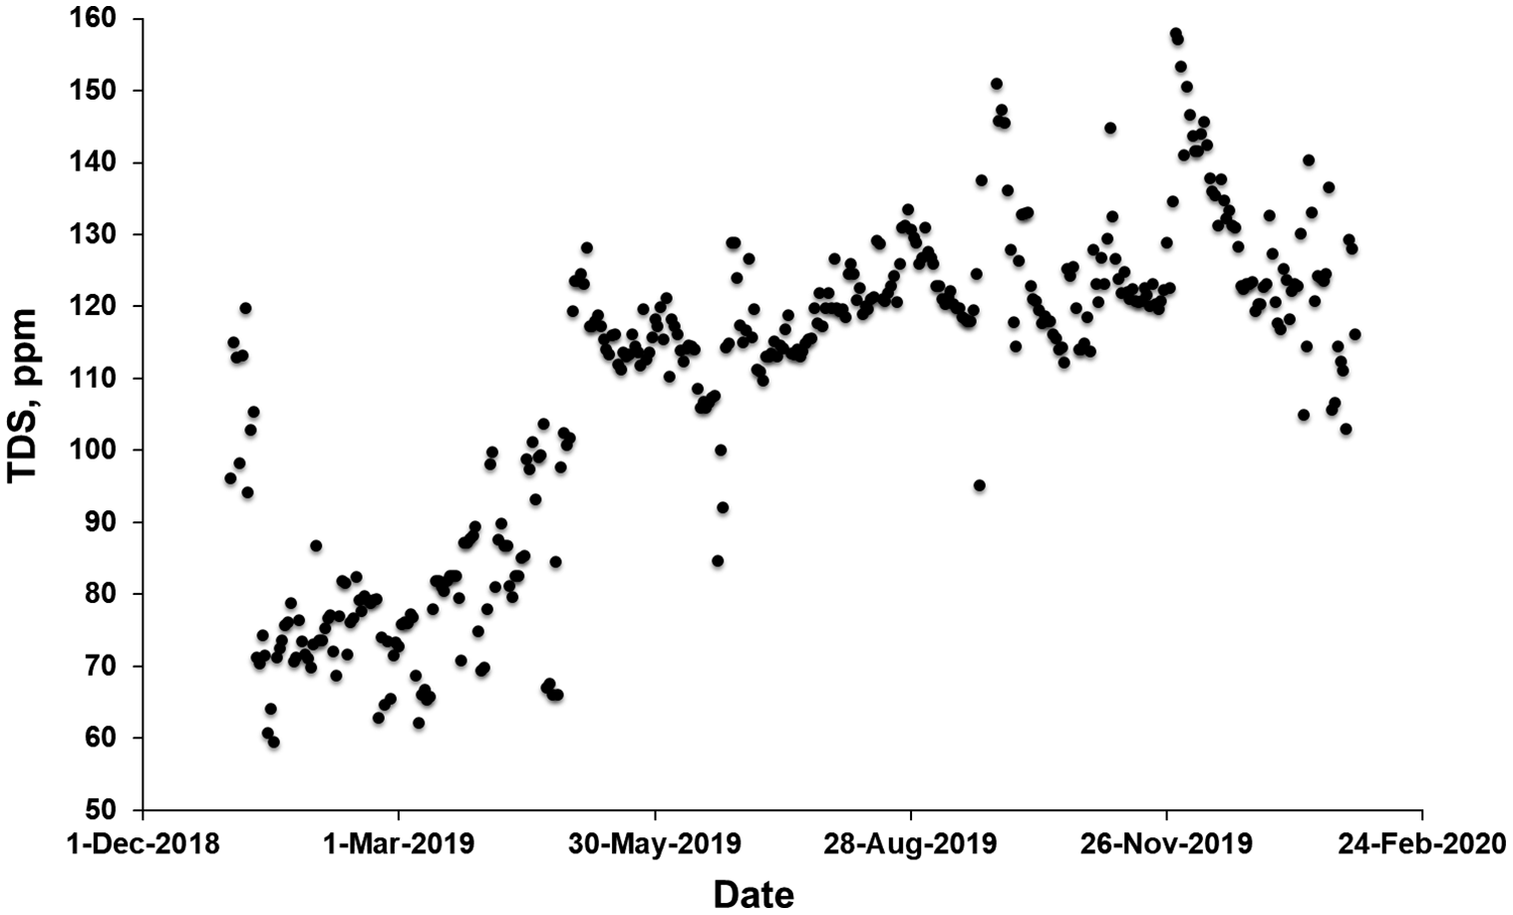
The Ras Al Khair dual-stage plant is a combined MSF and SWRO plant with operational capacity of 770,000 m3 day−1 MSF and 330,000 m3 day−1 RO, at the time of its construction in 2017 the largest desalination plant in the world. It was consistently producing water with overall TDS below specifications, but in 2019 reduction of the BWRO from 100% to 50% was done to increase TDS of the final combined product water. Before reduction of the BWRO on 29 April 2019, a TDS of 80 ± 12 ppm was observed, while afterwards TDS of 122 ± 13 ppm was recorded (Figure 8).
Increase in TDS at the Ras al Khair dual-stage plant. Two extremely high values during a period in which a significant portion of the MSF capacity was shut down (23 September, 208.9 ppm, and 26 September, 208.5 ppm) are beyond the range of the figure.

Figure 8. Long description
The scatter plot tracks T D S in p p m on the vertical Y axis against Date on the horizontal X axis. The Y axis ranges from 50 to 160 in increments of 10. The X axis spans from 1-Dec-2018 to 24-Feb-2020 with major tick marks every three months.
* From December 2018 to March 2019, values fluctuate between 60 and 120 p p m, with a dense cluster appearing below 80 p p m in early 2019.
* From March 2019 to May 2019, there is a steady increase from approximately 70 p p m to 120 p p m.
* Between May 2019 and August 2019, the data stabilizes between 110 and 130 p p m, with one notable outlier dropping to approximately 85 p p m in June.
* From August 2019 to November 2019, values continue to rise, peaking near 160 p p m in late November.
* From November 2019 to February 2020, the values show a slight downward trend but remain high, mostly between 110 and 140 p p m.
The data points are represented by black circular markers.
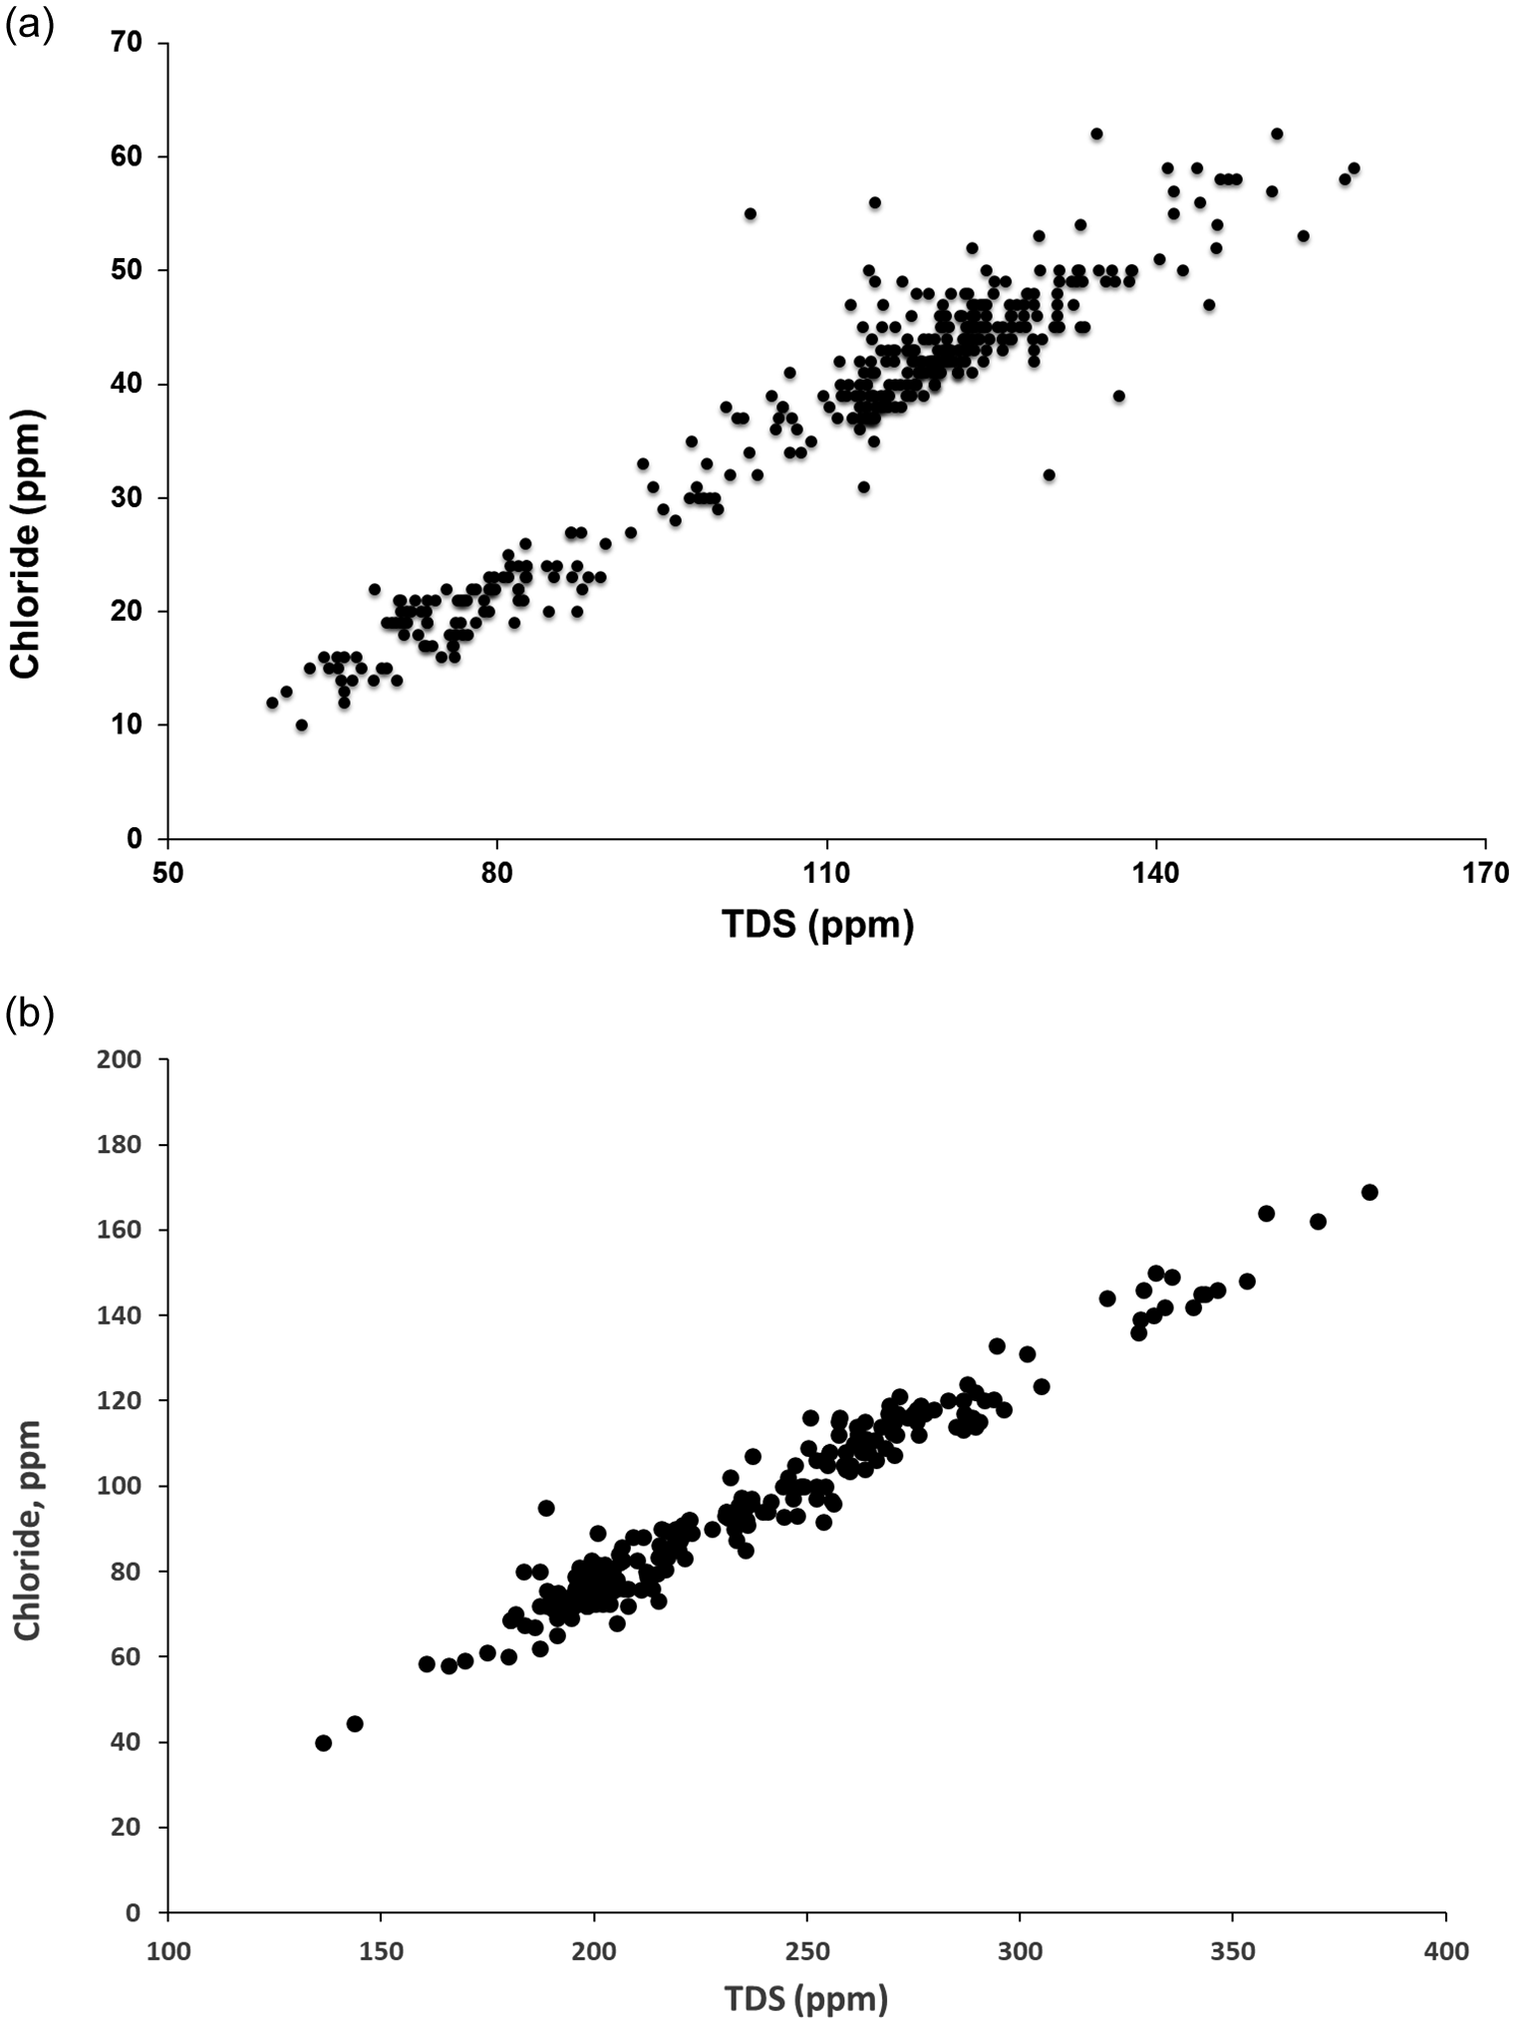
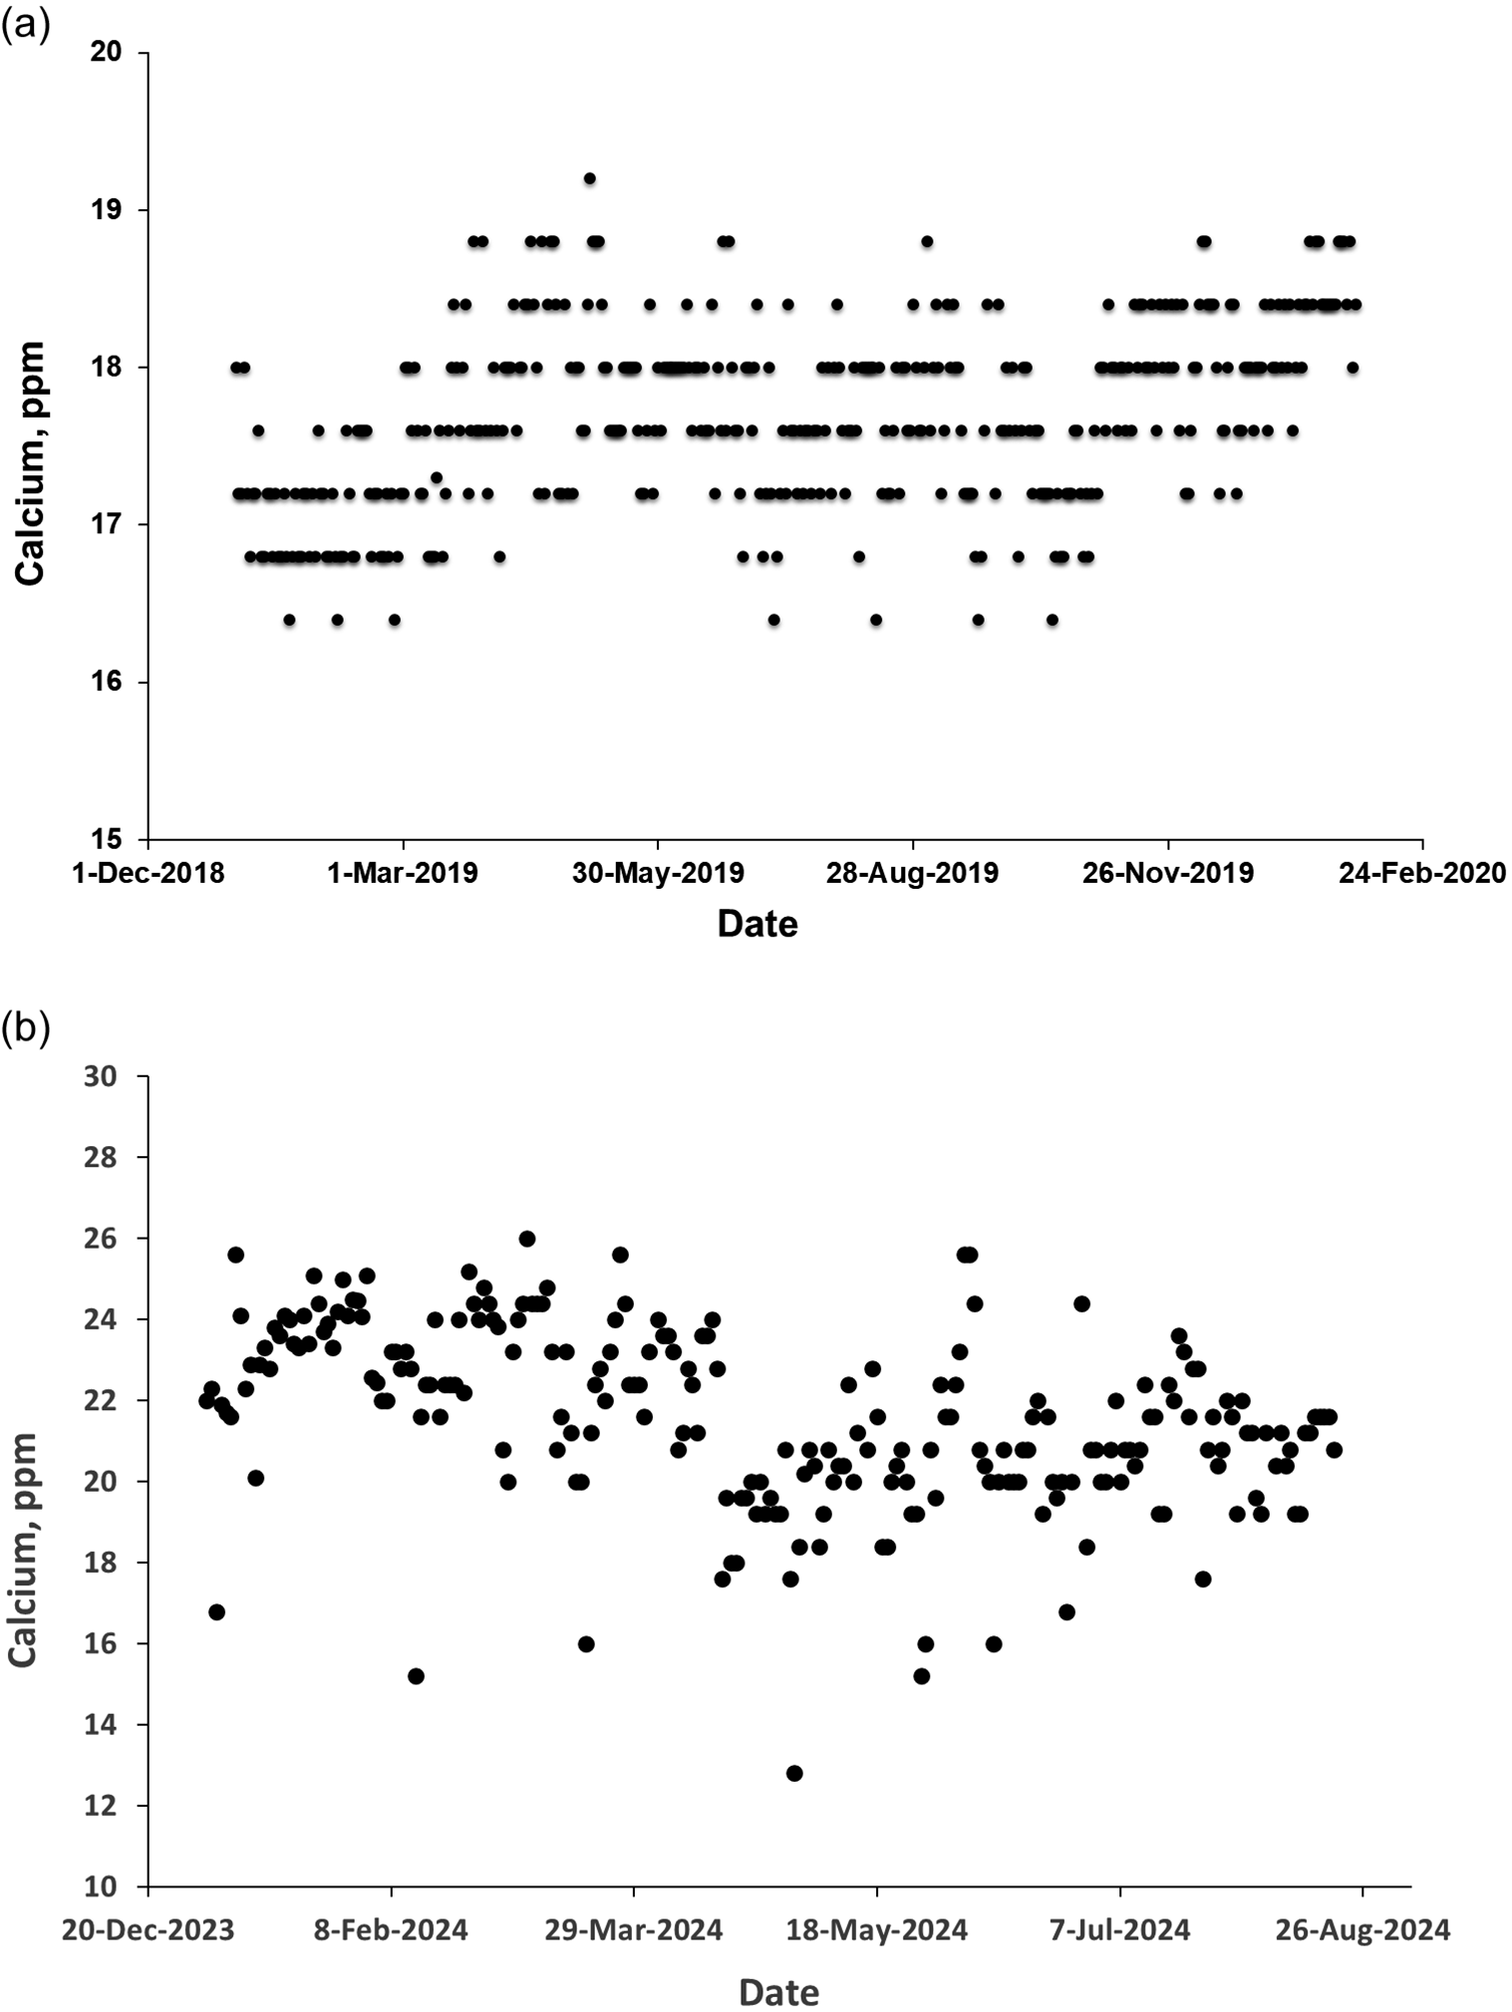
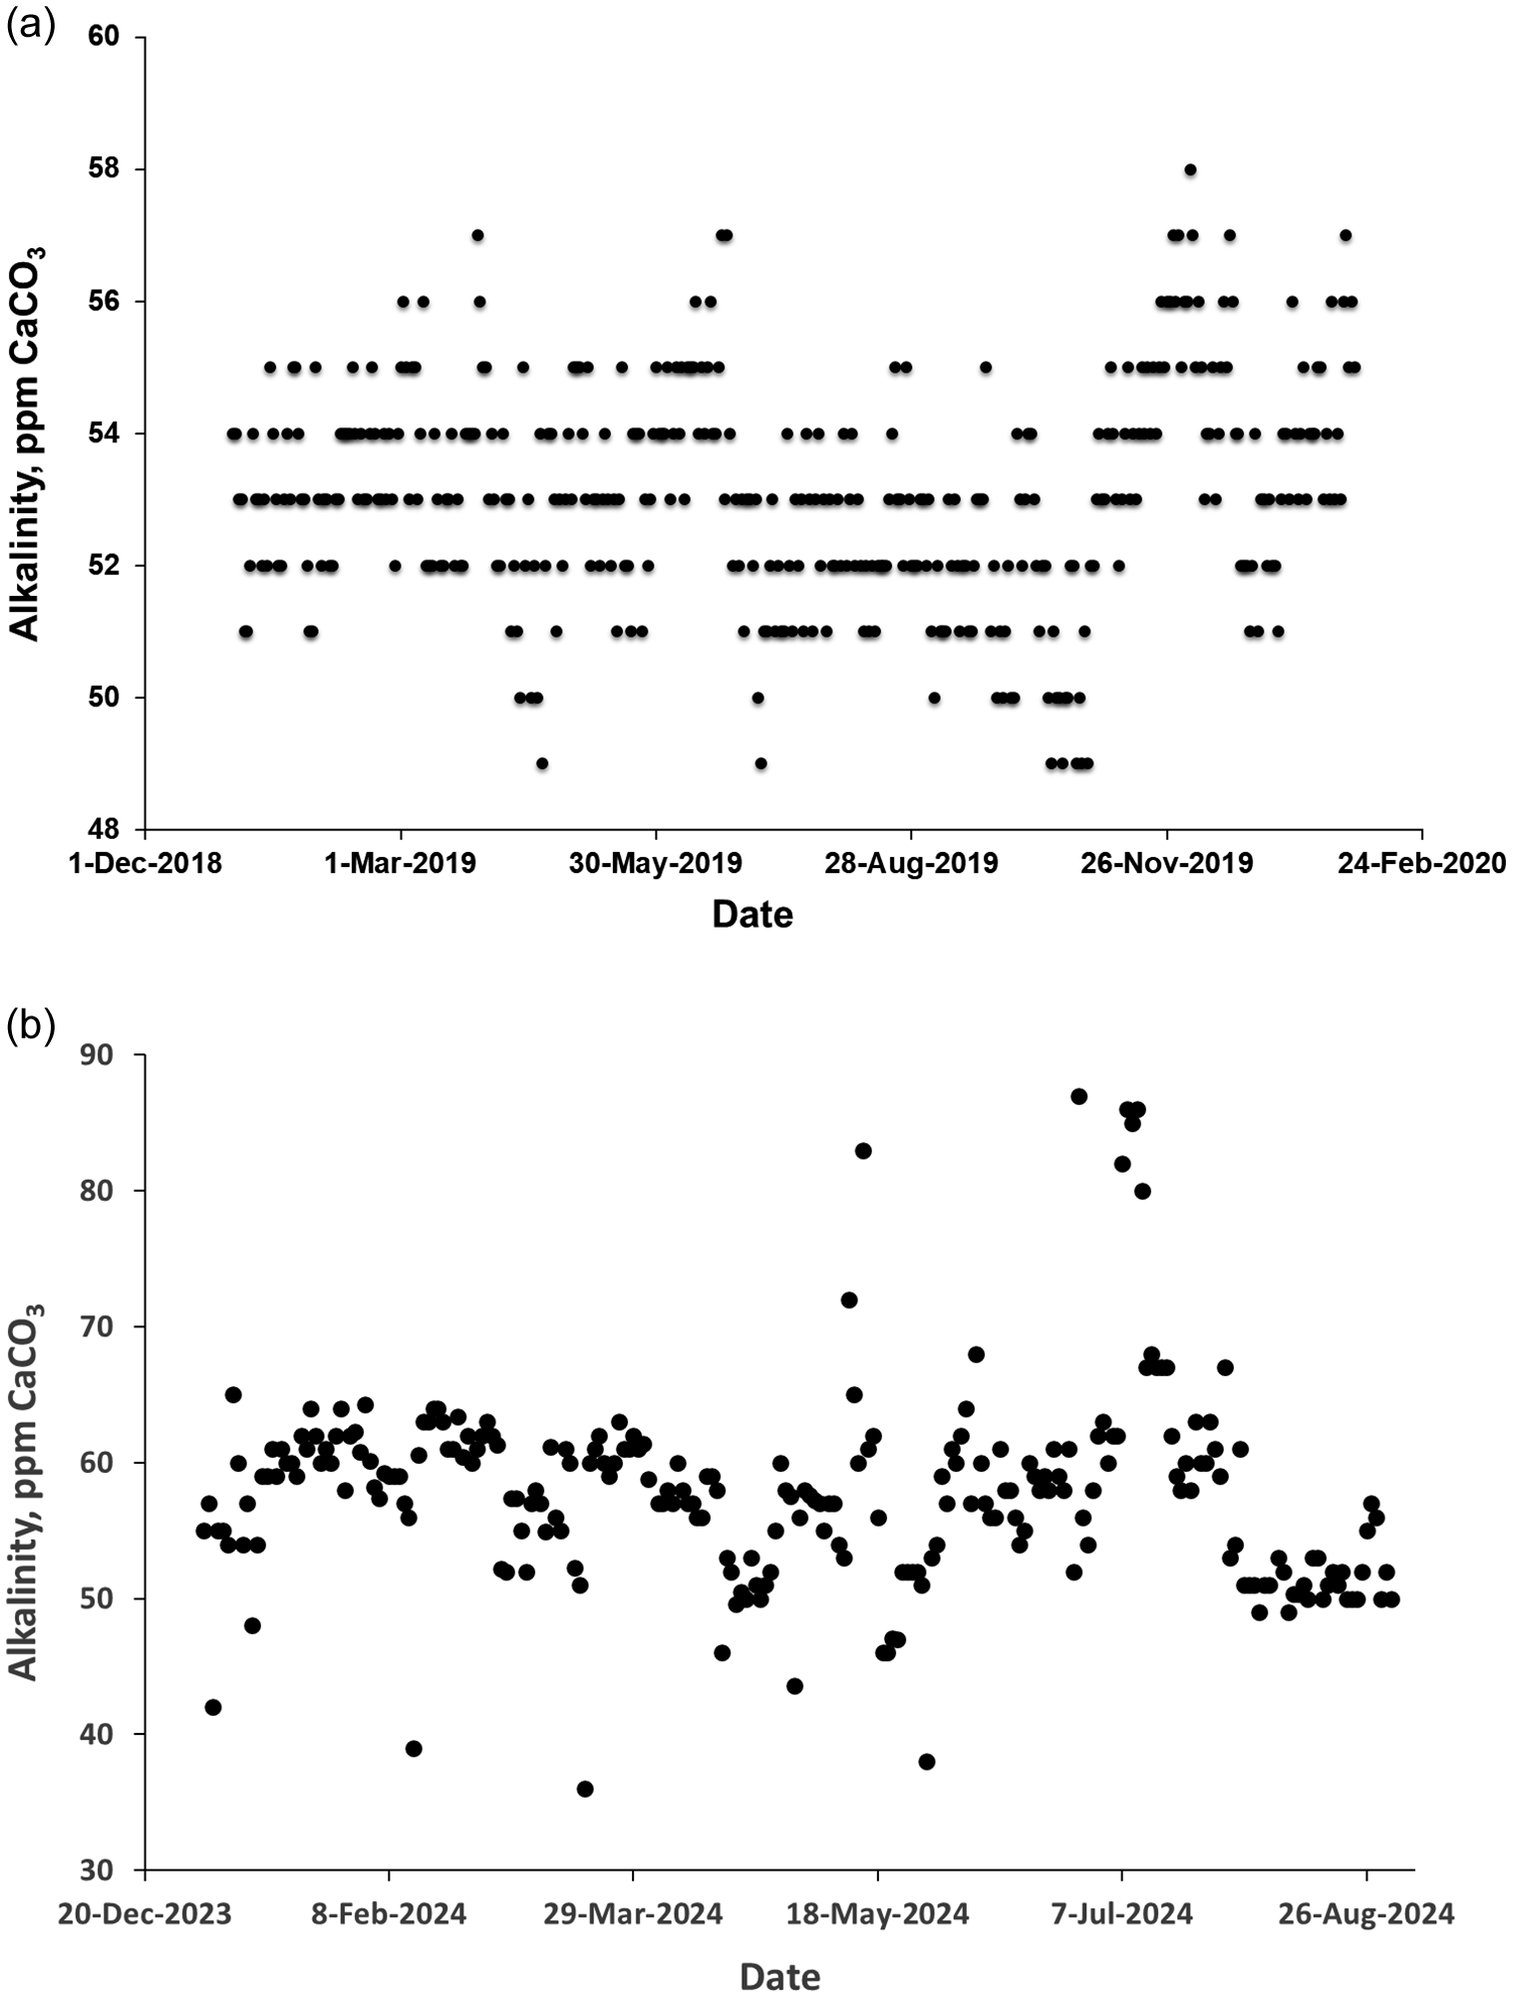
Chloride concentration was strongly correlated with TDS as expected, but remained well within acceptable levels (Figure 9). Calcium concentration (Figure 10) showed no significant change over the period in which BWRO was reduced at the Ras al Khair dual-stage plant, which is not surprising considering that the overwhelming majority of calcium in the product water comes from post-treatment and any additional calcium comes from the RO stream may not be significant compared to the range of variation in this value. In contrast to the situation at Khafji when BWRO was reduced, no increase was seen in the total alkalinity at Ras al Khair (Figure 11), which may be related to the relatively small contribution of RO to the overall product water composition at Ras al Khair.
Relationship between chloride concentration and TDS at Ras al Khair dual-stage plant. (a) 2019; (b) 2024.

Figure 9. Long description
Two-panel scatter plot.
Panel a, labeled 2019. The x-axis represents T D S in p p m with a scale from 50 to 170. The y-axis represents Chloride in p p m with a scale from 0 to 70. The data points show a strong positive linear correlation. At approximately 60 p p m T D S, chloride is around 12 p p m. The density of points increases between 110 and 130 p p m T D S, where chloride levels cluster between 35 and 50 p p m. The highest values reach approximately 160 p p m T D S and 60 p p m chloride.
Panel b, labeled 2024. The x-axis represents T D S in p p m with a scale from 100 to 400. The y-axis represents Chloride, p p m with a scale from 0 to 200. The data shows a tighter, more elongated positive linear trend compared to panel a. Data begins around 140 p p m T D S and 40 p p m chloride. A high concentration of data points occurs between 180 and 300 p p m T D S, with chloride levels rising from 60 to 120 p p m. The trend continues to a maximum point near 380 p p m T D S and 170 p p m chloride.
Variation in calcium concentration (mg L−1) at the Ras al Khair dual-stage plant. (a) 2019; (b) 2024.

Figure 10. Long description
The figure consists of two panels labeled a and b.
Panel a is a scatter plot for the year 2019. The Y axis is labeled Calcium, p p m and ranges from 15 to 20 in increments of 1. The X axis is labeled Date and spans from 1-Dec-2018 to 24-Feb-2020. The data points are concentrated in horizontal bands between 16.5 and 19 p p m. There is a slight upward shift in the baseline concentration starting around March 2019, with values frequently hitting 18 to 18.5 p p m through the end of the year. A single outlier peak reaches approximately 19.2 p p m in May 2019.
Panel b is a scatter plot for the year 2024. The Y axis is labeled Calcium, p p m and ranges from 10 to 30 in increments of 2. The X axis is labeled Date and spans from 20-Dec-2023 to 26-Aug-2024. The data shows higher variability and higher overall concentrations compared to panel a. Most points fluctuate between 18 and 26 p p m. From December 2023 to April 2024, the concentration remains mostly above 20 p p m. After May 2024, there is a slight downward trend with more frequent points appearing between 18 and 22 p p m. Notable outliers include a low point near 13 p p m in May and several points near 15 to 16 p p m throughout the period.
Variation in alkalinity (mg L−1 as CaCO3) at the Ras al Khair dual-stage plant. (a) 2019; (b) 2024.

Figure 11. Long description
Two vertically stacked scatter plots.
Panel a, at the top, has a y-axis labeled Alkalinity, p p m C a C O sub 3 ranging from 48 to 60. The x-axis is labeled Date, spanning from 1-Dec-2018 to 24-Feb-2020. The data points are tightly clustered in horizontal bands between 51 and 56 p p m. There are occasional outliers reaching as high as 58 and as low as 49. The distribution is relatively stable throughout the year.
Panel b, at the bottom, has a y-axis labeled Alkalinity, p p m C a C O sub 3 ranging from 30 to 90. The x-axis is labeled Date, spanning from 20-Dec-2023 to 26-Aug-2024. The data shows higher variability compared to panel a. Most points fluctuate between 50 and 65 p p m. There is a notable spike in July 2024 where several data points reach between 80 and 87 p p m. A few low outliers appear near 36 and 38 p p m in early 2024.
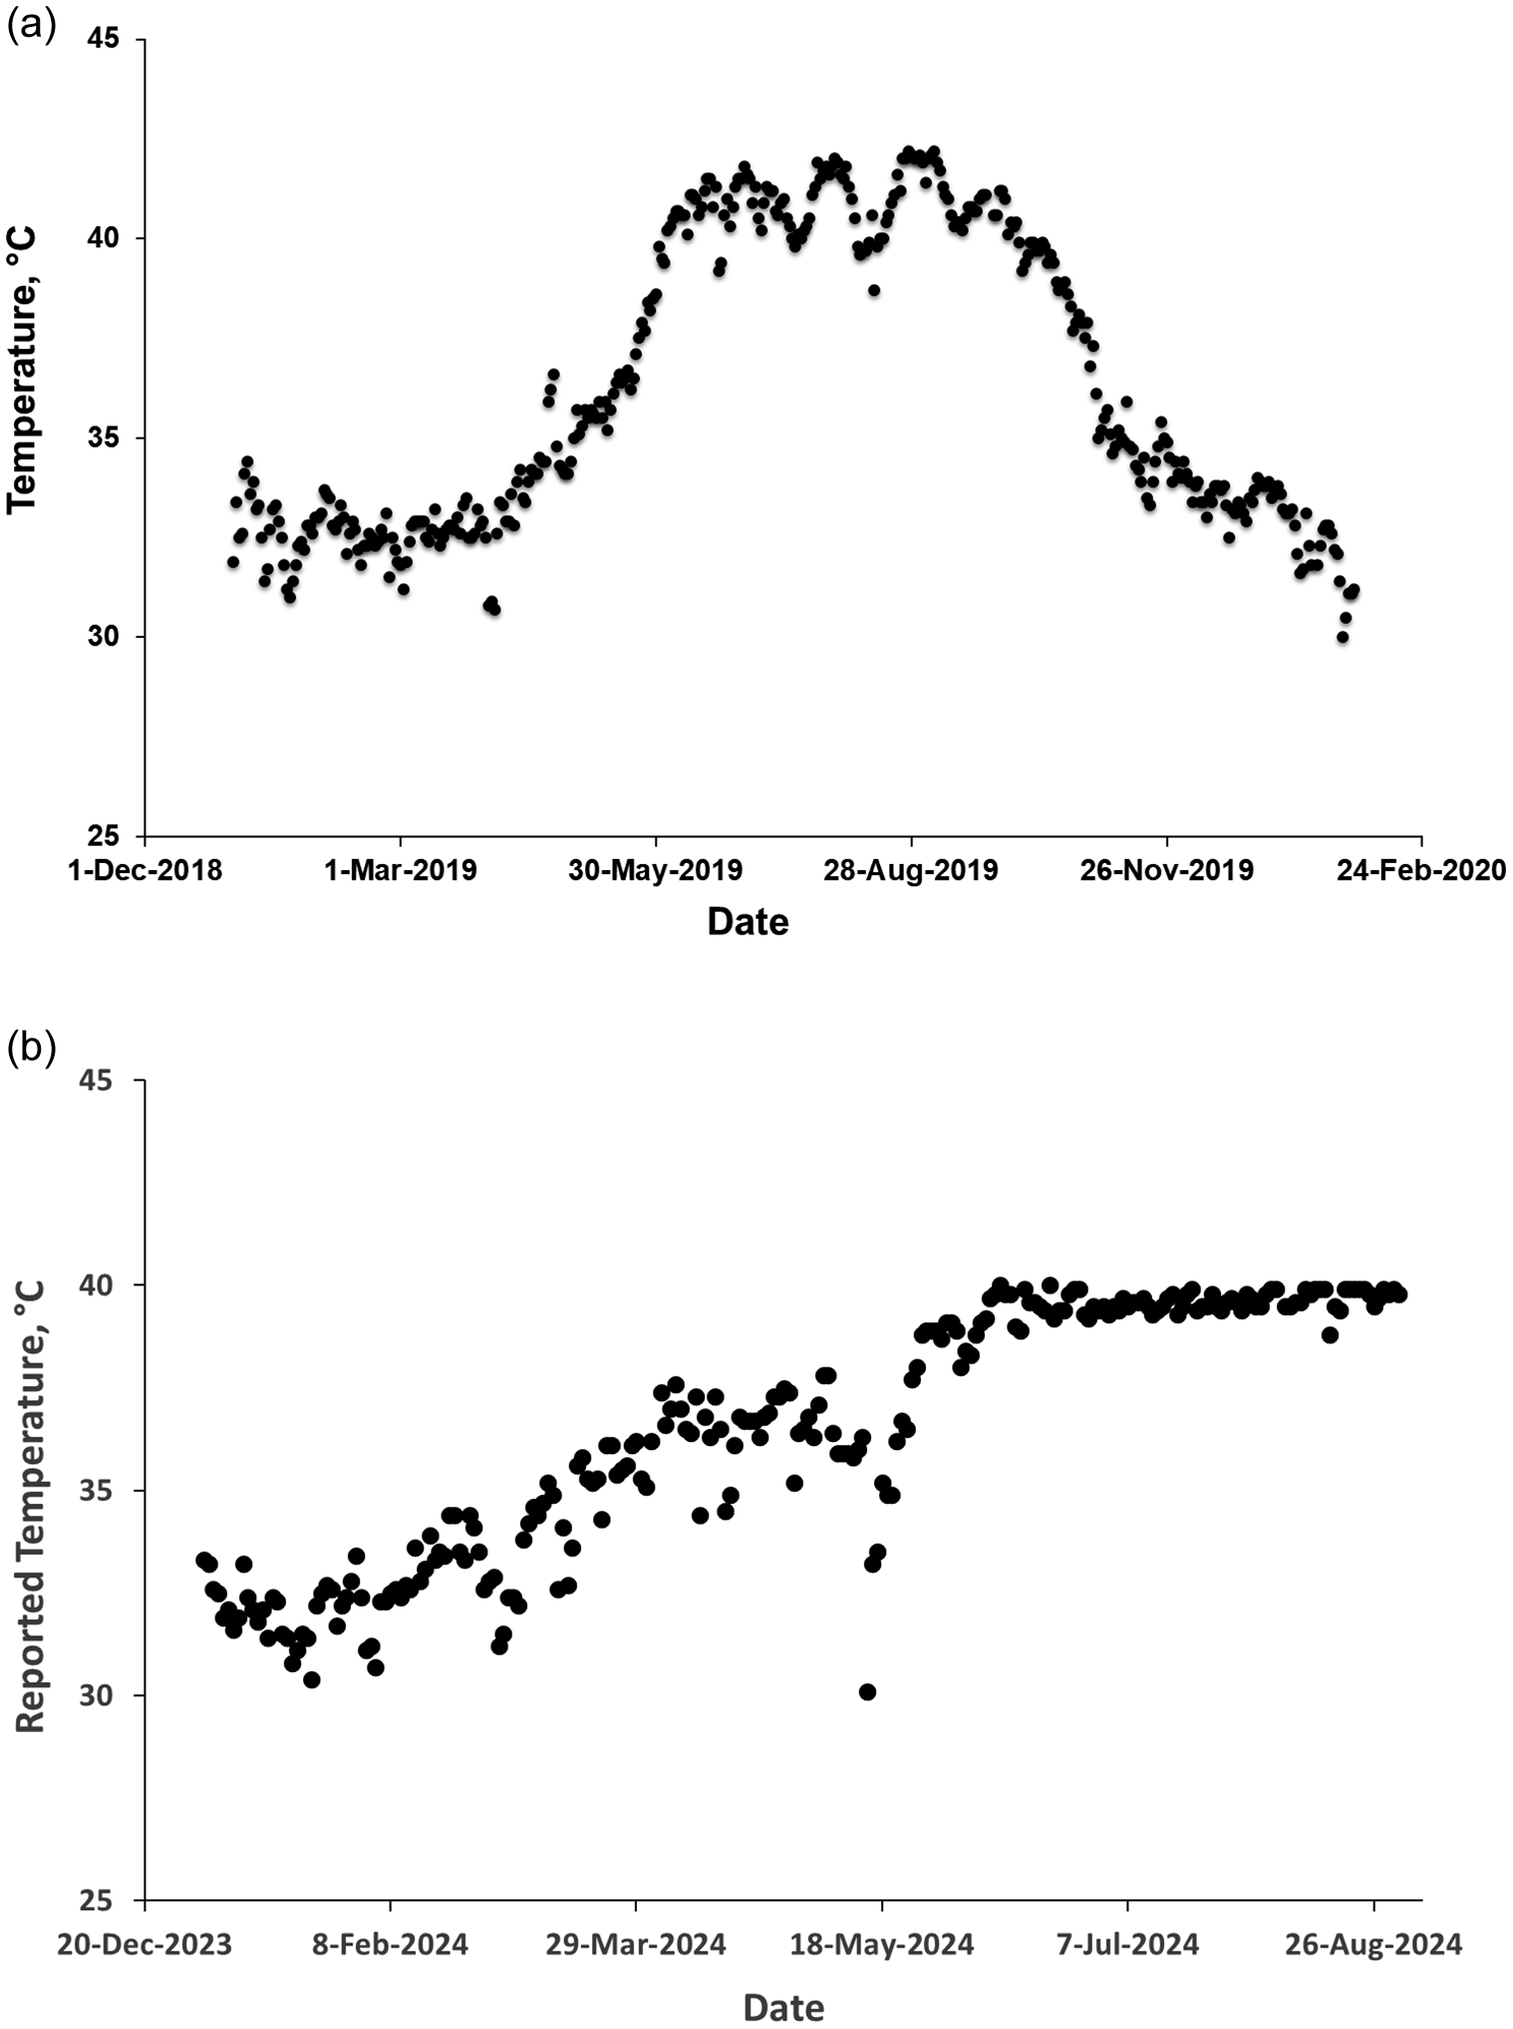
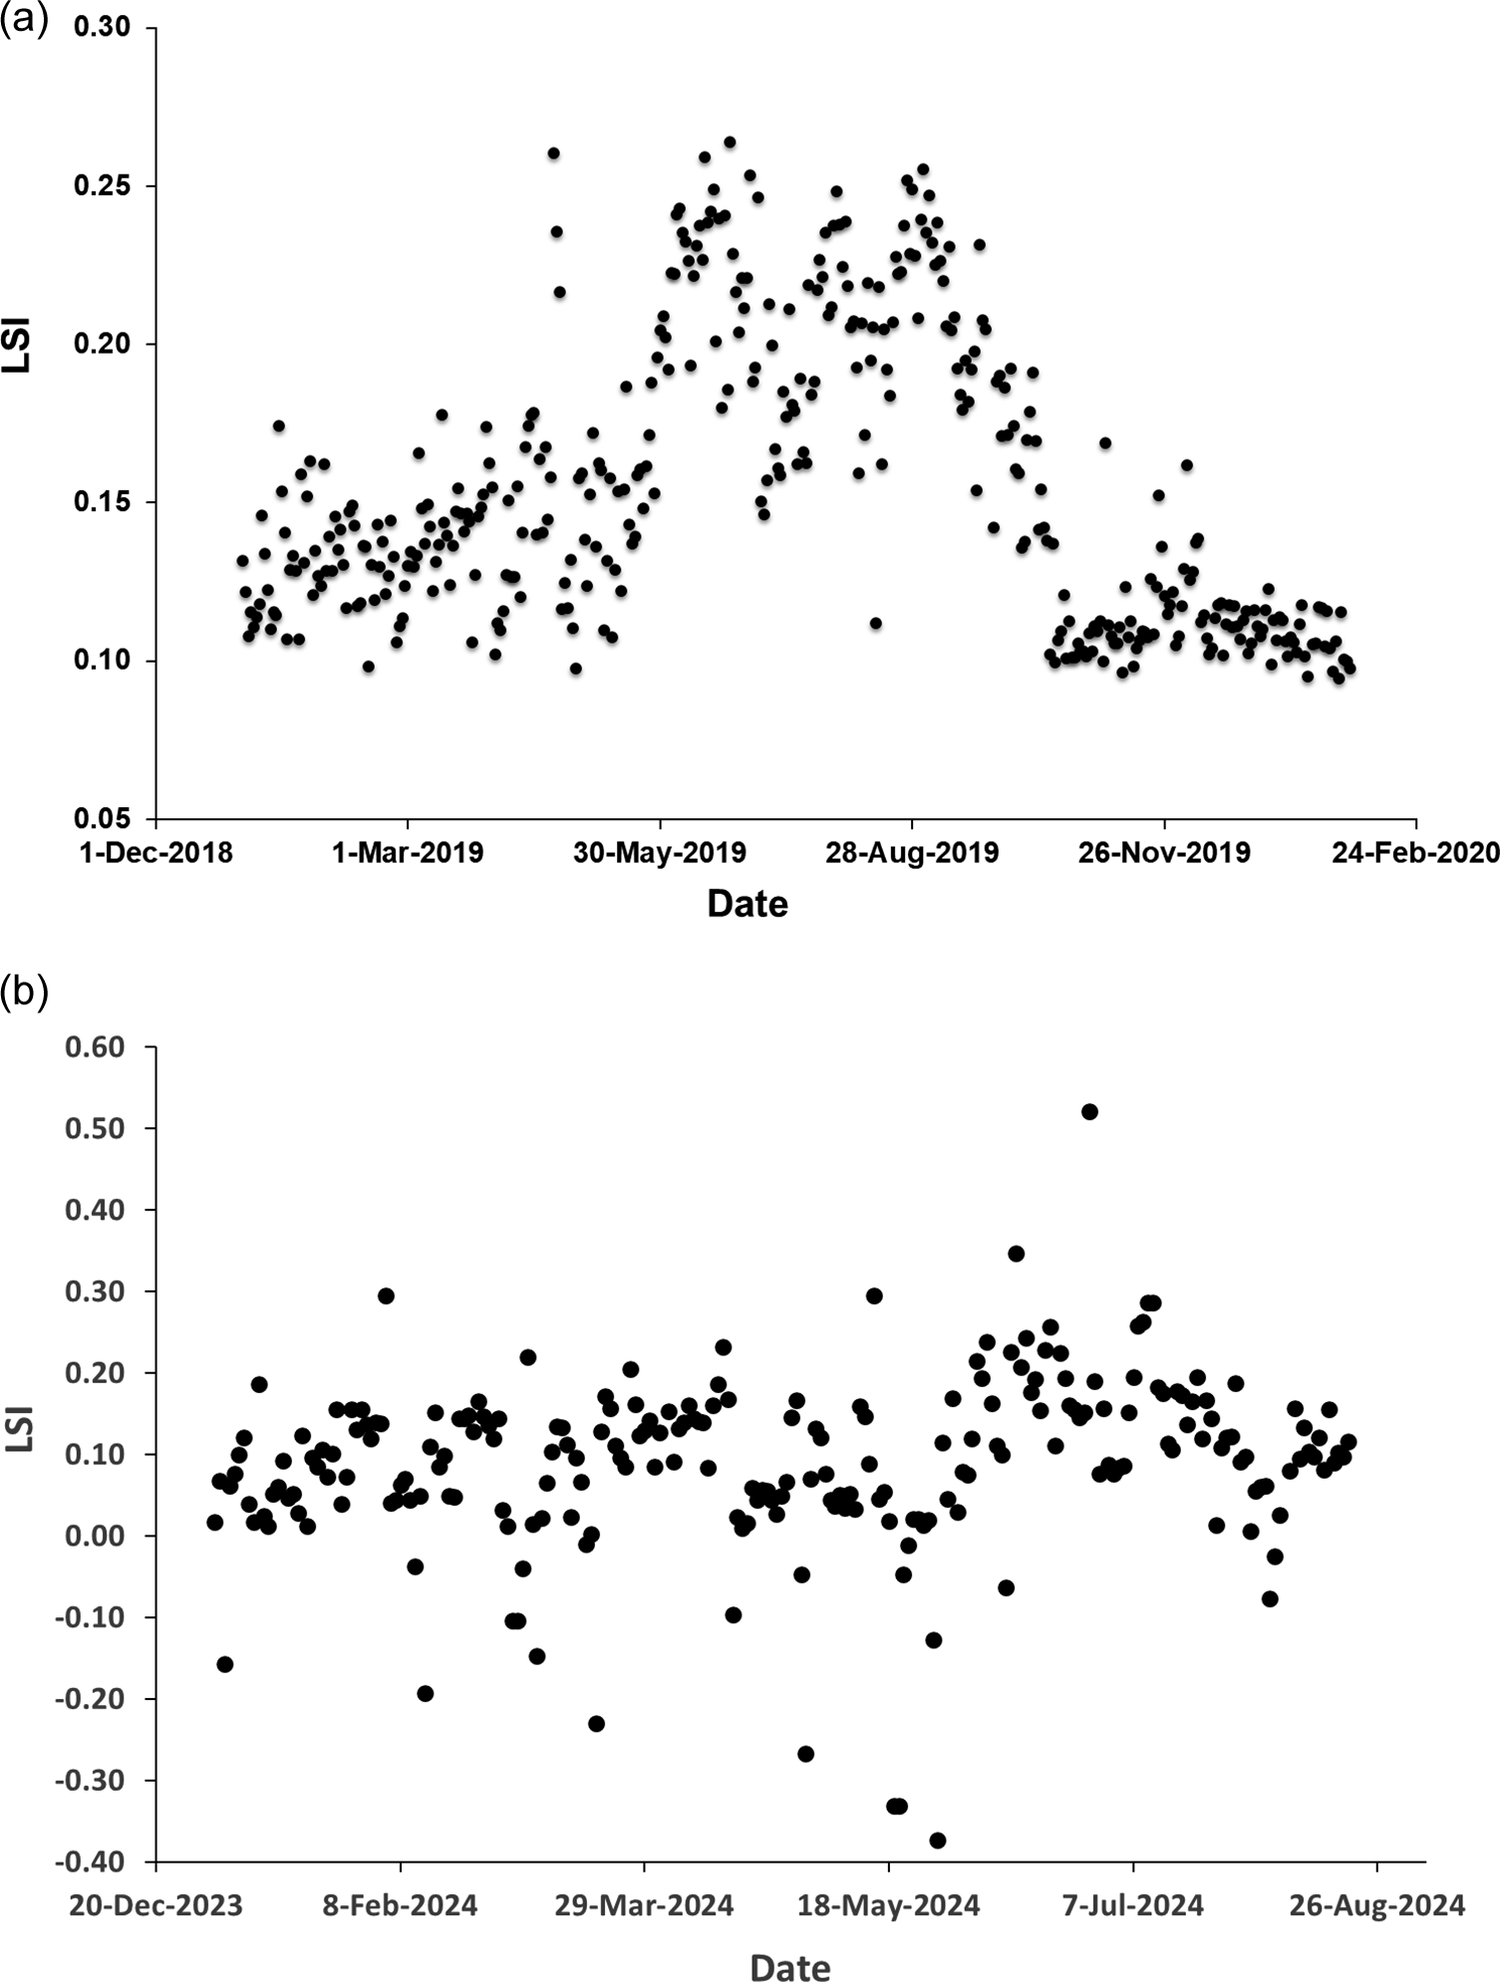
The period of the study covered a large seasonal variation in temperature of the product water (Figure 12), which appeared to be the primary factor in the variation in LSI observed (Figure 13). In order to maintain LSI at a more consistent level and avoid scaling by calcium carbonate in the transmission system, reduction of the amount of sodium hydroxide dosed in the final treatment during the summer (from May to October) was advised.
Variation in product water temperature reported at the Ras al Khair dual-stage plant. (a) 2019; (b) 2024.

Figure 12. Long description
The image consists of two vertically stacked scatter plots labeled a and b.
Panel a: The x-axis is labeled Date, ranging from 1-Dec-2018 to 24-Feb-2020. The y-axis is labeled Temperature, degrees Celsius, ranging from 25 to 45. The data points show a seasonal bell-shaped curve. Temperatures start between 30 and 35 degrees Celsius in early 2019, rise steadily starting in May, and peak between 40 and 43 degrees Celsius from July through September. The values then decline back toward 30 degrees Celsius by February 2020.
Panel b: The x-axis is labeled Date, ranging from 20-Dec-2023 to 26-Aug-2024. The y-axis is labeled Reported Temperature, degrees Celsius, with the same 25 to 45 scale. The data shows a different trend compared to panel a. Temperatures begin around 32 degrees Celsius in late 2023 and show a gradual linear increase with significant fluctuations until mid-May 2024. After a brief sharp dip to 30 degrees Celsius in late May, the temperature rises and plateaus, maintaining a very stable and narrow range just below 40 degrees Celsius from June through August 2024.
Variation in Langelier Saturation Index at the Ras al Khair dual-stage plant. (a) 2019; (b) 2024.

Figure 13. Long description
Two vertically stacked scatter plots labeled a and b.
Panel a shows L S I on the vertical Y axis ranging from 0.05 to 0.30 and Date on the horizontal X axis from December 2018 to February 2020. The data points start between 0.10 and 0.15 from December to May. There is a sharp increase in June 2019 where values peak between 0.20 and 0.27. This elevated plateau continues through August before dropping back to a tight cluster around 0.10 from October 2019 through February 2020.
Panel b shows L S I on the Y axis ranging from negative 0.40 to 0.60 and Date on the X axis from December 2023 to August 2024. The data is significantly more volatile than in panel a. Most points fluctuate between 0.00 and 0.20 throughout the year. However, there are several extreme outliers including a low point near negative 0.38 in May 2024 and a high peak above 0.50 in July 2024. Unlike the 2019 data, there is no clear seasonal bell-shaped trend.
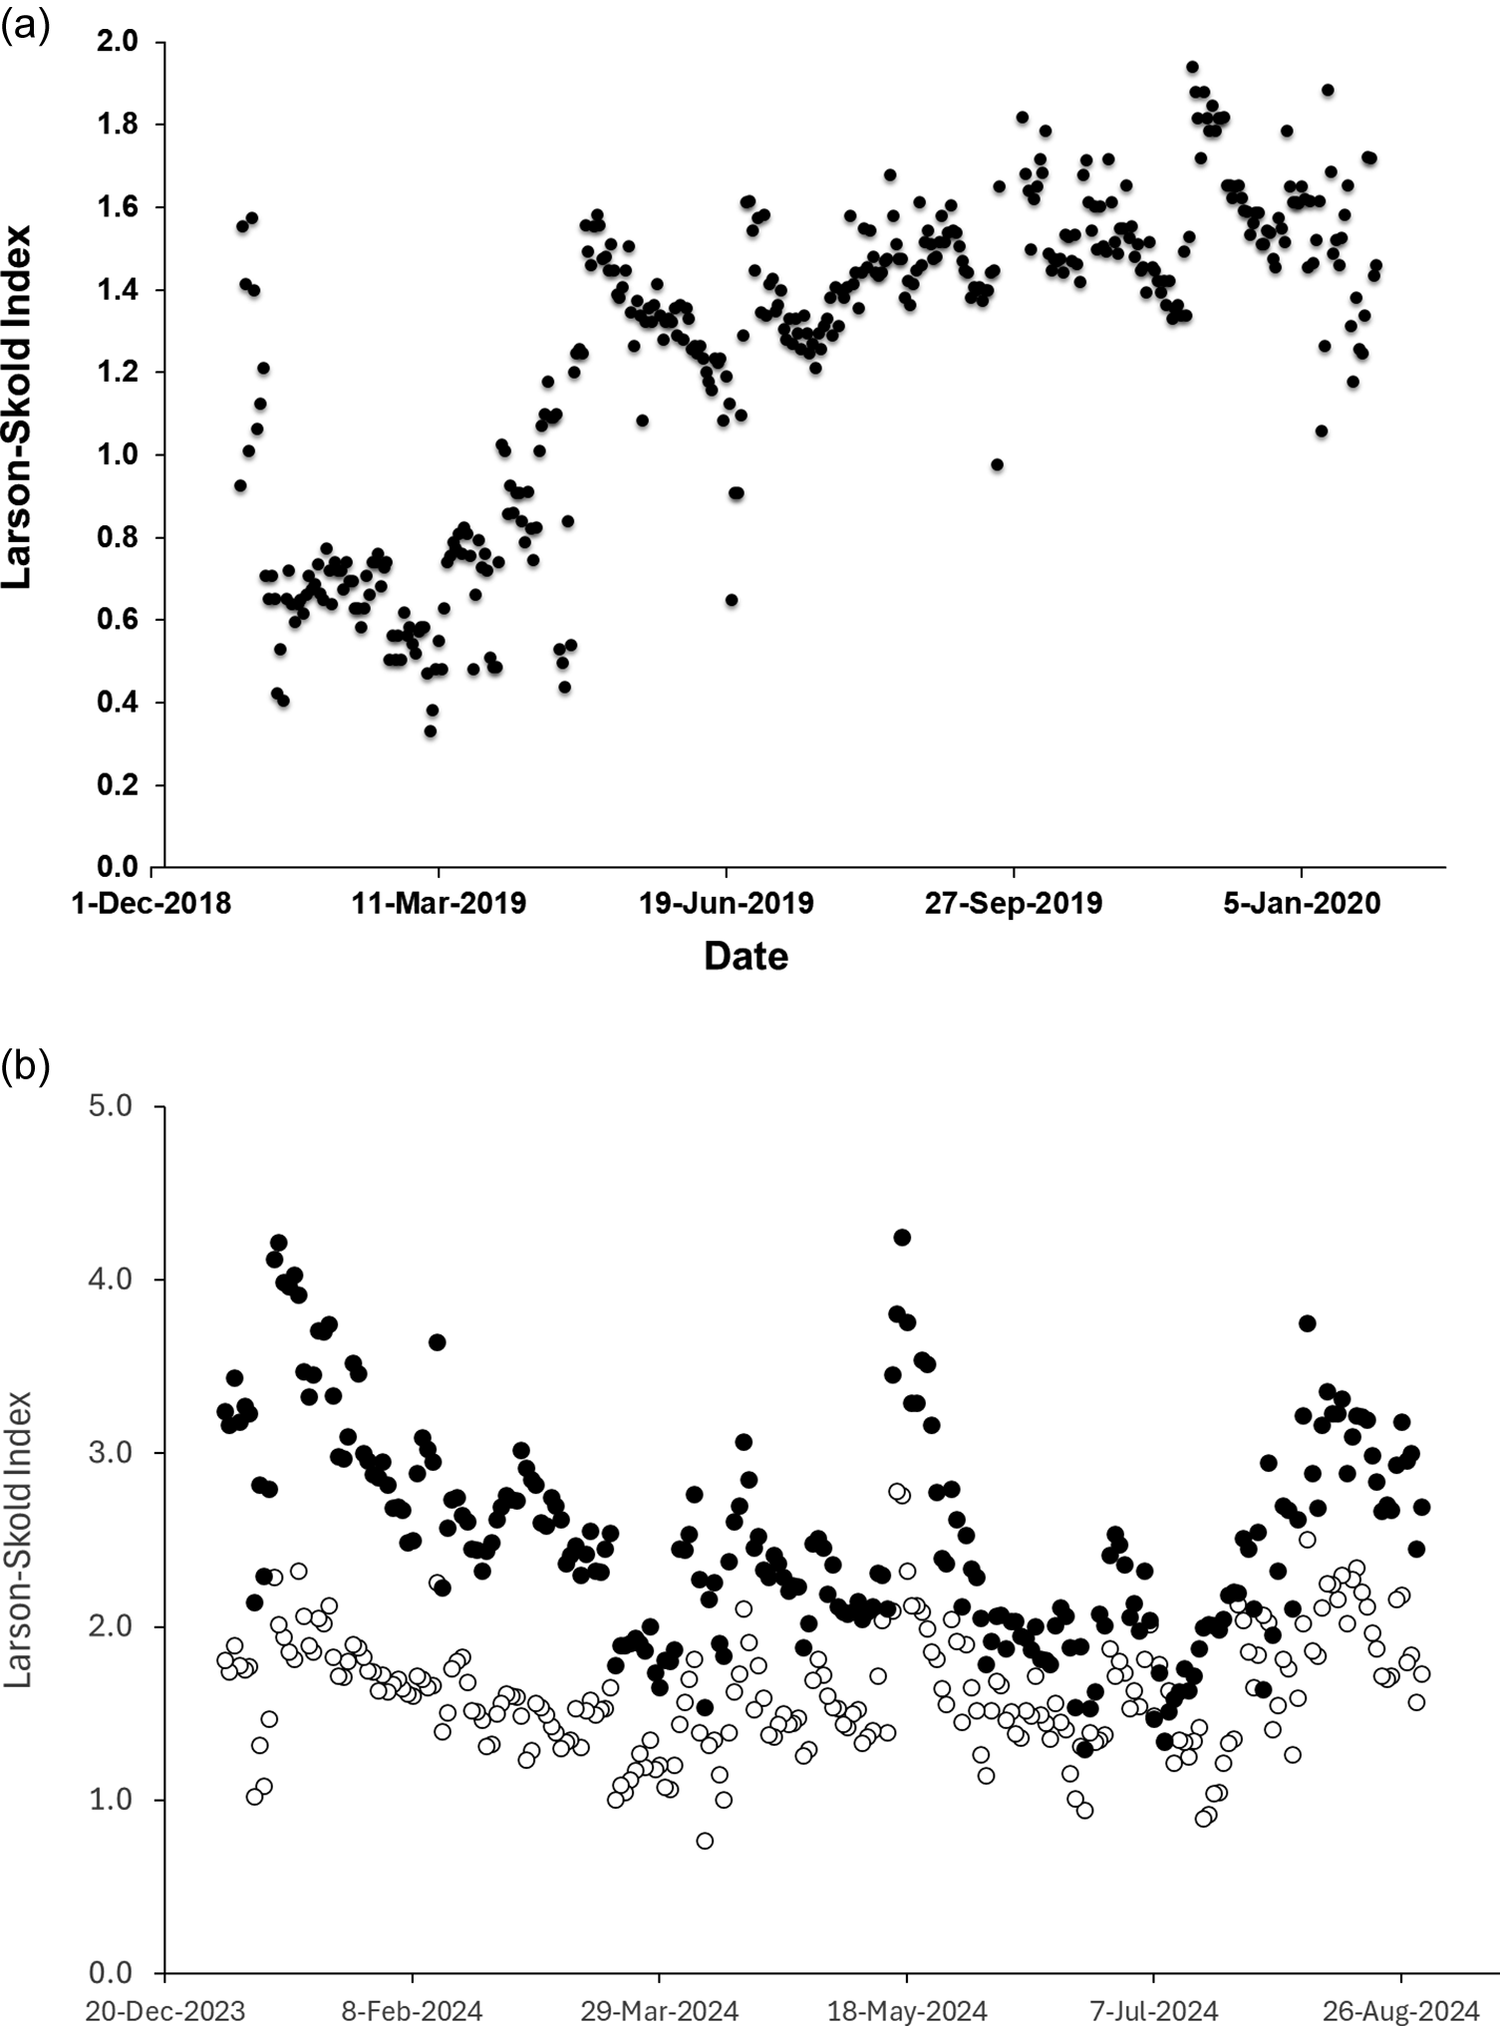
The Larson–Skold index also saw a significant increase upon reduction of BWRO (Figure 14). In 2019, values were well below the suggested limit value of 1.2 before the change was made, but exceeded it by a small degree afterwards. (Note that while chloride and hydrogen carbonate ion concentrations were measured, the sulfate contribution was estimated based on the chloride:sulfate ratio obtained for product water at the same plant in 2025. As the composition of seawater is essentially identical at a given location, this ratio should not have changed appreciably over the period).
Larson–Skold index at Ras al Khair, (a) 2019 with estimated chloride:sulfate ratio from 2025 data, (b) 2024, with measured concentrations (solid circles) and with formula of Fellows and Al-Hamzah (open circles) [12].

Figure 14. Long description
Two vertically stacked scatter plots.
Panel a, top. The y axis is Larson-Skold Index ranging from 0.0 to 2.0 in increments of 0.2. The x axis is Date from 1-Dec-2018 to 5-Jan-2020. Data points are solid black circles. The index starts around 1.0, drops sharply to 0.6 in early 2019, then shows a fluctuating upward trend, peaking near 2.0 in late 2019 before settling around 1.4 in early 2020.
Panel b, bottom. The y axis is Larson-Skold Index ranging from 0.0 to 5.0 in increments of 1.0. The x axis is Date from 20-Dec-2023 to 26-Aug-2024. This panel contains two data series. The first series, represented by solid black circles, shows measured concentrations fluctuating between 1.5 and 4.2, with several distinct peaks in early 2024 and May 2024. The second series, represented by open circles, follows the formula of Fellows and Al-Hamzah. These open circles generally track below the solid circles, maintaining a similar fluctuating pattern but within a lower range of approximately 0.8 to 2.8.
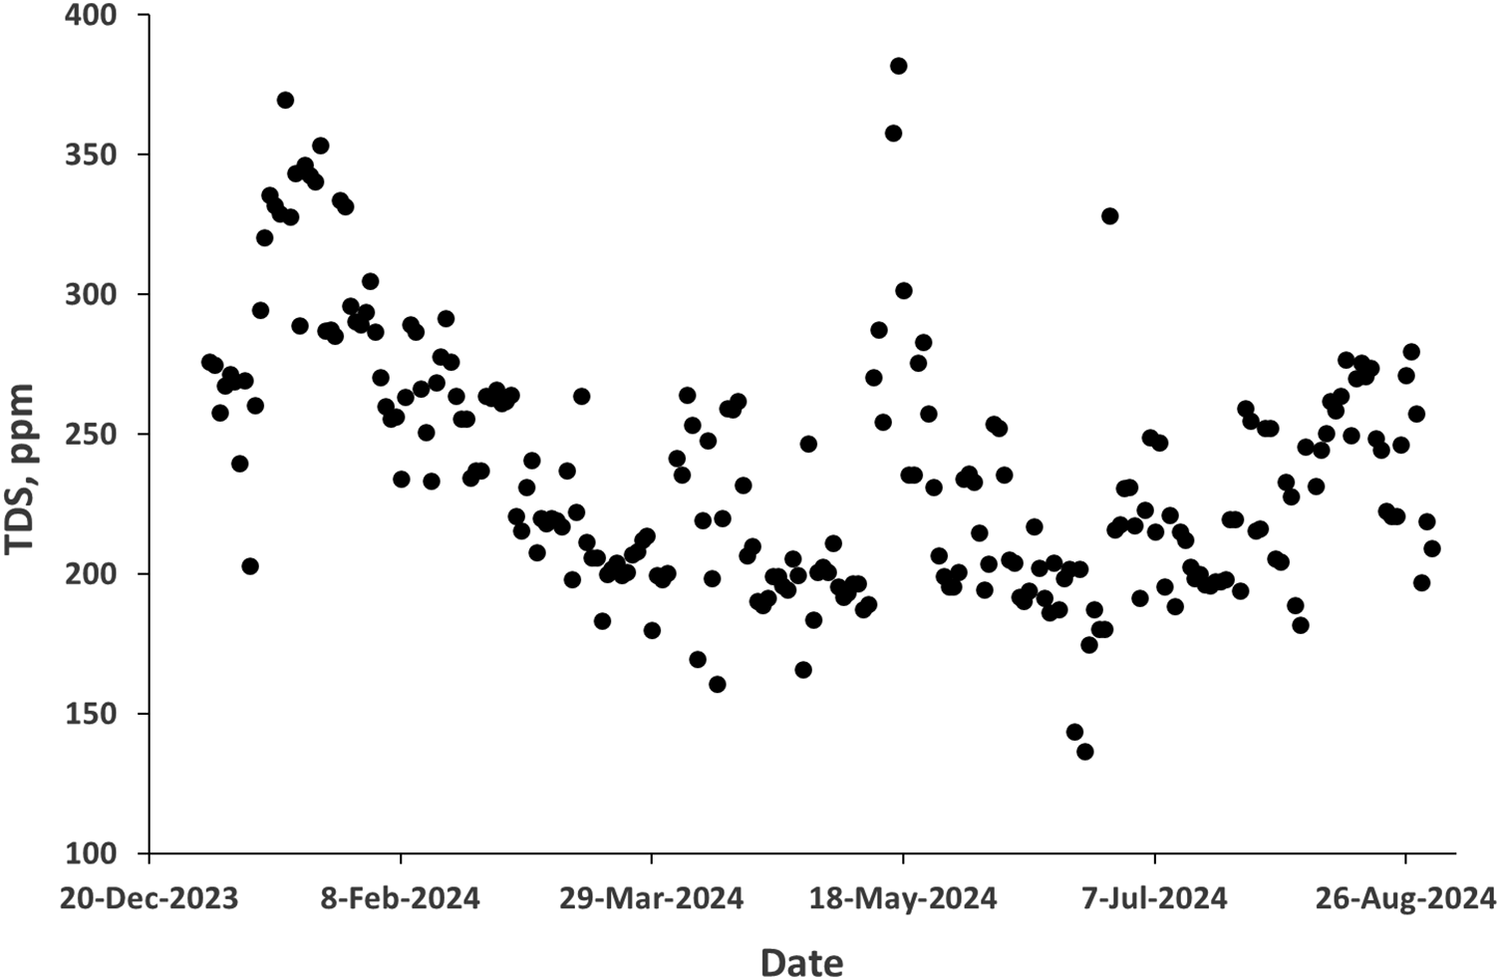
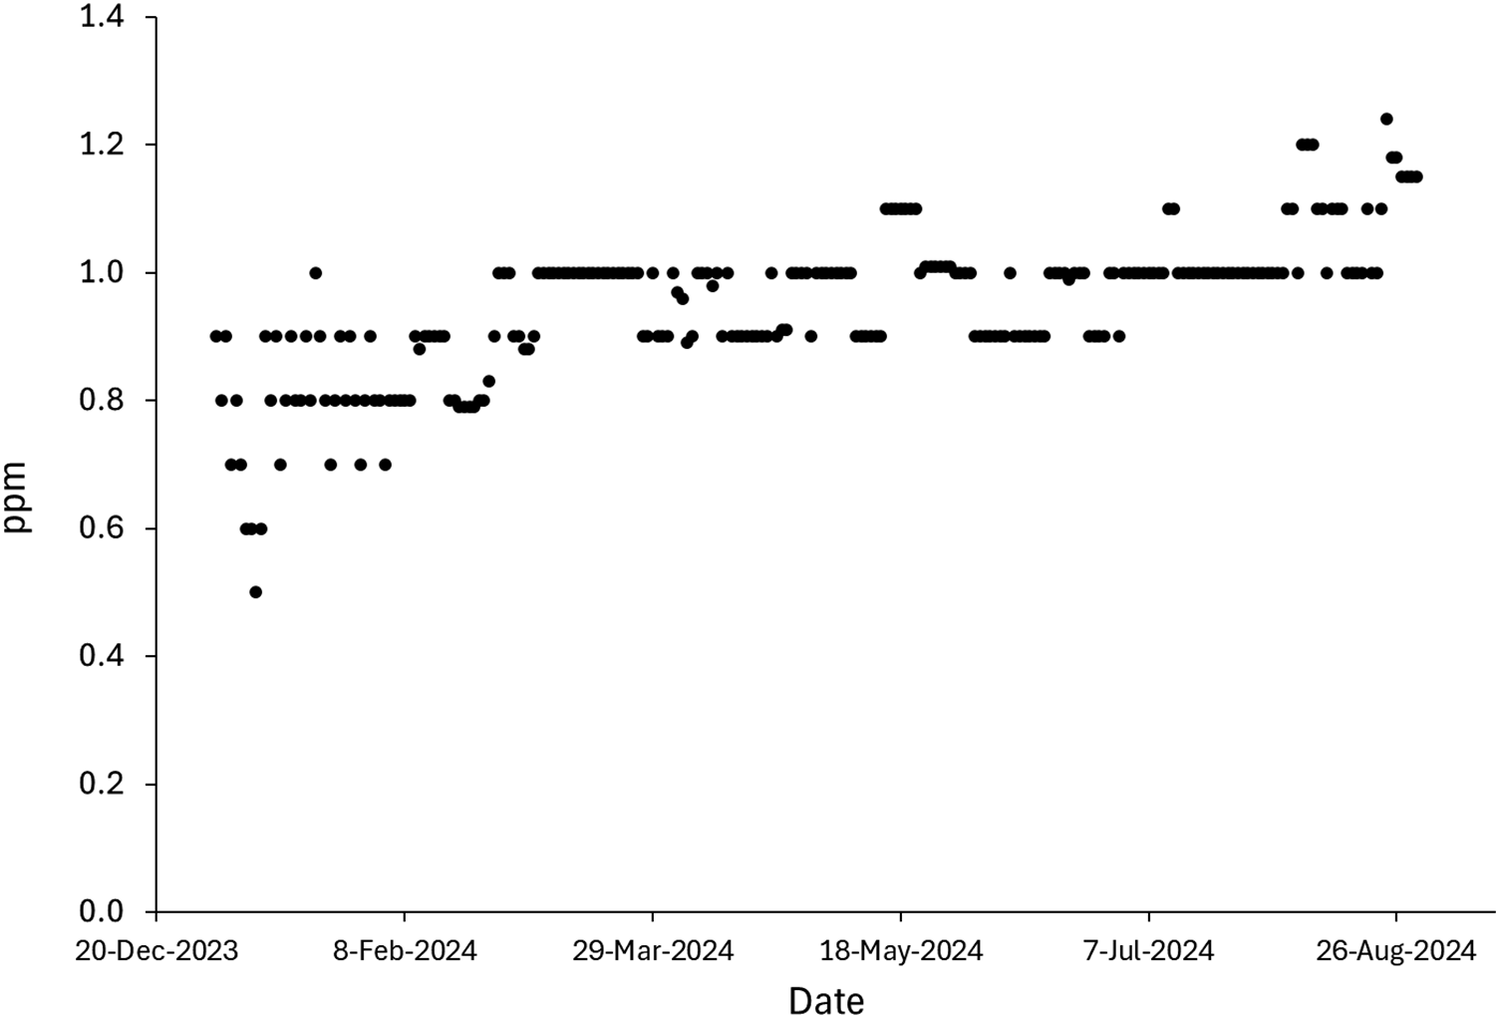
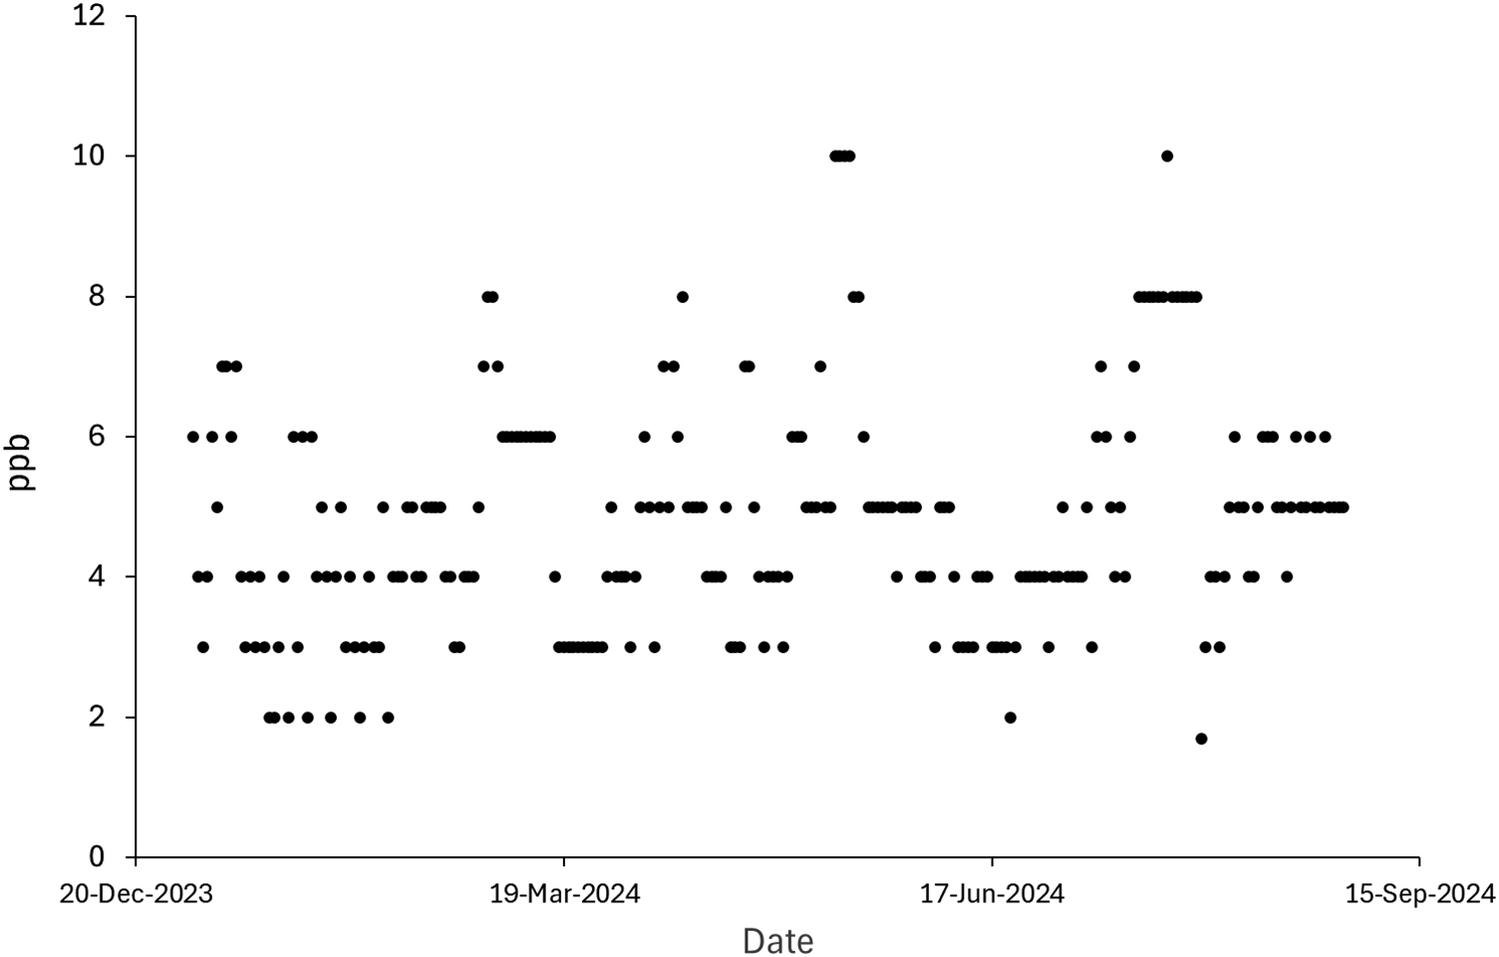
The situation at Ras al Khair as of 2024 was entirely different, as operational decisions with the SWRO system led to consistently high TDS values. Operating under conditions where only a fraction of the SWRO output was passed through BWRO, TDS greater than 200 ppm was consistently reported (Figure 15), leading to very high values of the Larson–Skold index (Figure 14b). Boron concentrations in the final mixed product water remained stable throughout 2024 around an average value of about 1.1 ppm (Figure 16). This corresponds to a value of about 3.6 ppm in the RO product water. Bromate, which is derived from both RO and MSF product water, varied more widely in concentration through 2024 (Figure 17), with an average value of 4.8 ± 1.7 ppb.
TDS of Ras al Khair plant product water, 2024.

Figure 15. Long description
A scatter plot with the Y axis labeled T D S, p p m ranging from 100 to 400 in increments of 50. The X axis is labeled Date with major tick marks for 20-Dec-2023, 8-Feb-2024, 29-Mar-2024, 18-May-2024, 7-Jul-2024, and 26-Aug-2024. The data points are black circles.
Starting in late December 2023, T D S values begin around 275 p p m and rise to a peak near 370 p p m in early January 2024. Following this peak, there is a general downward trend with significant fluctuation, reaching a low point near 160 p p m in late March 2024.
In mid-May 2024, there is a sharp vertical spike where two data points reach approximately 360 and 380 p p m, while the surrounding data remains between 200 and 300 p p m. After this spike, the values fluctuate mostly between 180 and 250 p p m through June and July. A notable outlier appears below the main cluster in late June at approximately 140 p p m. By August 2024, the data shows a slight upward trend, with most points clustering between 220 and 280 p p m.
Boron concentration in Ras al Khair product water, 2024.

Figure 16. Long description
The scatter plot features a horizontal X-axis labeled Date and a vertical Y-axis labeled p p m. The Y-axis scale ranges from 0.0 to 1.4 in increments of 0.2. The X-axis includes specific date markers: 20-Dec-2023, 8-Feb-2024, 29-Mar-2024, 18-May-2024, 7-Jul-2024, and 26-Aug-2024.
Data points are represented by black dots.
* In late December 2023, values are scattered between 0.5 and 0.9 p p m.
* From February to March 2024, the concentration stabilizes mostly between 0.8 and 1.0 p p m.
* Between April and June 2024, the majority of points cluster at 1.0 p p m, with occasional peaks reaching 1.1 p p m.
* From July through August 2024, there is a visible increase, with data points frequently hitting 1.1 and 1.2 p p m, and a final peak reaching approximately 1.25 p p m in late August.
Overall, the graph illustrates a positive linear trend where boron concentration increases over the eight-month period.
Bromate concentration in Ras al Khair product water, 2024.

Figure 17. Long description
The Y-axis is labeled p p b (parts per billion) and ranges from 0 to 12 in increments of 2. The X-axis is labeled Date and includes four major tick marks: 20-Dec-2023, 19-Mar-2024, 17-Jun-2024, and 15-Sep-2024. The data is presented as a dense series of black circular points.
From December 2023 to March 2024, the values primarily oscillate between 2 and 7 p p b. In mid-March, there is a cluster of points at 6 p p b and a peak at 8 p p b. Between March and June 2024, the concentration mostly stays between 3 and 7 p p b, with a notable peak reaching 10 p p b in late May. From June to September 2024, the data shows a slight upward trend in the upper bound, with a sustained cluster at 8 p p b and one outlier reaching 10 p p b in August, before returning to a range of 5 to 6 p p b by September. Throughout the entire period, the majority of readings are concentrated between 3 and 6 p p b.
5. TDS Increase in Thermal Plants
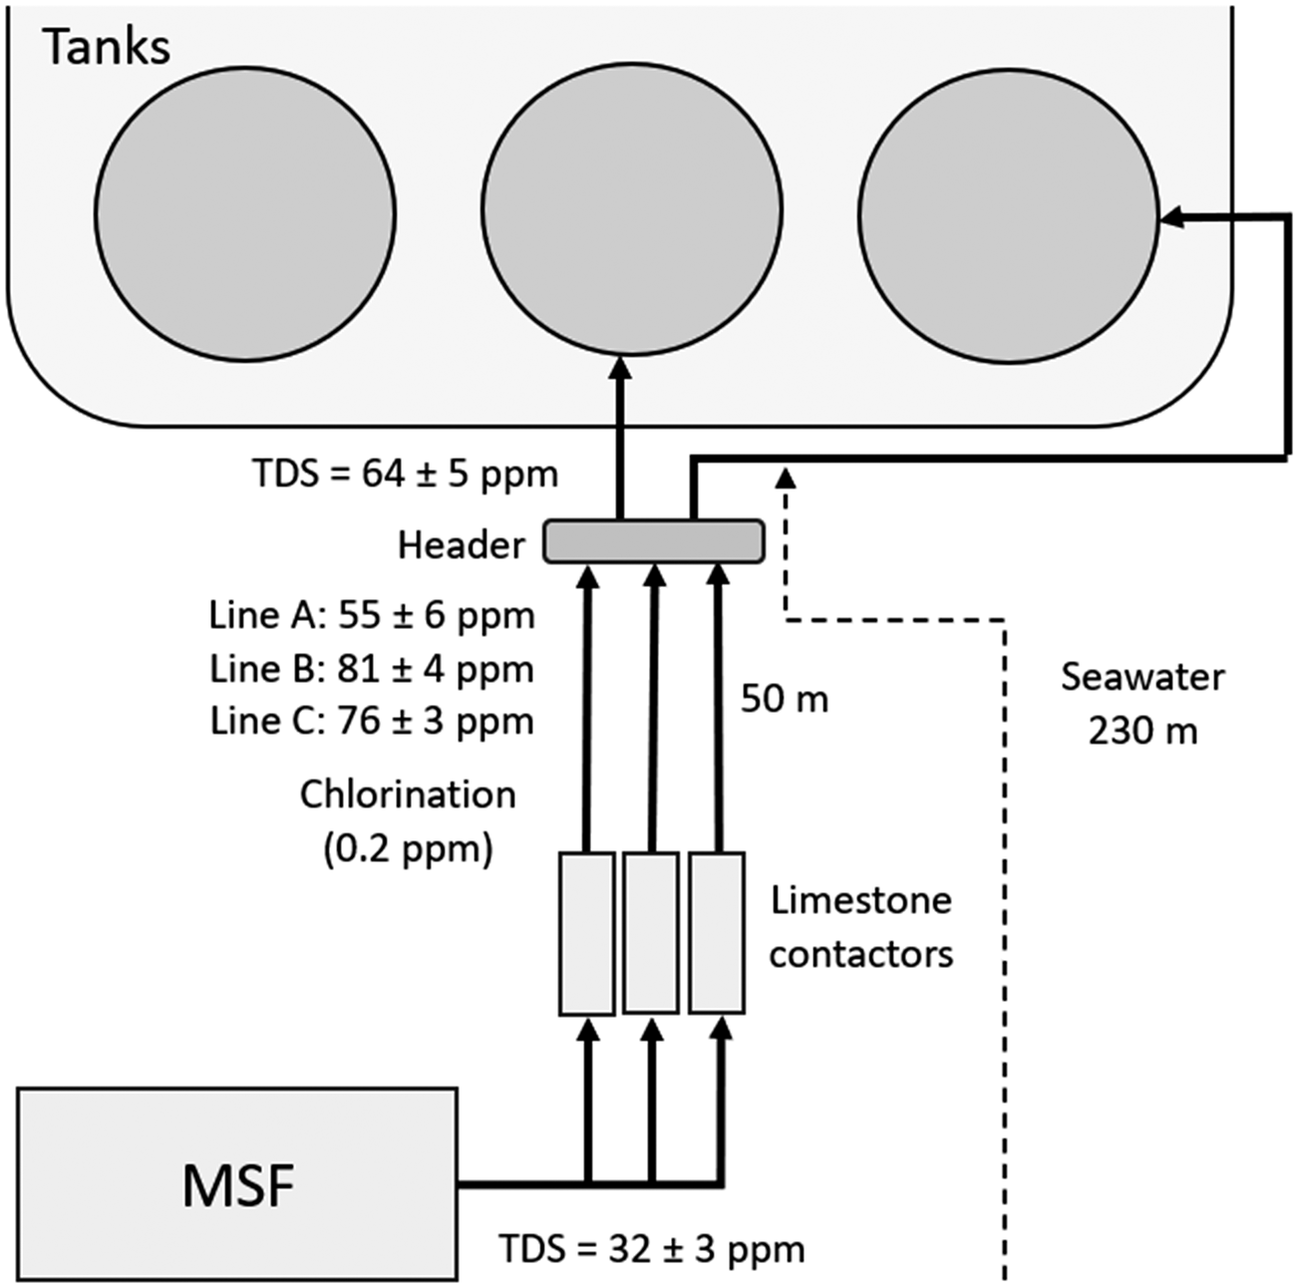
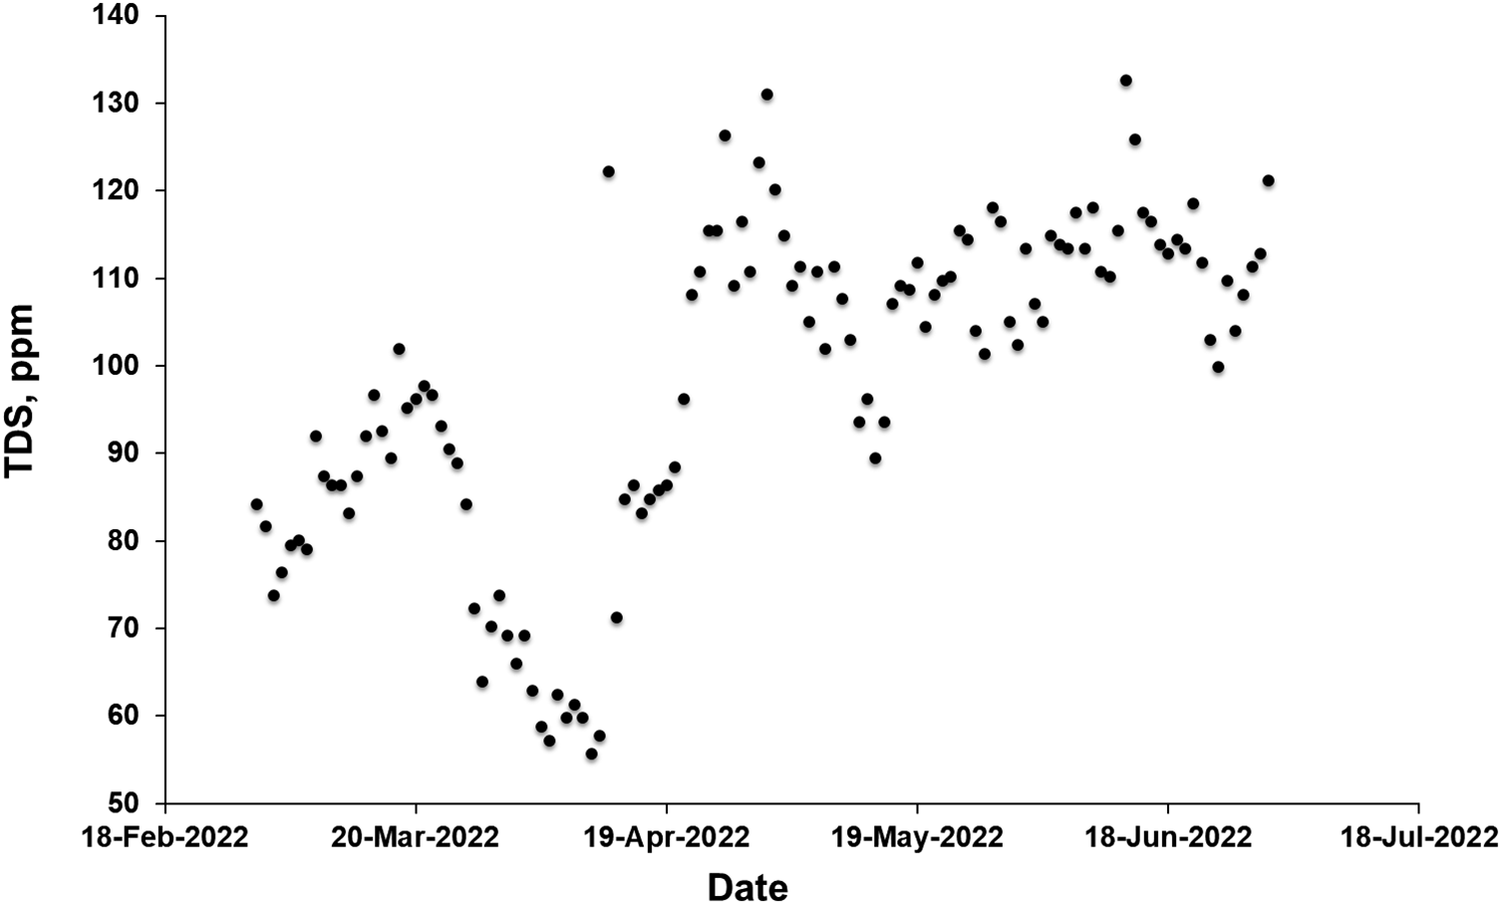
The Shoaibah Ph2 MSF plant, completed in 2007, has a design capacity of 455,000 m3 day−1. In the absence of an RO process stream, seawater (which will have approximately the same composition as RO brine) is the obvious source of additional dissolved solids to raise TDS values above a target threshold. In order to avoid excessive bromate formation, addition of seawater at the Shoaibah Ph 2 MSF plant has been carried out in combination with addition of ammonia at the sub-ppm level [Reference Alhamzah, Alofi, Abid and Fellows17]. In 2019, water reaching the storage tanks after post-treatment had a TDS of 64 ± 5. The system used involves addition of 700 mL m−3 of seawater treated by sand filtration only, injected after post-treatment and chlorination (Figure 18). TDS over the period illustrated in Figure 19 was 80 ± 14 ppm in the period before addition of seawater and 110 ± 10 ppm after addition (from 14 April 2024 onwards).
Schematic of Seawater addition at Shoaibah Ph 2 MSF plant with measured TDS values as of March 2019.

Figure 18. Long description
The diagram illustrates the water flow starting from a rectangular block at the bottom left labeled M S F.
* At the base, water exits the M S F unit with a T D S equal to 32 plus or minus 3 p p m.
* Three parallel vertical lines move upward through three rectangular Limestone contactors.
* Above the contactors, the lines are labeled with specific measurements: Line A is 55 plus or minus 6 p p m, Line B is 81 plus or minus 4 p p m, and Line C is 76 plus or minus 3 p p m.
* A Chlorination note indicates 0.2 p p m is applied in this section.
* The three lines converge into a horizontal gray bar labeled Header.
* From the Header, a central arrow points upward to a large container labeled Tanks, which contains three circular units. The T D S at this entry point is 64 plus or minus 5 p p m.
* A separate line from the Header branches to the right, labeled 50 m, and connects to a Seawater line labeled 230 m.
* A dashed line indicates a secondary path or boundary between the Header and the Seawater source.
Increase in TDS at the Shoiabah Ph2 MSF plant.

Figure 19. Long description
The horizontal X-axis is labeled Date, ranging from 18-Feb-2022 to 18-Jul-2022 in monthly increments. The vertical Y-axis is labeled T D S, p p m, with a scale from 50 to 140 in increments of 10. The data is represented by black circular points.
* From mid-February to late March, the T D S values show a moderate increase from approximately 80 p p m to a peak near 100 p p m.
* From late March to mid-April, there is a sharp decline, reaching the lowest recorded values on the chart at approximately 55 to 60 p p m.
* From mid-April to early May, the values rise sharply, peaking at approximately 130 p p m.
* Throughout May and June, the data points fluctuate significantly but maintain a higher baseline, generally staying between 100 and 120 p p m, with a final peak reaching over 130 p p m in mid-June.
* By July, the values remain elevated compared to the start of the period, clustering around 110 p p m.
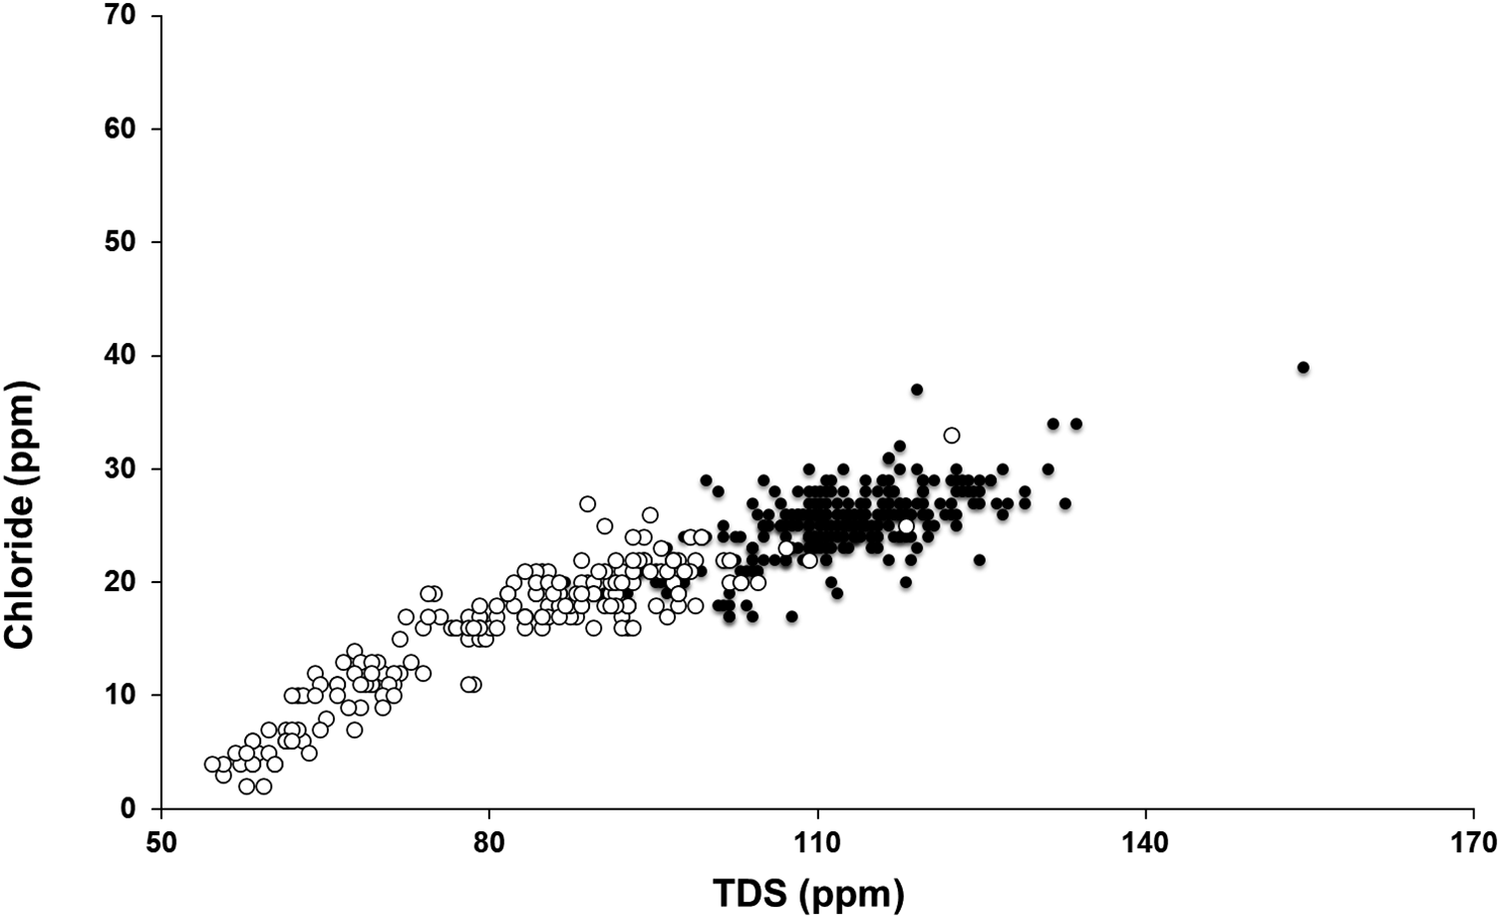
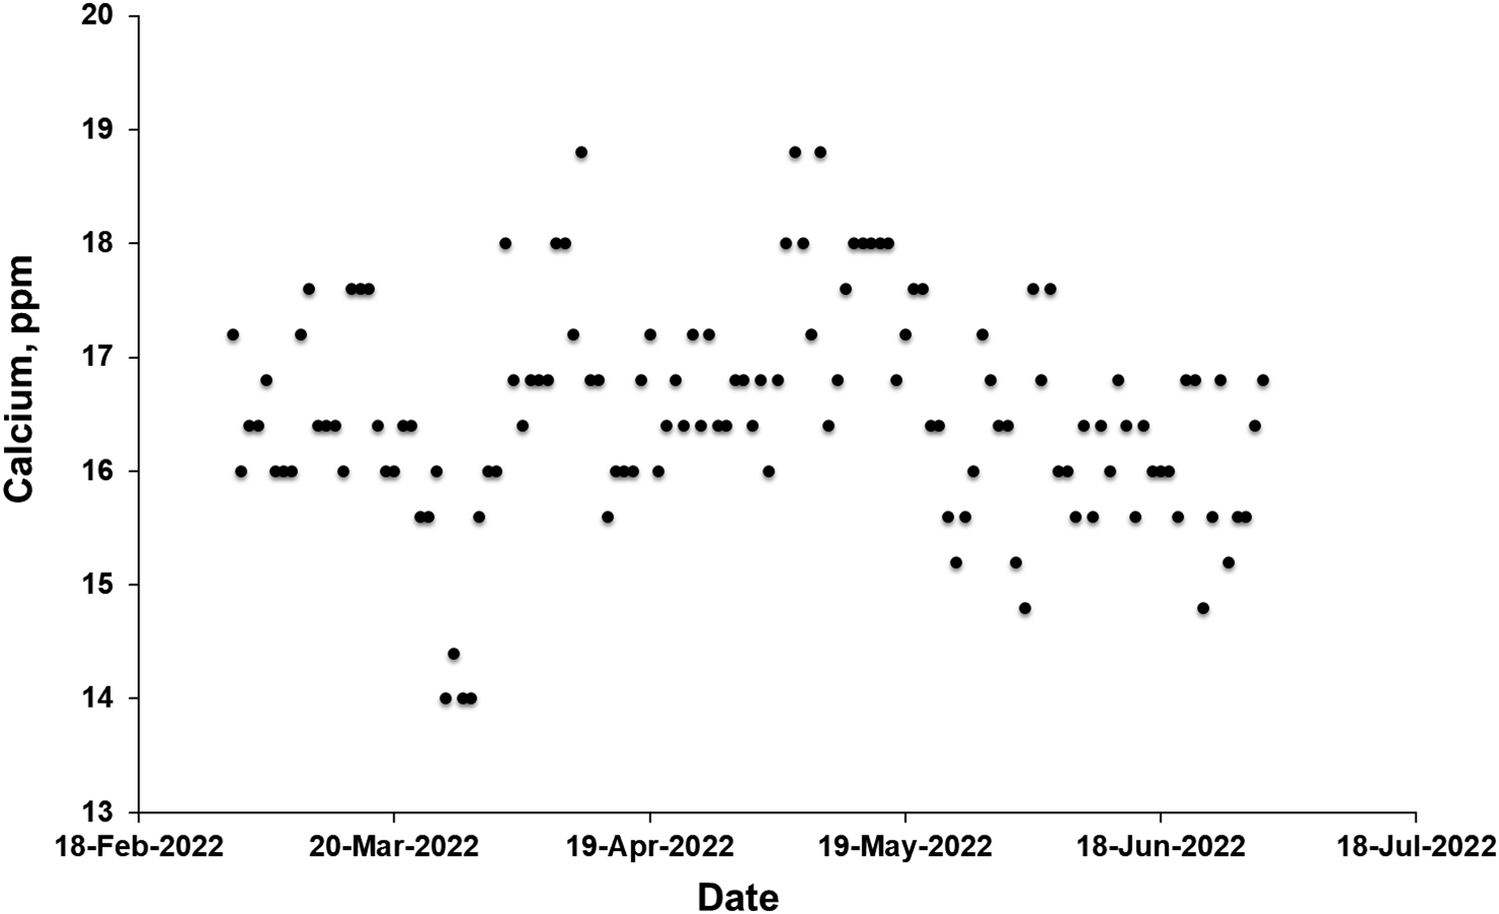
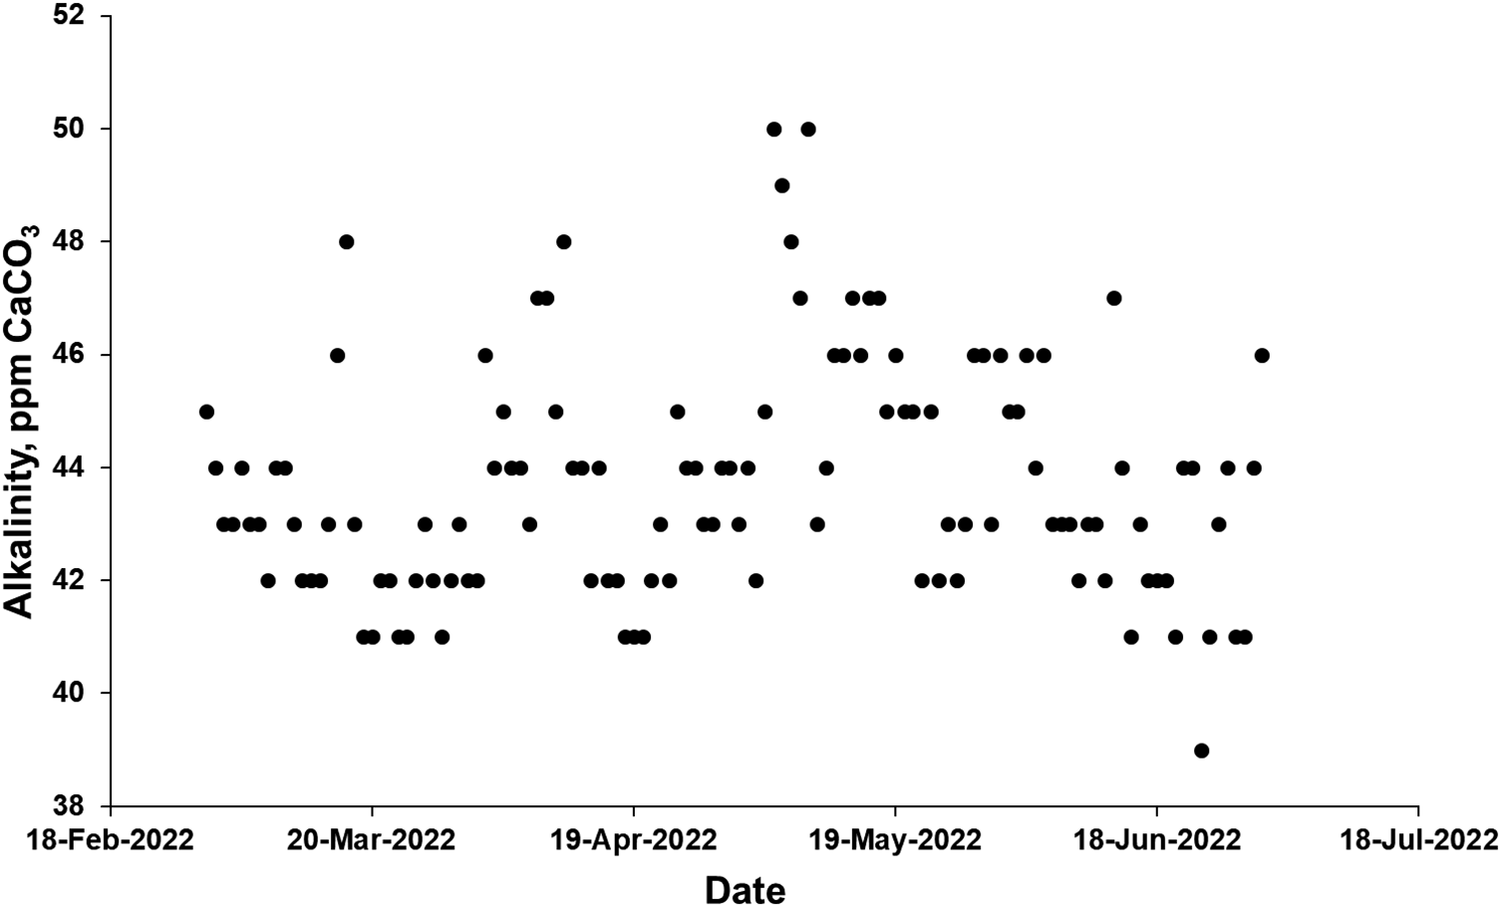
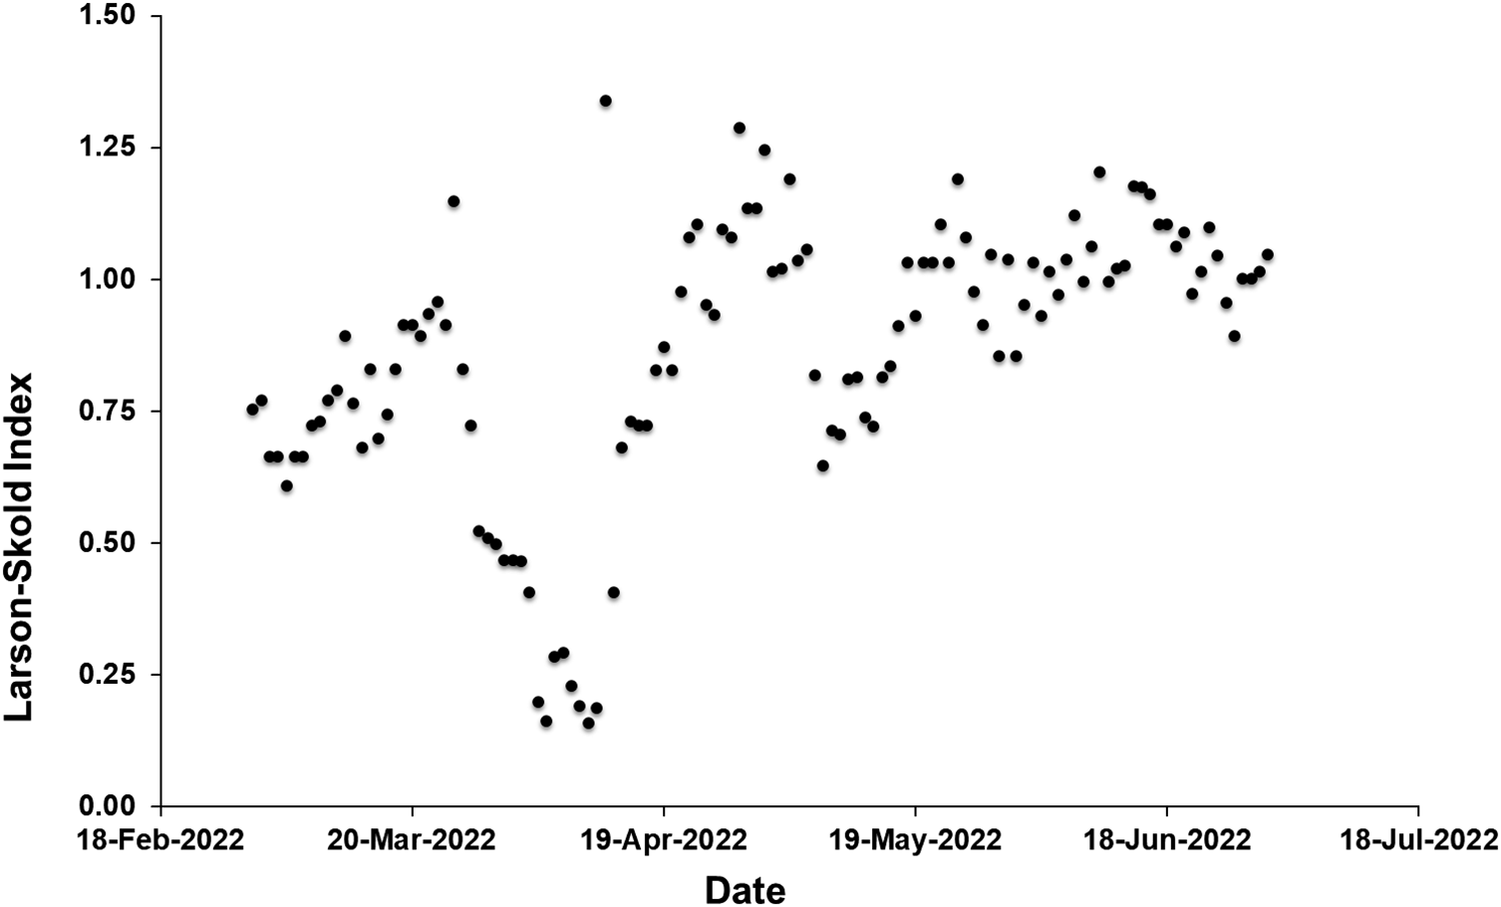
As expected, chloride was highly correlated with TDS (Figure 20). No significant change was observed in calcium concentration (Figure 21) or alkalinity (Figure 22) over the course of the trial, reflecting that the overwhelming majority of both of these is derived from post-treatment with limestone and carbon dioxide. LSI was consistently negative over the course of the study period: However, the product water from Shoaibah Ph2 is mixed with waters from other sources before transmission, and adjustment of LSI to appropriate levels is done at this stage. The Larson–Skold index increased slightly upon seawater addition but remained generally below the target value of 1.2, closely paralleling the trend in TDS (Figure 23).
Relationship between chloride and TDS in product water at the Shoiabah Ph2 MSF plant, before (open circles) and after (solid circles) addition of seawater.

Figure 20. Long description
The x-axis is labeled T D S p p m and ranges from 50 to 170. The y-axis is labeled Chloride p p m and ranges from 0 to 70.
Data points show a strong positive linear trend.
* Open circles representing water before seawater addition are clustered in the lower-left region. These points range from approximately 55 to 105 p p m on the x-axis and 2 to 25 p p m on the y-axis.
* Solid circles representing water after seawater addition are clustered further to the right and higher up. These points are concentrated between 100 and 130 p p m on the x-axis and 18 to 35 p p m on the y-axis.
* One outlier solid circle is located at approximately 155 p p m T D S and 39 p p m Chloride.
Variation in calcium concentration (mg L−1) at the Shoaibah Ph2 MSF plant.

Figure 21. Long description
The scatter plot displays calcium concentration on the vertical Y axis, ranging from 13 to 20 p p m in increments of 1. The horizontal X axis represents the Date, with major tick marks for 18-Feb-2022, 20-Mar-2022, 19-Apr-2022, 19-May-2022, 18-Jun-2022, and 18-Jul-2022.
Data points are represented by black dots. Most measurements fluctuate between 15.5 and 18 p p m throughout the period.
Key observations include:
* A significant dip occurs in late March 2022, where three data points fall to approximately 14 and 14.4 p p m.
* Peak concentrations of approximately 18.8 p p m are reached twice, once in mid-April and once in early May.
* From mid-May to late June, the data shows a slight downward trend, with more frequent readings appearing between 15 and 17 p p m.
* The final data points in July stabilize around 16 to 17 p p m.
Variation in alkalinity (mg L−1 as CaCO3) at the Shoaibah Ph2 MSF plant.

Figure 22. Long description
A scatter plot with the horizontal X axis labeled Date and the vertical Y axis labeled Alkalinity, p p m C a C O sub 3. The X axis ranges from 18-Feb-2022 to 18-Jul-2022 with monthly increments. The Y axis ranges from 38 to 52 in increments of 2.
Data points are represented by black circles. Most data points fluctuate between 41 and 46 p p m.
Key observations include.
* From late February to early May, the alkalinity values mostly oscillate between 41 and 45 p p m, with a single peak reaching 48 p p m in mid-March.
* In early May, there is a significant spike where two data points reach the maximum recorded value of 50 p p m.
* Following this peak, the values stabilize between 42 and 47 p p m through June.
* A single outlier represents the lowest recorded value of 39 p p m in late June.
* The final data points in July return to the 44 to 46 p p m range.
Larson–Skold index at Shoiabah Ph2, with estimated chloride:sulfate ratio from Ras al Khair 2025 data.

Figure 23. Long description
The scatter plot tracks the Larson-Skold Index on the vertical Y-axis, ranging from 0.00 to 1.50 in increments of 0.25. The horizontal X-axis represents the Date, with major ticks for 18-Feb-2022, 20-Mar-2022, 19-Apr-2022, 19-May-2022, 18-Jun-2022, and 18-Jul-2022.
Data trends from left to right:
* From mid-February to late March, the index shows a gradual upward trend, rising from approximately 0.75 to nearly 1.00.
* In late March, there is a sharp decline, reaching the lowest point of the dataset at approximately 0.15 in early April.
* Following this trough, the index rises sharply to a peak of approximately 1.35 in mid-April.
* From late April through June, the data fluctuates significantly between 0.65 and 1.25, with notable local peaks in early May and mid-June.
* By late June and early July, the index stabilizes slightly, hovering between 0.90 and 1.10.
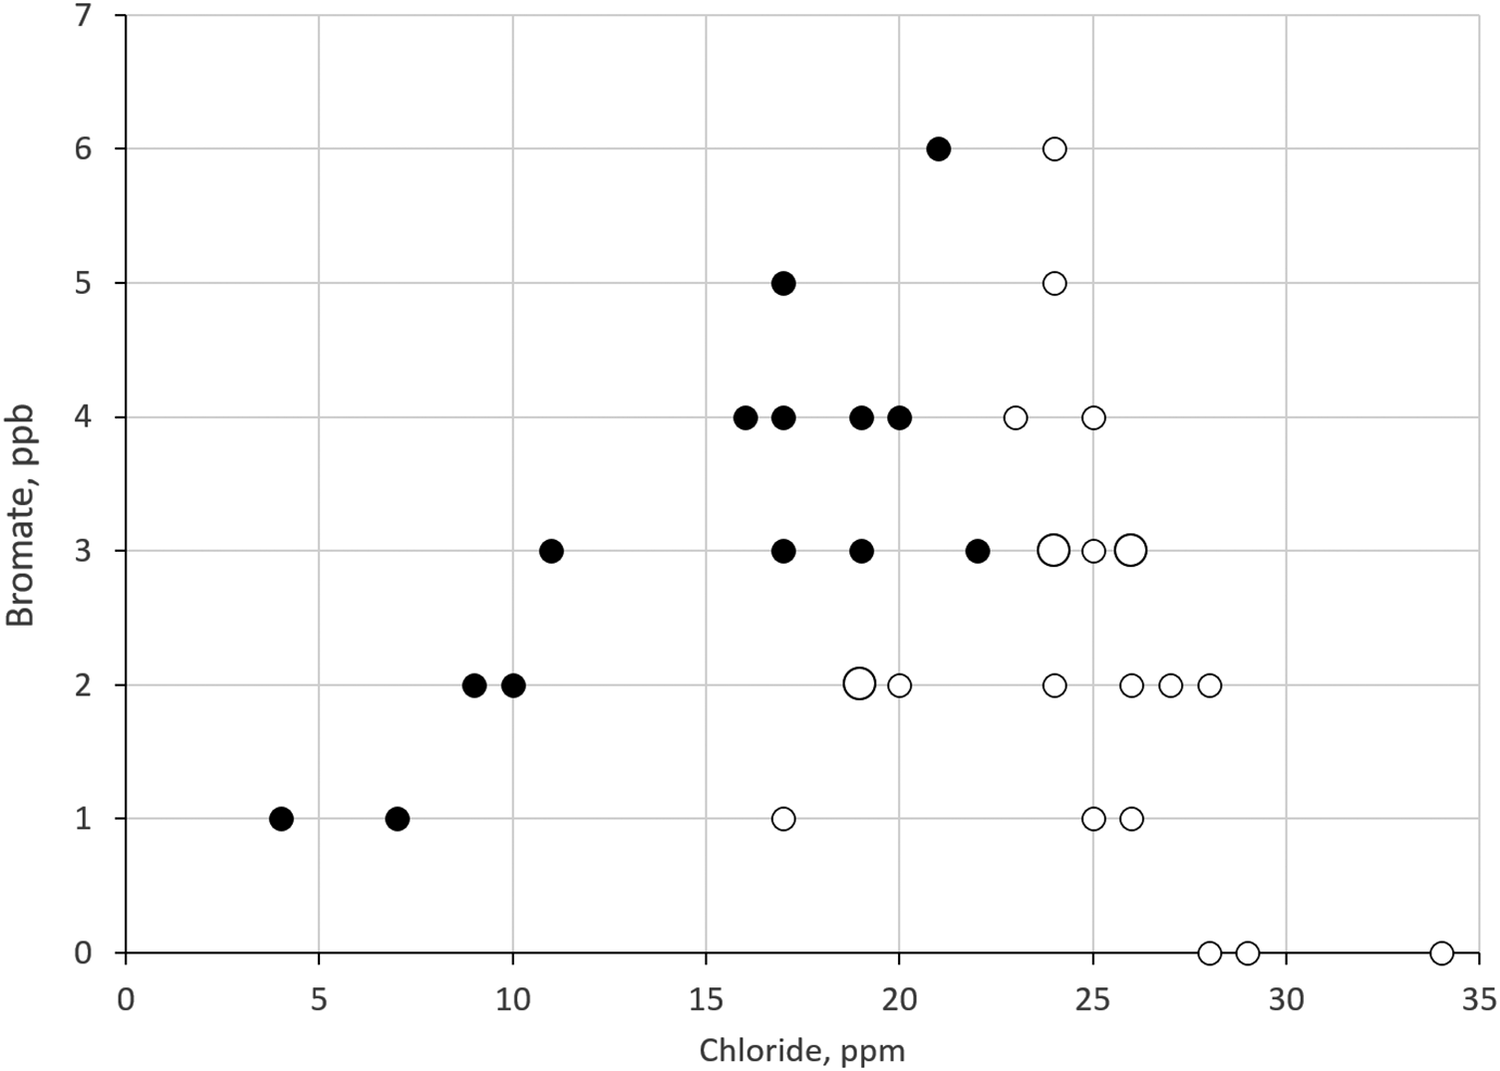
Bromate concentration normally increases in the summer months due to increasing water temperature and would be expected to increase with increasing seawater-derived TDS. However, bromate was measured at 3.0 ± 1.4 ppb before seawater addition (T = 36.2 ± 0.4 °C) and 2.3 ± 1.5 ppb after seawater addition (T = 38.6 ± 0.8 °C), indicating a protective effect of the ammoniation (Figure 24).
Variation of bromate concentration with chloride concentration at the Shoiabah Ph 2 MSF plant before (closed symbols) and after (open symbols) addition of seawater + ammoniation. Smaller symbols indicate a measurement obtained on one day, larger symbols indicate a measurement obtained on two days.

Figure 24. Long description
A scatter plot on a grid. The Y-axis is labeled Bromate, p p b, with a scale from 0 to 7 in increments of 1. The X-axis is labeled Chloride, p p m, with a scale from 0 to 35 in increments of 5.
Data points are represented by circles of two sizes and two fill styles. Closed black circles represent measurements before seawater plus ammoniation. Open white circles represent measurements after addition. Smaller circles indicate one-day measurements, while larger circles indicate two-day measurements.
* Closed circles (Before): These are concentrated on the left side of the graph. They show a positive correlation, starting at 1 p p b bromate for 4 p p m chloride and rising to a peak of 6 p p b bromate at 21 p p m chloride. Most points cluster between 15 and 22 p p m chloride with bromate levels between 3 and 6 p p b.
* Open circles (After): These are shifted to the right, indicating higher chloride levels. They appear between 17 and 34 p p m chloride. Despite the higher chloride, bromate levels are generally lower or more widely distributed, with several points at 0 p p b bromate for chloride levels between 28 and 34 p p m. A vertical cluster of open circles occurs at 24 p p m chloride, ranging from 2 to 6 p p b bromate.
* Larger symbols: A large open circle is visible at approximately 19 p p m chloride and 2 p p b bromate, and another at 26 p p m chloride and 3 p p b bromate.
Chlorine dioxide has been reported to have a lower probability than chlorine of oxidising bromide to bromate, and at the Shoaibah Ph2 MSF plant as well as the plants at Ras al Khair and Khafji there has been a transition to use of chlorine dioxide for disinfection in order to reduce bromate formation [Reference Al-Hamzah, Mahmoodur Rahman and Kurup18].
6. Discussion
Maintaining TDS above the target value of 100 ppm while maintaining all other water quality parameters is an ongoing effort within the system of seawater desalination plants overseen by the SWA, with reduction of BWRO, addition of seawater, and enhanced remineralisation being the main strategies employed through the efforts of operational staff at numerous sites. Cost and availability are the main determinants of which strategy is employed at each location. WTIIRA continues to conduct chemical analyses and physical measurements of samples of the transported water across the SWA network to assess the success of these efforts, with a priority on maintaining the concentration of boron and bromine-derived disinfection byproducts within acceptable levels and avoiding changes in anion concentration that could lead to corrosion of transmission systems.
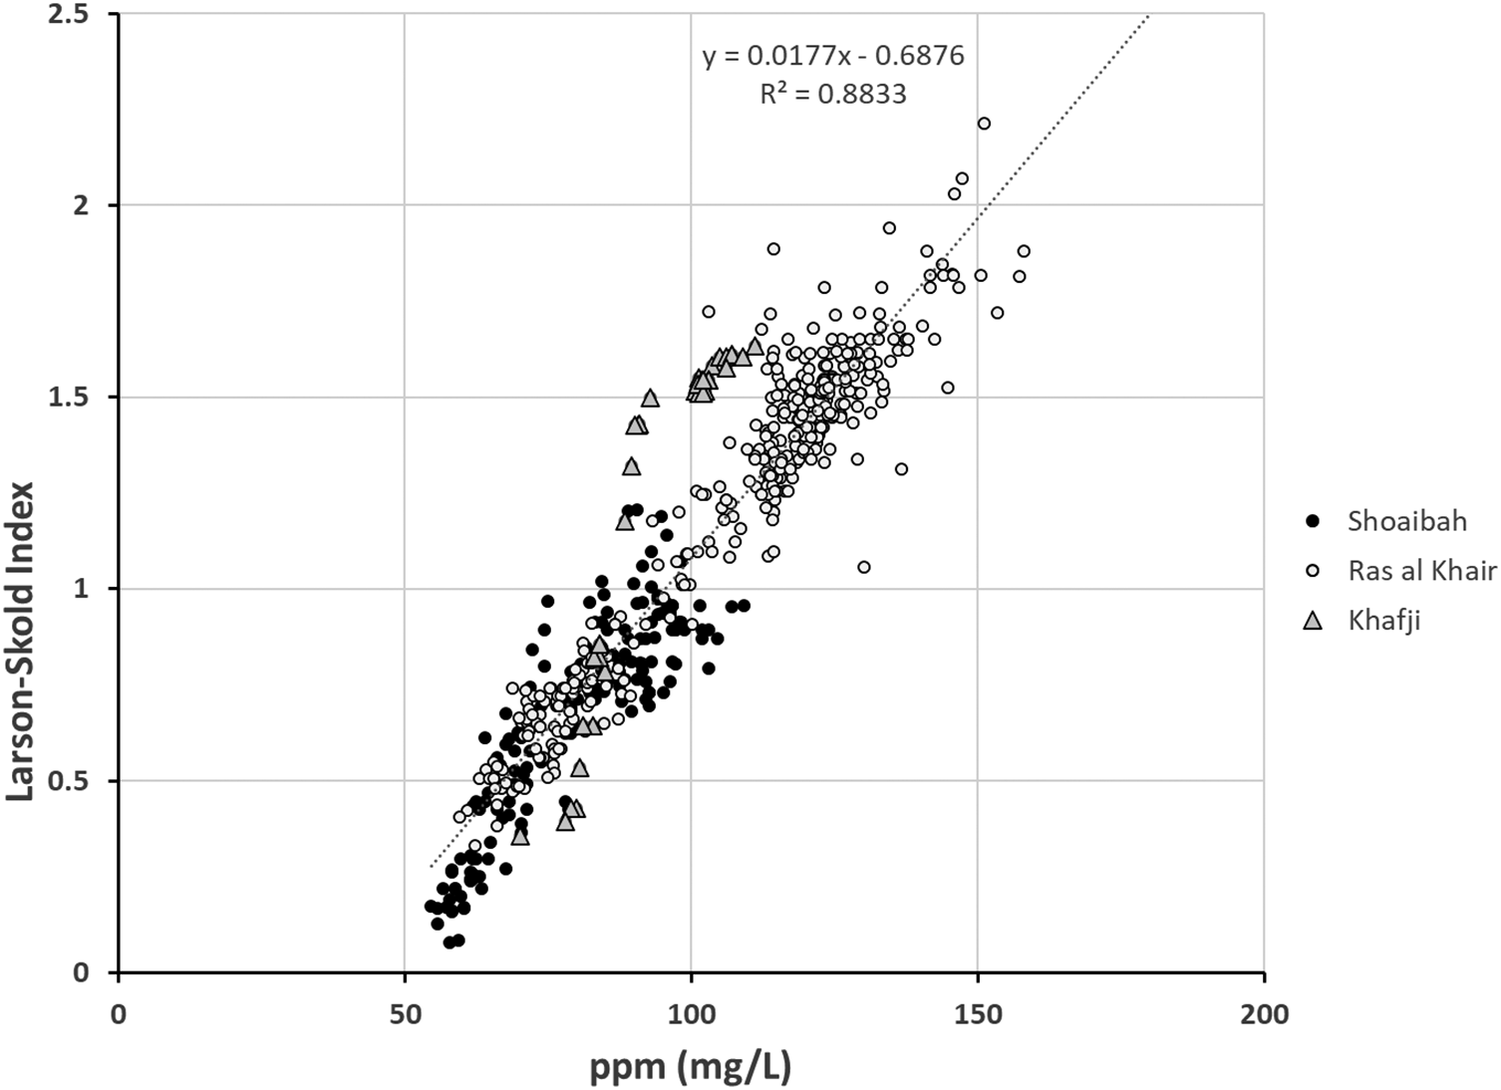
The main operational challenge found in increasing TDS is avoiding corrosion by maintaining the Larson–Skold index below acceptable levels: Necessarily, increasing the amount of hydrogen carbonate ions is required to balance the additional sulfate and chloride introduced from seawater [Reference Asrar, Al Sahari, Al Enazi, Al Radhi and Al Ghamdi6]. While acceptable results above 100 ppm can be achieved with relative ease, TDS above 150 ppm is invariably accompanied by Larson–Skold index levels above 1.2, which cannot readily be remedied without significant capital investment (Figure 25). Higher chloride and sulfate levels must be balanced with increased hydrogen carbonate levels to avoid potential corrosion of the existing transmission systems, which were designed for conveyance of low TDS product water from thermal desalination plants. In existing post-treatment systems, this can only be achieved by increasing the rate of dissolution of calcium carbonate, which in turn requires an increased concentration of carbon dioxide. This incurs increased costs directly for the additional carbon dioxide, and the increased levels of carbonic acid formed may potentially cause corrosion in limestone contactors which were designed for lower flow rates. Cost is also increased through the increased requirement for sodium hydroxide to neutralise the excess carbonic acid, and the increased dosage will potentially lead to scaling near the dosage point in systems designed for use with lower levels of sodium hydroxide, as well as a generally undesirable increase in sodium concentration in the product water. A more tenable long-term solution to increasing hydrogen carbonate concentrations would be to increase residence time in the post-treatment system, rather than carbon dioxide concentration – which would require capital investment in additional contactors to maintain the same water production levels. Alternatively, the surface area for the dissolution reaction could be increased to increase the rate of reaction, through the use of micronised limestones provided by suppliers such as Omya and Lhoist [Reference Hasson, Fine, Sagiv, Semiat and Shemer14]; this would require additional operational expenditure and alterations to existing contactor infrastructure. Studies of increasing the efficiency of remineralisation are currently under way within the SWA system of seawater desalination plants.
Correlation between calculated Larson–Skold index values and measured TDS at Shoiabah (filled circles), Ras al Khair (open circles), and Khafji (triangles) desalination plants.

Figure 25. Long description
A scatter plot with a grid background.
* The horizontal X-axis is labeled p p m (m g / L) with a scale from 0 to 200 in increments of 50.
* The vertical Y-axis is labeled Larson-Skold Index with a scale from 0 to 2.5 in increments of 0.5.
* A legend on the right identifies three data series: Shoiabah (filled circles), Ras al Khair (open circles), and Khafji (triangles).
* The data points show a strong positive linear trend starting from approximately 50 p p m on the X-axis and 0.1 on the Y-axis, extending to 160 p p m on the X-axis and 2.2 on the Y-axis.
* A dotted linear regression line passes through the data.
* Near the top center, the regression equation is provided as y = 0.0177 x minus 0.6876 with an R-squared value of 0.8833.
* Shoiabah data is concentrated between 50 and 110 p p m. Ras al Khair data is the most extensive, ranging from 60 to 160 p p m. Khafji data is clustered in two groups around 70 to 90 p p m and 100 to 110 p p m.
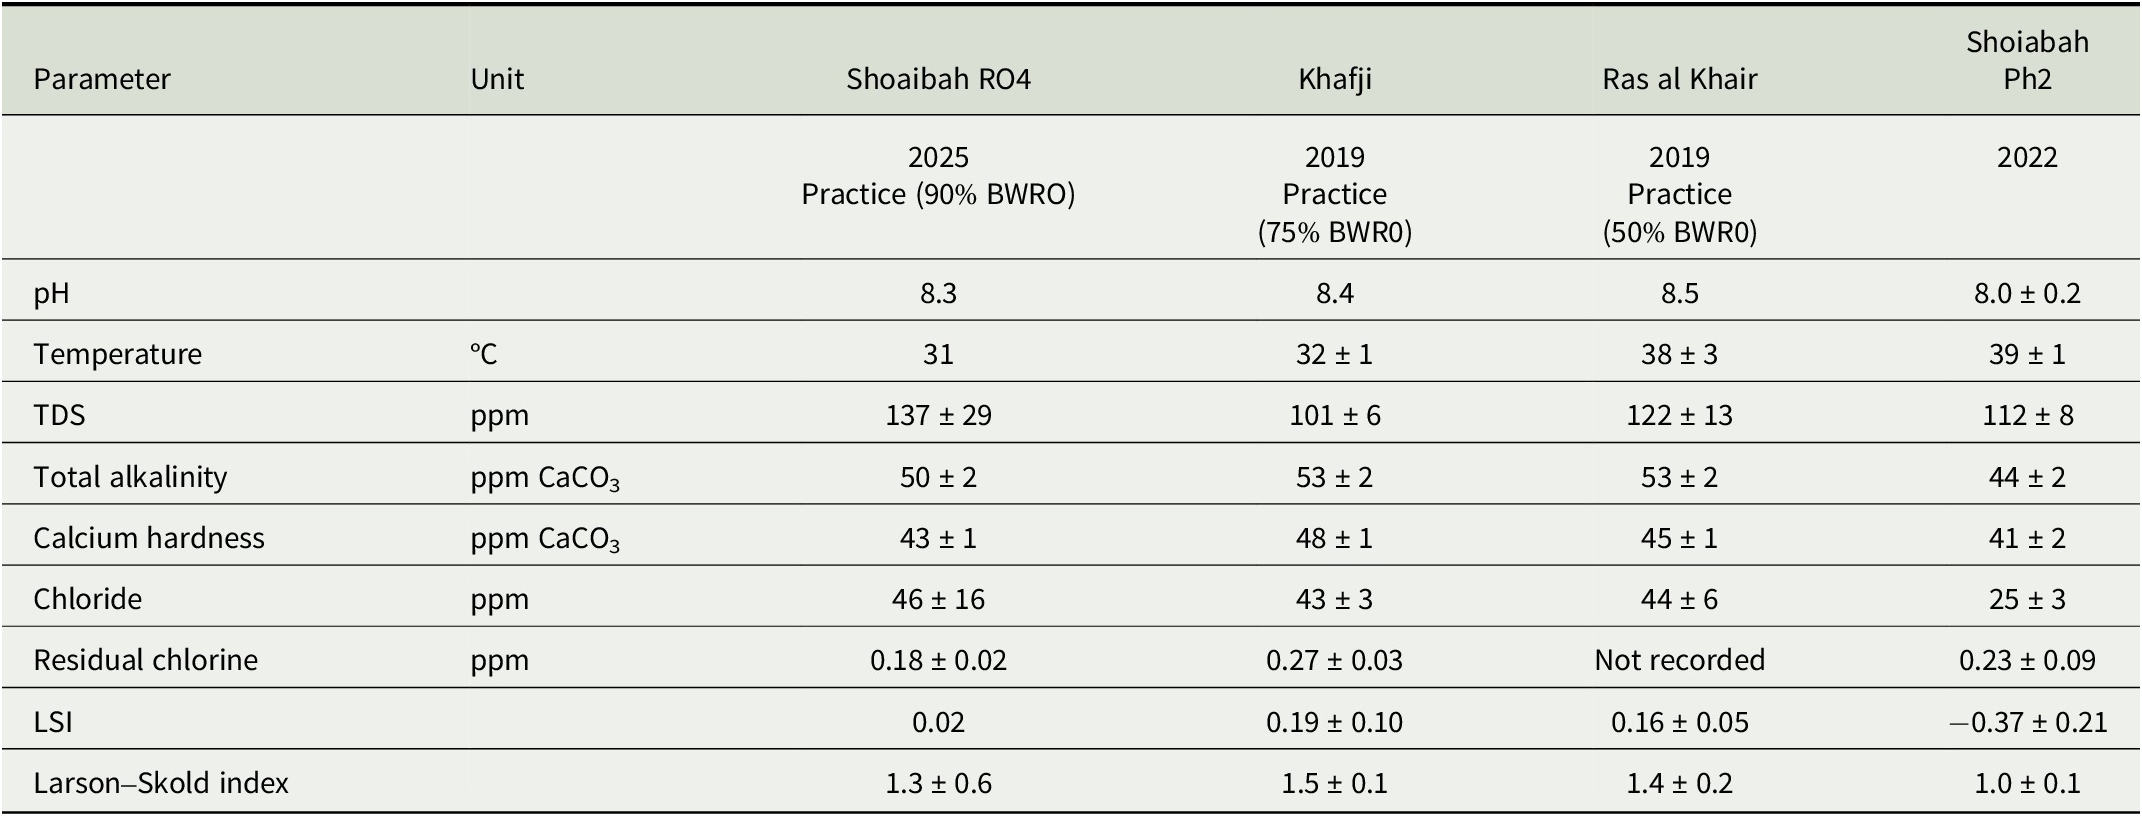
The main characteristics of product water obtained from SWRO plants with reduced BWRO (Shoiabah RO4 and Khafji), combined SWRO and MSF plant (Ras al Khair) and MSF plant with seawater addition are compared in Table 5. Recalling that Shoaibah Ph2 output is not fully remineralised before combination with other water sources, it is evident that targeting TDS values between 101 and 137 ppm can be achieved by addition of seawater without negative impacts on key water quality parameters.
Summary of water quality parameters after actions to increase TDS to target range in SWA plants.

Table 5. Long description
The table consists of six columns: Parameter, Unit, Shoaibah R O 4 (2025 Practice 90% B W R O), Khafji (2019 Practice 75% B W R O), Ras al Khair (2019 Practice 50% B W R O), and Shoiabah Ph 2 (2022).
* p H: Shoaibah R O 4 is 8.3; Khafji is 8.4; Ras al Khair is 8.5; Shoiabah Ph 2 is 8.0 plus or minus 0.2.
* Temperature (degrees Celsius): Shoaibah R O 4 is 31; Khafji is 32 plus or minus 1; Ras al Khair is 38 plus or minus 3; Shoiabah Ph 2 is 39 plus or minus 1.
* T D S (p p m): Shoaibah R O 4 is 137 plus or minus 29; Khafji is 101 plus or minus 6; Ras al Khair is 122 plus or minus 13; Shoiabah Ph 2 is 112 plus or minus 8.
* Total alkalinity (p p m C a C O sub 3): Shoaibah R O 4 is 50 plus or minus 2; Khafji is 53 plus or minus 2; Ras al Khair is 53 plus or minus 2; Shoiabah Ph 2 is 44 plus or minus 2.
* Calcium hardness (p p m C a C O sub 3): Shoaibah R O 4 is 43 plus or minus 1; Khafji is 48 plus or minus 1; Ras al Khair is 45 plus or minus 1; Shoiabah Ph 2 is 41 plus or minus 2.
* Chloride (p p m): Shoaibah R O 4 is 46 plus or minus 16; Khafji is 43 plus or minus 3; Ras al Khair is 44 plus or minus 6; Shoiabah Ph 2 is 25 plus or minus 3.
* Residual chlorine (p p m): Shoaibah R O 4 is 0.18 plus or minus 0.02; Khafji is 0.27 plus or minus 0.03; Ras al Khair is Not recorded; Shoiabah Ph 2 is 0.23 plus or minus 0.09.
* L S I: Shoaibah R O 4 is 0.02; Khafji is 0.19 plus or minus 0.10; Ras al Khair is 0.16 plus or minus 0.05; Shoiabah Ph 2 is minus 0.37 plus or minus 0.21.
* Larson-Skold index: Shoaibah R O 4 is 1.3 plus or minus 0.6; Khafji is 1.5 plus or minus 0.1; Ras al Khair is 1.4 plus or minus 0.2; Shoiabah Ph 2 is 1.0 plus or minus 0.1.
This study has been limited by the exigencies of collecting data and adjusting operational procedures around the day-to-day requirements of water production and transmission within a commercial network, but conversely has benefitted greatly from access to the world’s largest integrated system for production of desalinated potable water. Work on increasing the efficiency of remineralisation is ongoing within the SWA network, but in the medium term the problem of low TDS water is likely to disappear, to be replaced with the problem of managing high TDS water. Thermal desalination processes, which provide approximately half of the seawater desalination capacity in the Kingdom of Saudi Arabia, are being systematically replaced with more energy-efficient SWRO systems. As operated in the Kingdom of Saudi Arabia, SWRO plants consistently deliver higher TDS water than the legacy MSF and MED plants, and there is strong pressure to reduce operational costs in such a way as to raise TDS further. In the longer term, replacement of the existing transmission system with materials less susceptible to corrosion (e.g., use of non-metallic pipelines and tanks) is envisioned as the way to safely delivery higher TDS water to consumers in the Kingdom of Saudi Arabia, with the goal of lifting typical TDS values beyond 200 ppm. The other potential issues observed, such as excessively high LSI or unacceptable bromate and boron levels, are likely to become significant only at these higher target TDS values. Increased bromate levels can be avoided by changes in disinfection processes, for example, by moving from chlorination to the use of chlorine dioxide or chloramine as alternative disinfectants. To maintain boron levels within the levels required to meet health standards and to ensure wastewater is suitable for agricultural uses, specific technologies for boron removal will need to be implemented for treatment of high TDS desalination product water [Reference Figueira, Reig, de Labastida, Cortina and Valderrama19].
Open peer review
To view the open peer review materials for this article, please visit http://doi.org/10.1017/S2978171X26000020.
Author Contributions
The project was initiated by co-author Al-Hamzah, who organised collection of data from the plants and sample analysis in WTIIRA laboratories. Both co-authors carried out formal analysis of the data. Co-author Fellows prepared the original draft which was revised by co-author Al-Hamzah.
Financial Support
This research received no specific grant from any funding agency, commercial, or not-for-profit sectors.
Competing interests
The authors are employees of the Saudi Water Authority and carried out this work as part of their regular employment.
Data Availability Statement
All data presented in this article is available upon request.

 Open access


Comments
Dear Editors,
Please find attached a submission with the rather unwieldy title “Saudi Water Authority (SWA) Strategies for raising the total dissolved solids (TDS) concentration of water produced and transported from desalination plants: Advantages and challenges”. All co-authors agree with its submission and it is not currently under consideration at any other journal. We received a message from David Hopwood inviting us to submit this manuscript based on its appearance on a pre-print server. This version incorporates minor changes from the pre-print version, made in response to a reviewer’s report received from another journal where it is no longer under consideration. We are very pleased to see the appearance of this journal: the independent journal with a strong industry focus where we would once have placed this kind of work was acquired by one of the gigantic publishers and lost its focus.
Yours Sincerely,
Dr Chris Fellows